
Let’s chat about something you’re all too familiar with – the data overload. You’ve been there: drowning in metrics, clients eager for results, and managing more dashboards than you can count. Sound familiar?
Today, we’re breaking down two key pieces that will make your life smoother and your clients happier: monitoring and reporting.
We’ll cover:
- Why real-time monitoring is crucial for staying on top of campaigns
- How smart reporting can take your client presentations from average to impressive
- Why keeping monitoring and reporting separate is crucial (and what happens when you don’t)
- Pro tips on using contextual reporting and data storytelling to really shine
Ready to turn those numbers into stories your clients will love? Let’s get into it.
Monitoring = A Keen Sense of Detail
As an agency, keeping a close eye on your digital marketing campaigns is essential. That’s where monitoring steps in. It’s your real-time view into what’s happening at this very moment. How many clicks is your ad getting right now? Which social media post is doing well today?
Take email campaigns as an example. tracking click-through rates (CTR) instantly reveals if your subject line is a hit or miss. Fun fact: the average CTR for email marketing is around 2.6%. If you’re beating that, you’re doing great!
Here’s the thing: 87% of marketers think data is underutilized. Prioritize monitoring, and you’ll join the smart 13% who catch those crucial shifts that can make or break a campaign.
Quick rundown of what monitoring is (and isn’t):
| Monitoring Is | Monitoring Isn’t |
|---|---|
| Real-time insights | Historical analysis |
| Quick problem-spotting | Long-term strategy planning |
| Immediate optimization | In-depth reporting |
| Day-to-day management | Client presentations |
Reporting = Understanding the Full Context
If monitoring is your magnifying glass, reporting is your telescope. It’s stepping back and looking at all the data – last month’s, last quarter’s, your entire campaign history – and asking, “What’s the big picture?” It’s about spotting the trends, patterns, and outcomes that will impress your clients.
Marketing analytics currently influence just over half of all marketing decisions. Establish regular procedures for tracking metrics and enhancing conversion rates, and you can dramatically tip the scales in your favor.
For example, you’ve just cracked the code on why your email open rates took a nosedive. The culprit? A subject line in your recent campaign accidentally triggered spam filters, burying your latest emails in the digital abyss. That’s the kind of insight that makes clients sit up and take notice.
Whether you’re creating an email marketing report or presenting to a client, remember: they want the highlights, not the whole story. Focus on the key insights that impact their business the most. While every client report is different, here are some elements that really make an impact:
- A summary of 6-9 crucial metrics (include goals and outcomes, like conversions or clicks)
- A detailed account of your completed actions and future plans
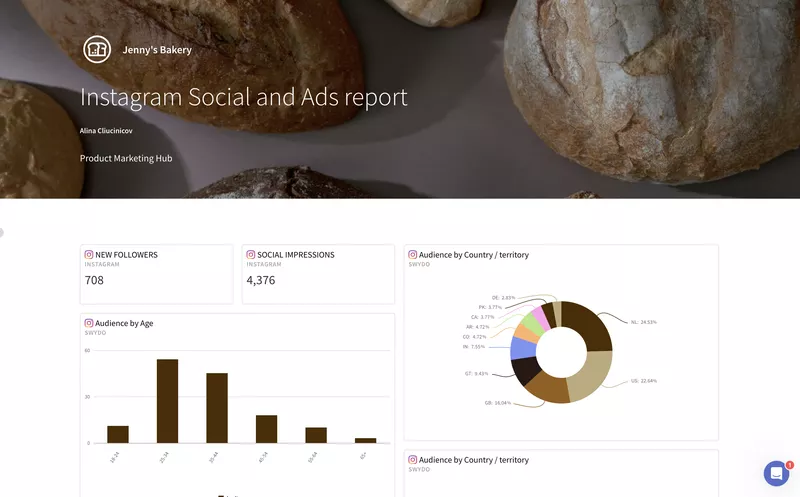
- Eye-catching graphs (data visualization is your friend)
- A glossary (don’t assume clients know all the marketing lingo)
Good reporting isn’t just about handing over numbers to your clients. It’s about telling a clear story of what’s happening and giving them actionable insights they can use to make decisions.
Related: Client Reporting Best Practices.
How to Keep Your Monitoring and Reporting Distinct

Now, You might be tempted to combine monitoring and reporting and be done with it. Here’s why keeping them separate is key to your agency’s success.
| Aspect | Monitoring | Reporting |
|---|---|---|
| Time Frame | Real-time / Daily | Weekly / Monthly / Quarterly |
| Primary Focus | Immediate insights and quick fixes | Long-term trends and strategy |
| Key Metrics | CTR, CPC, Real-time engagement | ROI, Conversion rates, Overall performance |
| Main Users | Marketing team, Campaign managers | Clients, Stakeholders, Upper management |
| Action Taken | Immediate optimizations, Pause/adjust campaigns | Strategy adjustments, Budget allocation |
Think of monitoring and reporting as peanut butter and jelly — great together, but each with its own distinct flavor.
Here’s a fun way to think about it:
| Monitoring | Reporting |
|---|---|
| The play-by-play announcer | The post-game analysis |
| The daily weather forecast | The climate change report |
| Your Fitbit | Your annual physical |
Monitoring and reporting might seem similar, but they serve different purposes and audiences. It’s important to realize that keeping an eye on things and sharing what you’ve found with stakeholders and clients are two different jobs for digital marketing agencies.
For example, when creating an SEO report for a C-suite executive, you’ll want to condense the complexities of SEO into high-level insights. Showcase how SEO influences business goals, provide a snapshot of traffic and conversions, and offer a clear view of ROI. Throw in some competitor benchmarking to give executives a clear market standing and guide future marketing decisions.
Having separate dashboards for monitoring and reporting allows you to tailor each one to its specific purpose. They become more focused, more relevant, and easier for the intended audience to understand. This makes them much more effective for their intended use. So, keep monitoring and reporting as separate entities – your digital marketing strategy (and your clients) will thank you for this clear distinction.
Related: Reporting KPIs: A Mini-Guide to Creating Effective KPI Dashboards and KPI Report
Frequently Asked Questions
Let’s get into some key questions that can help you better understand monitoring and reporting in digital marketing:
What’s the fundamental difference between monitoring and reporting?
Monitoring is your real-time tracking and quick reaction tool. It’s like keeping your finger on the pulse of your campaigns, allowing you to make immediate adjustments. Reporting, on the other hand, is your analysis powerhouse, helping you identify trends and inform strategy over time. Think of monitoring as checking your speedometer while driving, and reporting as reviewing your trip data after a long journey.
How do the metrics I focus on differ between monitoring and reporting?
For monitoring, you’re eyeing metrics that fluctuate quickly and require immediate action, like click-through rates, cost per click, or real-time engagement. With reporting, you’re zooming out to big-picture metrics that show overall performance and ROI, such as conversion rates, customer lifetime value, or month-over-month growth. Tools like Swydo can help you track both types of metrics, allowing you to switch between short-term and long-term views easily.
How often should I be doing each? Is daily monitoring and monthly reporting a good rule of thumb?
While daily monitoring and monthly reporting is a common approach, the ideal frequency depends on your specific campaigns and client needs. Some high-stakes campaigns might require hourly monitoring, while others might be fine with weekly checks. For reporting, monthly is standard, but you might do quarterly reports for long-term strategies or weekly snapshots for intense, short-term campaigns. The key is to find a rhythm that allows you to be responsive without drowning in data.
How do I determine which KPIs to focus on for monitoring vs. reporting?
For monitoring, focus on KPIs that:
- Can change rapidly
- Directly impact campaign performance
- You can act on quickly
For reporting, prioritize KPIs that:
- Align with overall business goals
- Show progress over time
- Provide insights for strategic decisions
Swydo’s customizable dashboards can help you separate these KPIs effectively, ensuring you’re looking at the right metrics at the right time.
How can I use monitoring data to improve my reporting?
Monitoring data can provide valuable context for your reports. For example, if your monthly report shows a spike in conversions, you can reference your monitoring data to explain why – perhaps you made a real-time adjustment to ad copy that paid off. This connection between day-to-day actions and overall results can make your reports more insightful and actionable.
What are some common mistakes people make when trying to balance monitoring and reporting?
Some common pitfalls include:
- Over-reacting to short-term fluctuations seen in monitoring
- Not connecting monitoring insights to long-term trends in reporting
- Using the same metrics for both monitoring and reporting without considering their different purposes
- Spending so much time on monitoring that reporting becomes an afterthought (or vice versa)
How do I communicate the value of both monitoring and reporting to clients who might not understand the difference?
Explain monitoring as the day-to-day management of their campaigns – it’s how you ensure their money is being spent effectively in real-time. Reporting, then, is how you show the results of all that careful monitoring and optimization. You might use an analogy: monitoring is like checking your fitness tracker throughout a workout to pace yourself, while reporting is like reviewing your progress over a month to see how much fitter you’ve become.
How can tools like Swydo help in differentiating and improving both monitoring and reporting processes?
Swydo and similar tools can help by:
- Offering different visualization options suitable for quick monitoring glances and more detailed report deep-dives
- Providing real-time dashboards for monitoring alongside customizable templates for in-depth reports
- Allowing you to set alerts for monitoring thresholds while also offering scheduled report generation
- Integrating data from multiple sources, giving you a comprehensive view for both daily checks and long-term analysis
How is Swydo different from Power BI & Tableau?
Those guys target generic data analytics. Swydo focuses on marketing agencies’ specific needs and wants. Swydo’s promise: a streamlined, user-friendly experience. Over 2000+ marketers from over 80 countries trust Swydo with their client reporting needs. Check it out for yourself by starting a free 14-day trial, or dive in deeper with our experts through a personalized demo.
Turn Data into Action With Swydo’s Monitoring Tool
As a marketing agency, you juggle multiple clients, campaigns, and data sources. Swydo brings all this together, making your life easier and your reports more impactful.
Let’s break down how Swydo can transform your monitoring and reporting process:
Monitoring Made Easy
Swydo’s Monitoring Tool gives you a bird’s-eye view of all your client KPIs in one central dashboard. Here’s what you can do:
- Get a quick overview of all your clients and campaigns
- Set up custom KPI dashboards for each client
- Receive alerts when KPIs hit or miss your set targets
- Use filters to zero in on specific insights by client, account manager, or KPI state
- Track progress and monitor trends across 30+ marketing integrations
With automatic updates and alerts, you’ll catch issues before they become problems. No more last-minute surprises or missed opportunities.
Reporting in Minutes, Not Hours
Creating comprehensive reports doesn’t have to eat up your day. With Swydo’s reporting tools, you can:
- Generate professional PPC, SEO, and social media reports in minutes
- Choose from hundreds of templates or create your own
- Customize reports with your branding (logo, colors, text styles)
- Set up auto-scheduling to send reports as often as needed
- Create custom widgets if you don’t see what you need
Want to really impress your clients? Add executive summaries using text widgets to help them understand the data better.
This proactive approach means you’re always one step ahead, ready to optimize campaigns and deliver better results for your clients.
Why Agencies Love Swydo
- Time-saver: No more monthly reporting labor. Set it up once, and you’re good to go.
- Easy to use: Drag-and-drop interface makes report creation a breeze.
- Flexible: Customize everything to meet your clients’ specific needs.
- Multi-language: Communicate with clients in their native language (14 languages available).
- Shareable: Send reports as PDFs or use online HTML reports – whatever works best for your clients.
Citrus Nobilis, a top digital marketing firm in Greece, struggled with effective client reporting and working together as a team. Here’s’ how Swydo helped them, and many others, improve their reporting workflow and increase their team’s productivity by 30%.
From Monitoring to Action
Here’s where Swydo really shines: You can link your KPI dashboards directly to custom reports, and set up alerts for critical metrics.
This powerful combination means you’re not just seeing numbers – you’re understanding the story behind them and getting notified when it’s time to act.
- Set up custom alerts for your most important KPIs
- Get notified instantly when metrics hit or miss your targets
- Dive deep into the data behind each alert with linked custom reports
- Use these timely insights to make data-driven decisions that boost your clients’ ROI
With Swydo’s monitoring, alerts, and reporting working together, you’ll catch issues early, spot opportunities fast, and always know where to focus your efforts for maximum impact.
Want to see how Swydo can transform your agency’s data game? Give it a spin with a free 14-day trial – no credit card required, and you can cancel anytime.
The agencies that can turn numbers into narratives – and alerts into actions – are the ones that win. Swydo gives you the tools to do just that, letting you focus on what you do best – optimizing campaigns and growing your clients’ businesses.
Conclusion
Cut down on those hours spent on tracking data from multiple channels. Swydo’s got your back. Our platform streamlines the chore of converting complex marketing metrics into A1 reports & monitoring dashboards. All so you can better understand— and share—your insights. Try it for free today!