
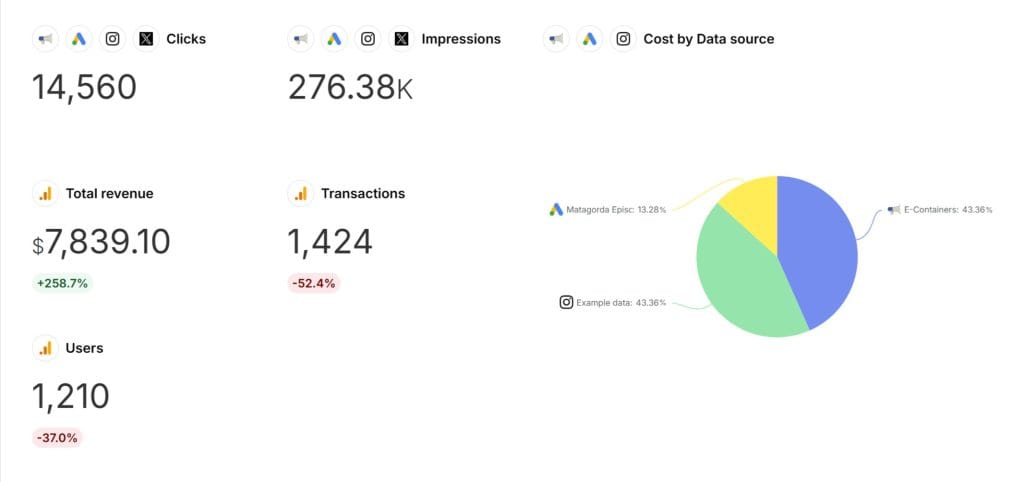
Data blending in Looker Studio pulls separate metrics into one clear snapshot. Agencies juggle stuff like Google Analytics 4 (GA4), Google Search Console (GSC), ad tools, and client CRMs to show ROI or fix campaign hiccups. Tie these together—say, GA4’s user stats with GSC’s search numbers—and you ditch the hassle of manual data patching.
This guide walks through blending data in Looker Studio, spotlighting GA4 and GSC as a hands-on case, while tossing in tips for agencies to tweak it for any client or tool, sorting out messes like jumbled data, rushed deadlines, and client demands for solid reports.
What Makes Data Blending in Looker Studio Worth It for Agencies
Picture juggling a dozen clients, each with their own setups and goals. Link GA4’s bounce rates to GSC’s click counts, or match ad spend with conversions, and you cut through the chaos of flipping between tools. Nail down answers fast: “Does SEO bring in decent traffic?” or “Which campaigns actually pay off?” Blending data in Looker Studio hands agencies a single spot for insights that shape choices on the fly.
Got worries about slow Looker Studio reports with tons of client data? Lean on early filters and tight blends to keep things snappy, so you’re not stuck waiting during a client huddle.
1. Get Your Data Sources Ready for Blending in Looker Studio
First, verify that you have GA4 and GSC accounts associated with the Google account you are logging into Looker Studio with.
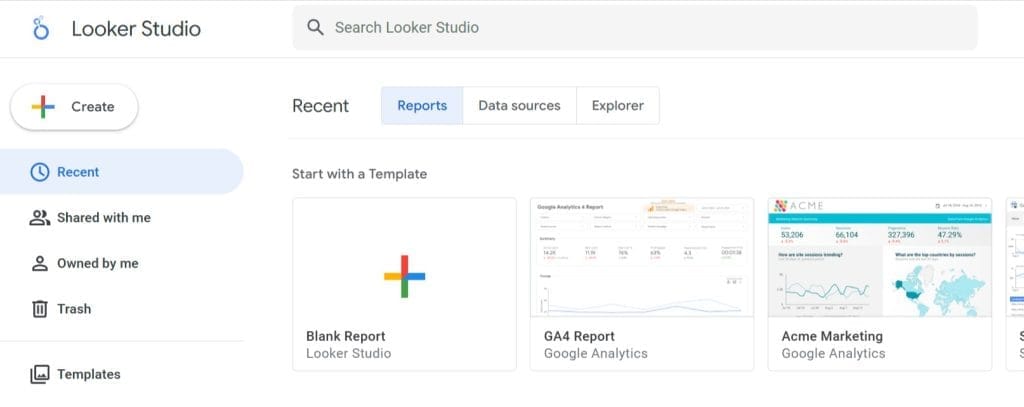
Then click on blank report—open Looker Studio
Set up your sources, start with Google Analytics:
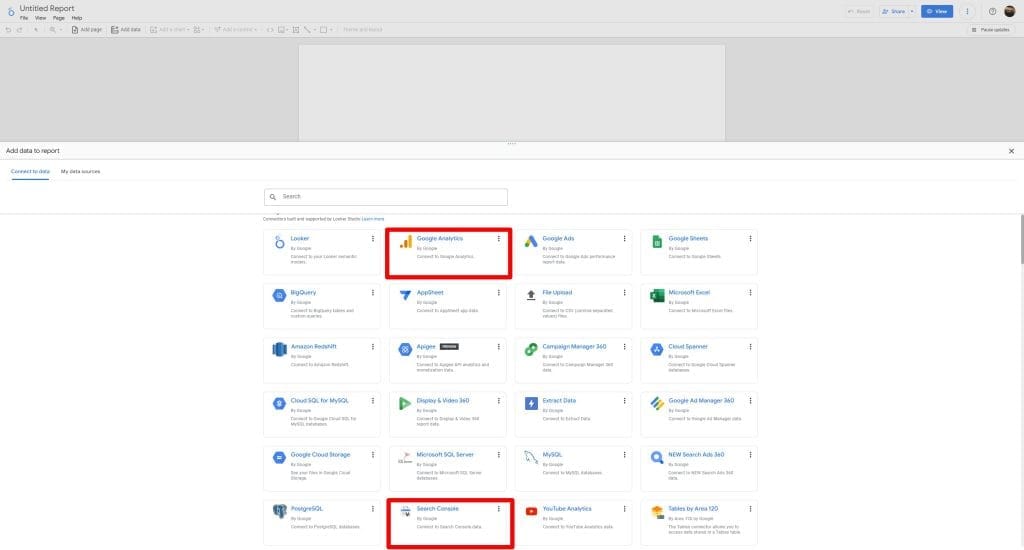
Hook Up GA4
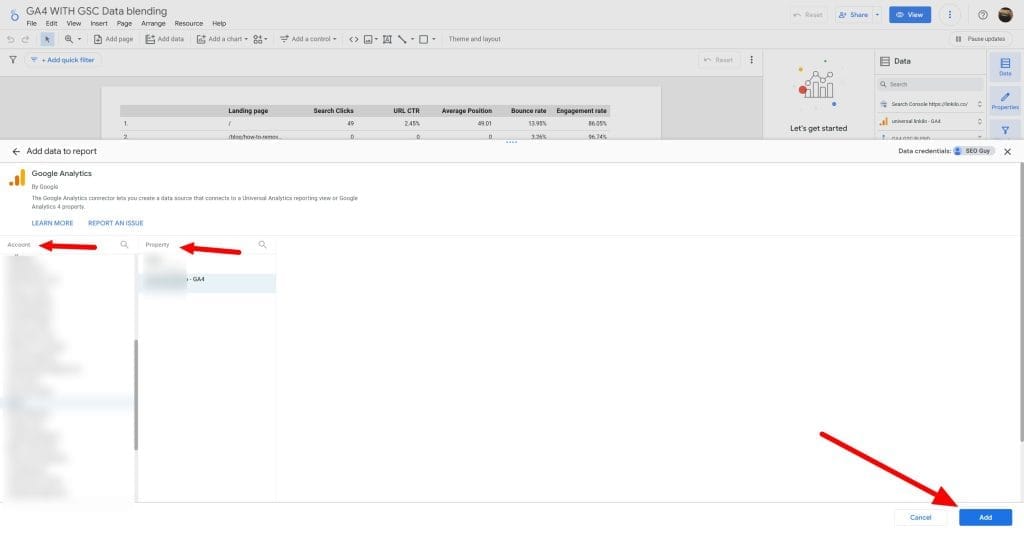
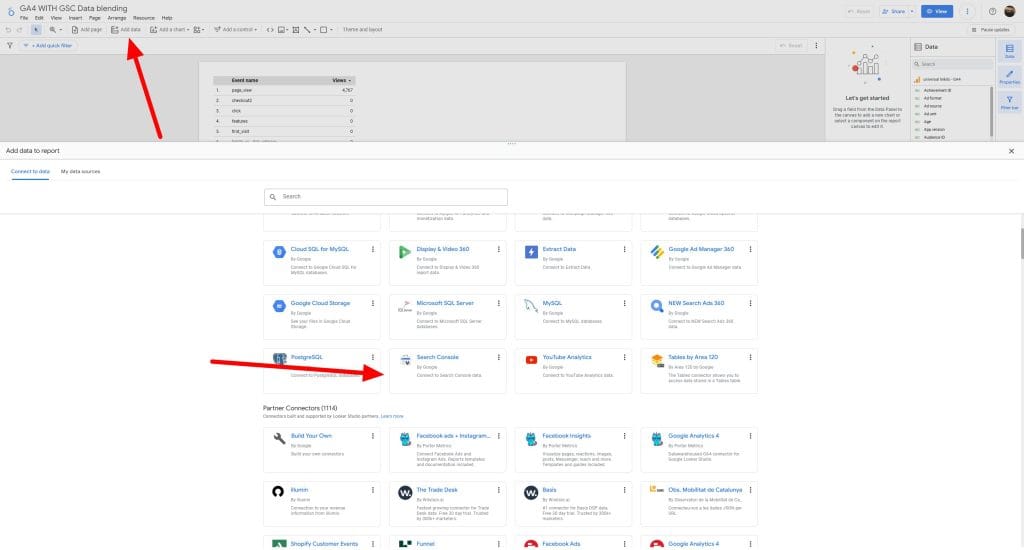
- Click “Google Analytics” in the connector list (It should be the first row)
- Click it, then pick your client’s GA4 property from the dropdown.
- Hit “Add” in the bottom right.
Click on Add Data and select Google Search Console
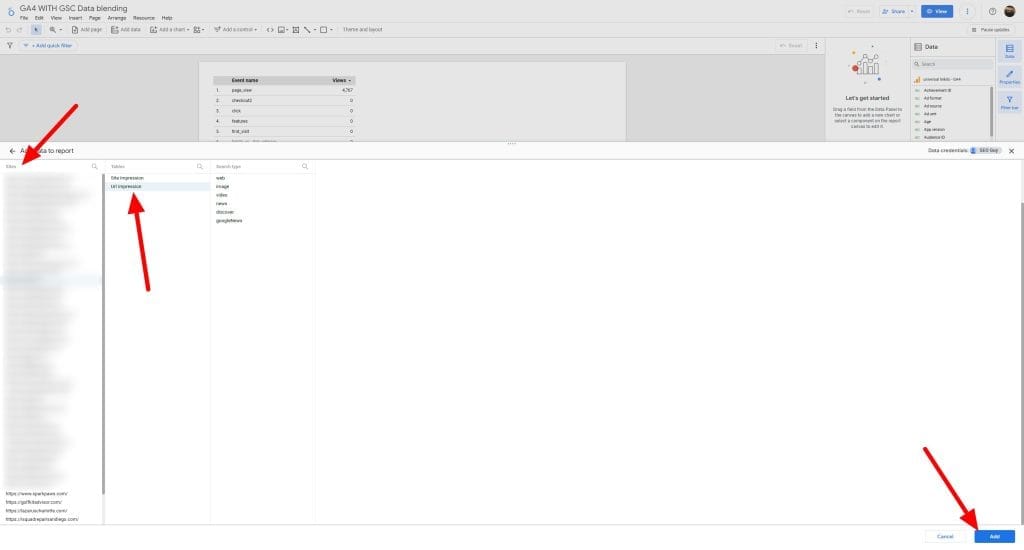
Select the managed GSC account/site, select Url Impression and click “Add“
2. Pull Off Data Blending in Looker Studio Step by Step
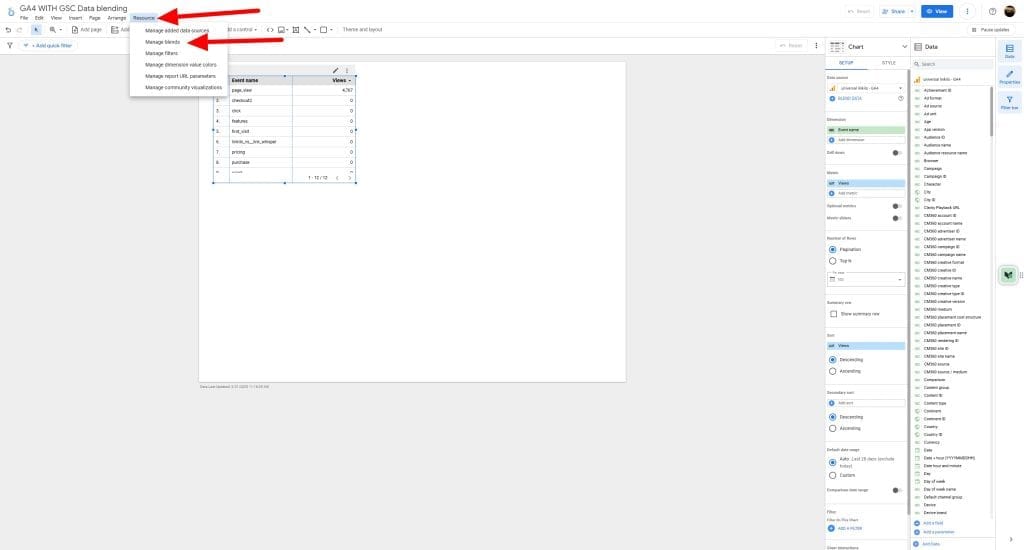
Start blending these by clicking on Resource>>Manage Blends
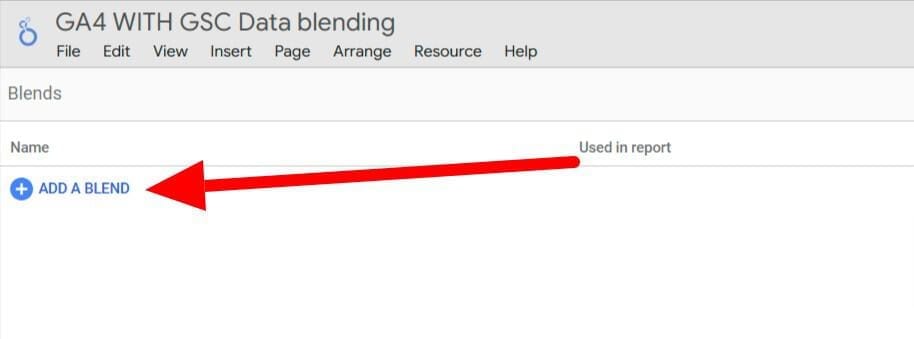
Click “ADD A BLEND“
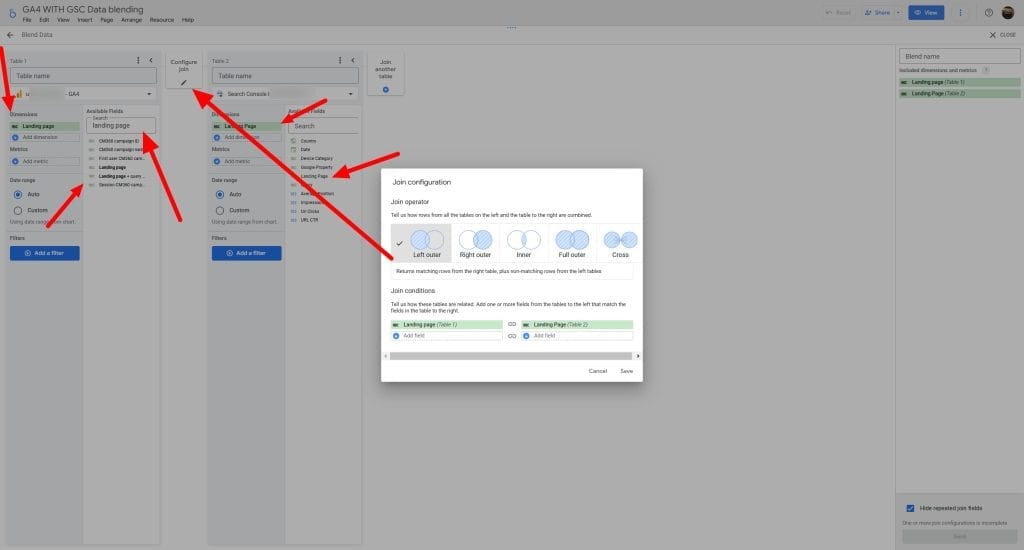
Configure the Blend:
- Data Source 1: Choose your GA4 data source.
- Join Key 1: This is how you’ll connect GA4 data. The best option is usually
Landing Page. (Make sure your GA4 reports are set up to capture landing page information correctly.)
- Join Key 1: This is how you’ll connect GA4 data. The best option is usually
- Data Source 2: Choose your GSC data source.
- Join Key 2: This needs to match the GA4 join key. Use
Landing Pagehere as well. Important Note: GSC’sLanding Pagedimension might include query parameters. If you want to blend based on the base URL, you might need to create a calculated field in GSC to extract the base URL - Join Type:
Left outer joinis generally recommended. This will include all landing pages from GA4 and match them with GSC data. If a landing page exists in GA4 but not GSC, the GSC metrics will show as null/zero. Other join types might exclude data you want to see.
- Join Key 2: This needs to match the GA4 join key. Use
When choosing a dimension, prefer GA4. Google Search Console (GSC) only shows indexed URLs, whereas GA4 collects all URLs, even those with UTM parameters or null/zero values. It’s better to capture everything, not just the URLs that are ranking
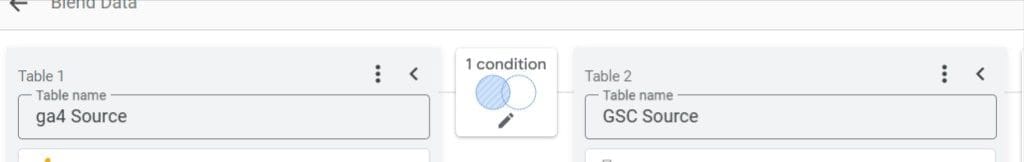
Name them—click each source’s title in the left panel, type “GA4 Source” and “GSC Source” to track them easy.
This setup works for GA4 and GSC, but it bends to anything. Hook Google Ads to GA4 with Campaign ID, or tie a CRM to User ID. Expect mismatched keys? Sort that out next. Want more than two sources? Stack another—click “Add a table,” pick Google Ads, set a join—but don’t overdo it, or things slow down. Test a pair first, check the results, then pile on.
3. Fix Join Key Problems for Smooth Data Blending in Looker Studio
First, we are going to add Landing Page dimensions for both GA4 and GSC sources. Then add all of the metrics you want to see on the table.
Google Analytics 4 landing page URLs do not include the domain (https://example.com/path), and Google Search Console does, so simply joining these two won’t work. We’ll need to use Regex to make them match.
We will clean up the GSC by removing the domain and only using the landing page path.
GSC Join Key Cleanup
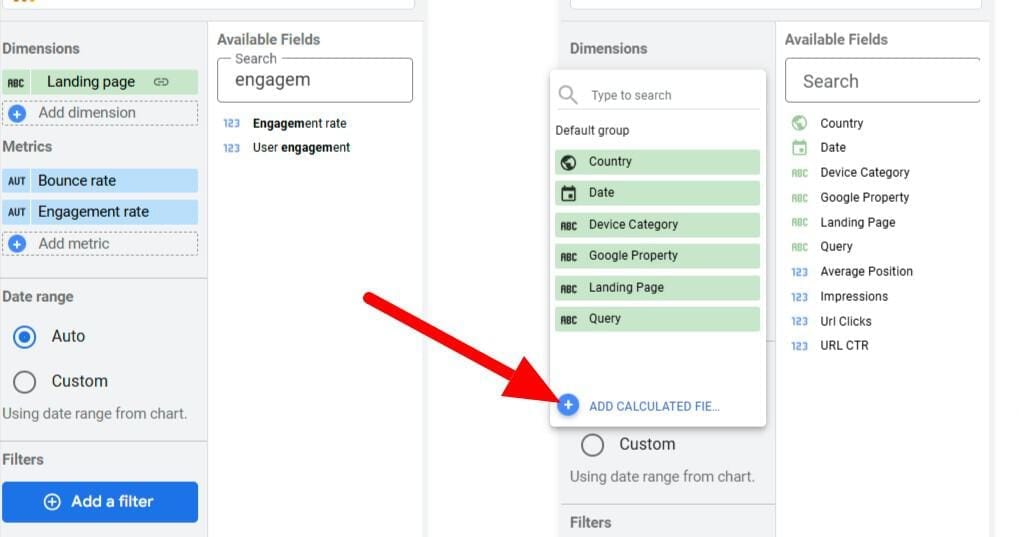
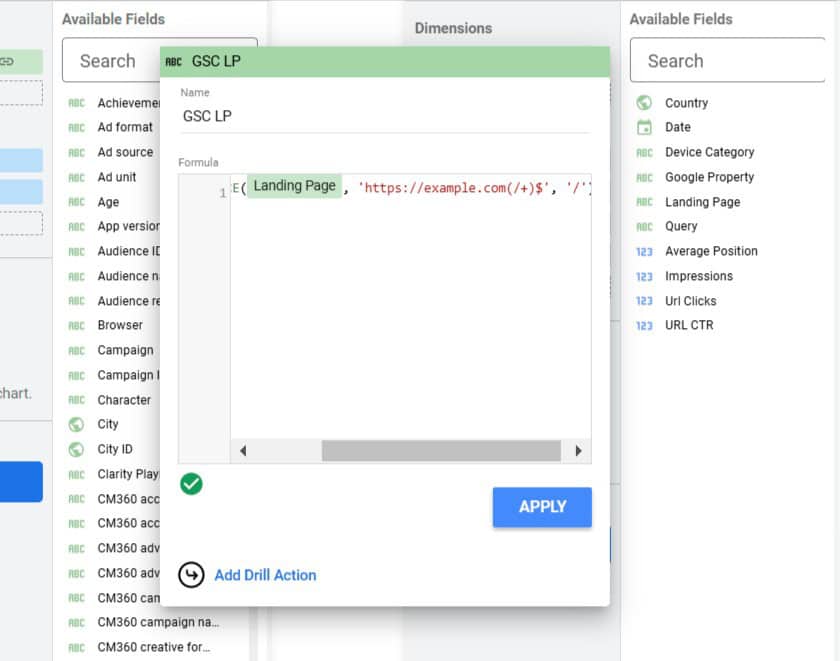
- Click “GSC Source” Landing Page
- Hit “Add Calculated Field” at the top.
- Name it—type
GSC LPin the top box. - Enter this formula:
REGEXP_REPLACE(Landing Page, 'https://example.com(/+)$', '/') - Click “Save.”
For those who don’t have trailing slash use this: REGEXP_REPLACE(Landing Page, 'https://example.com(/+)$', '')
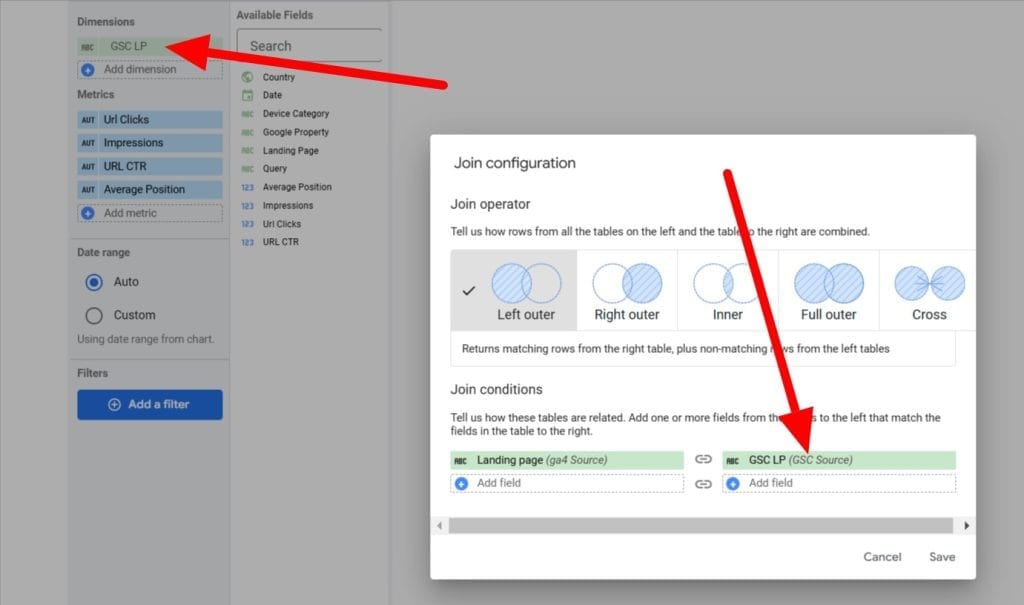
After that, you ca click on 1 condition, and you will notice that the right side is “Missing”:
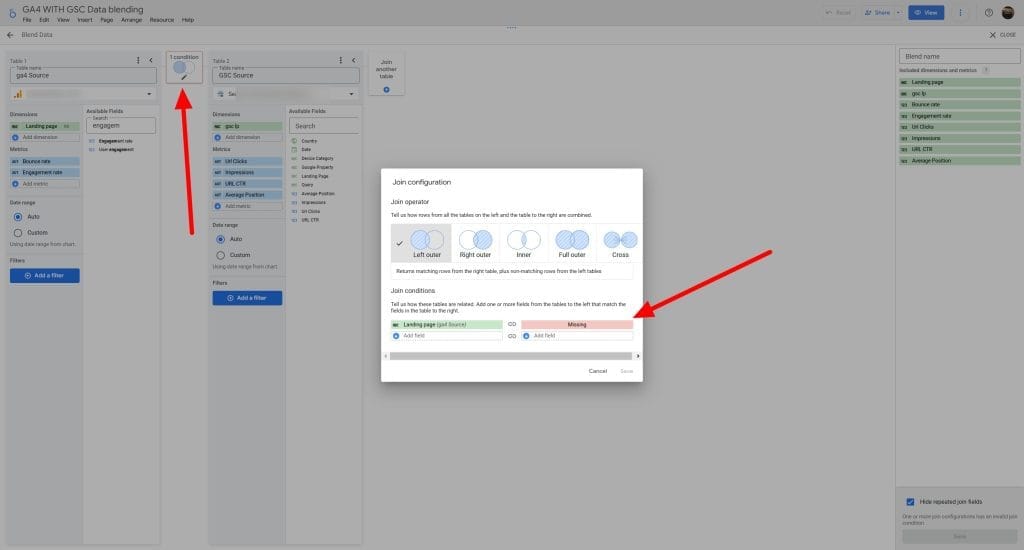
Since the Dimensions name has changed, you will need to click on the “Missing” section and select GSC LP:
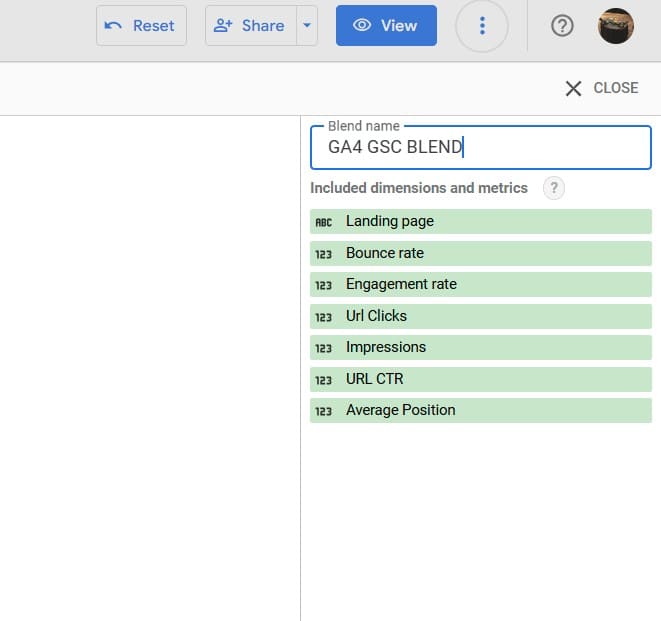
Name your Blend Name and click Save (located at the bottom right) then click X Close
Check it—fixes slashes, adds the domain if missing, syncs with GSC.
4. Pick Metrics and Dimensions for Your Blended Data
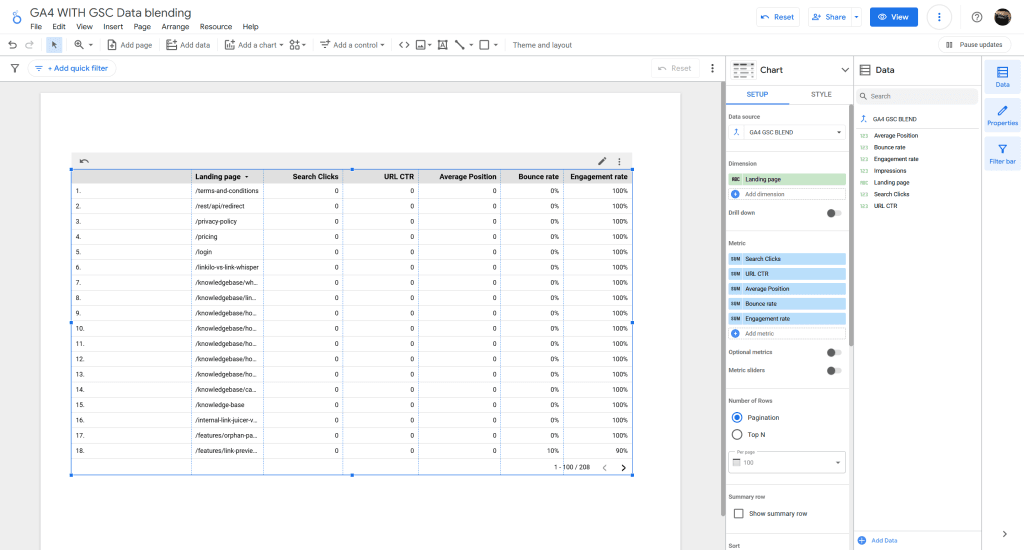
Click on the table and select the data source to GA4 GSC BLEND
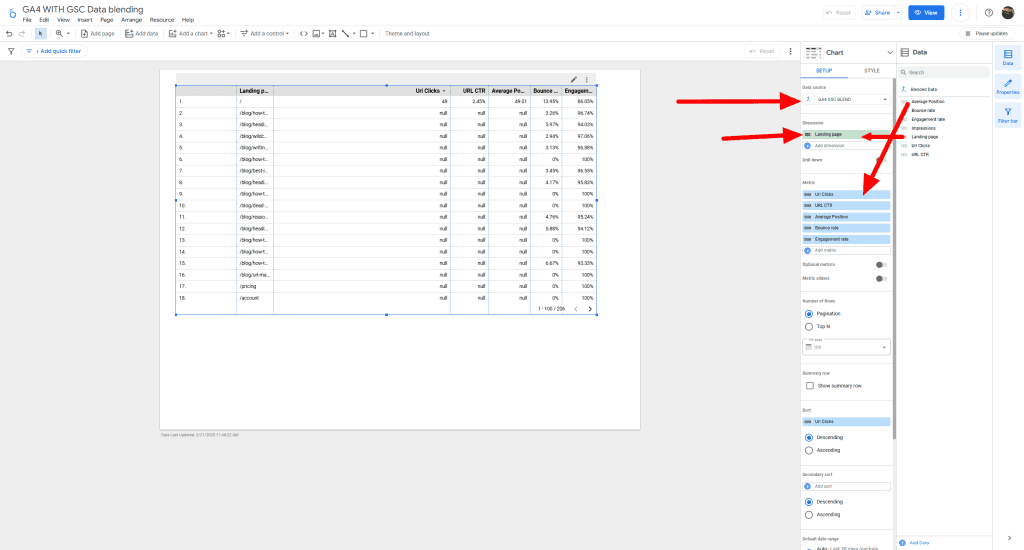
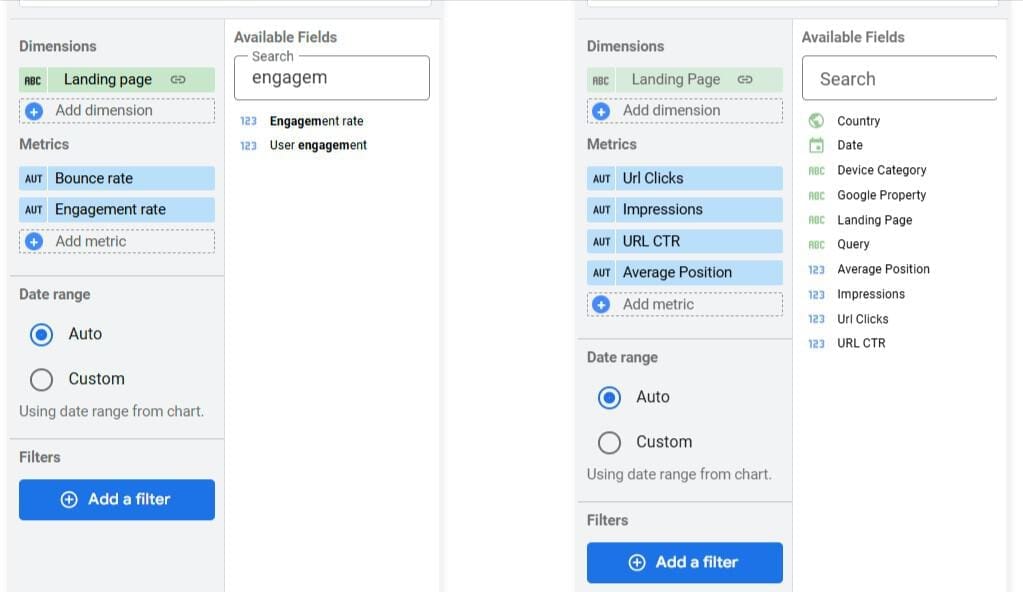
Scroll to “Metrics” under each source table.
- Pick GA4 metrics—click “Add a metric,” scroll to
Engagement Rate, click it, then addBounce Rate. - Pick GSC metrics—click “Add a metric,” scroll to
Clicks, click it, then addAverage Position. - Hit “Save.”
Stick with GA4 and GSC for now—Engagement Rateand Bounce Rate from GA4, Clicks, Impression, CTR, and Average Position from GSC. Switch it up for agency jobs—pair Google Ads Cost with GA4 Conversions, or CRM Revenue with Sessions.
Not sure what to grab? Zero in on what clients care about—traffic worth having, cash coming in, or how folks stick around. Pin dimensions like Landing Page or Campaign as the backbone, and keep metrics to 4-6 so it doesn’t turn into a jumble.
5. Show Off Blended Data in Looker Studio with Tables and Charts
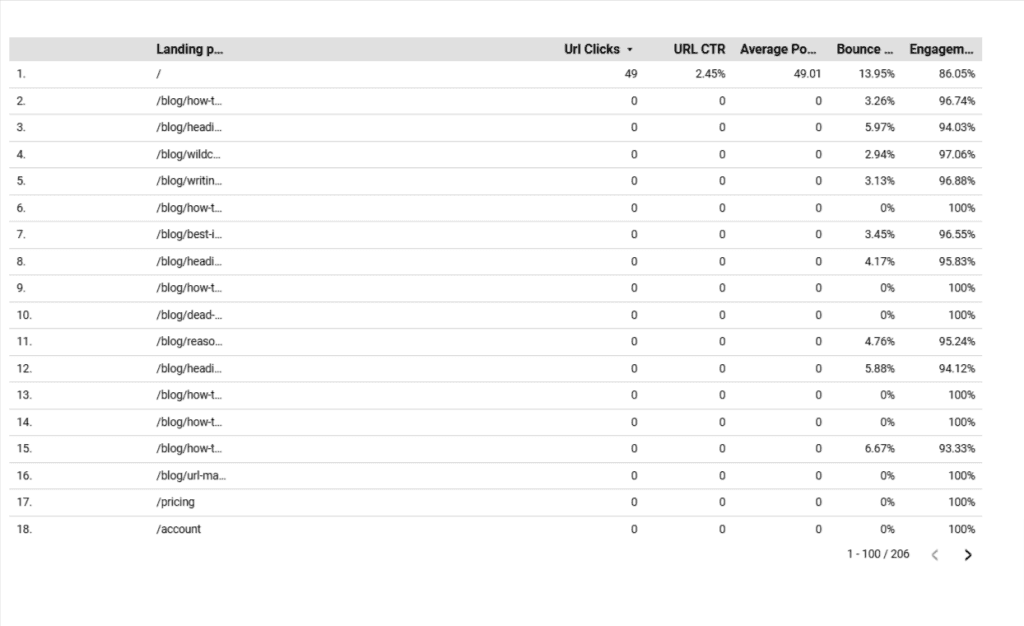
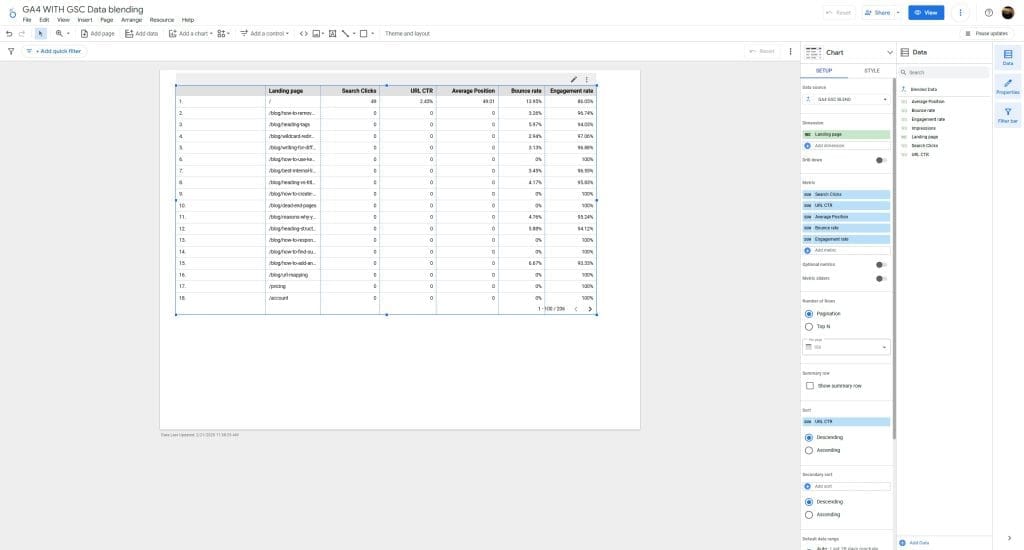
You now have a table with both GA4 and GSC, but you ight notice the null if you do not have data for that landing page.
To change or remove null, you can click on the table, go to Style and scroll down until you see Missing Data. You can select – or 0 or show blank
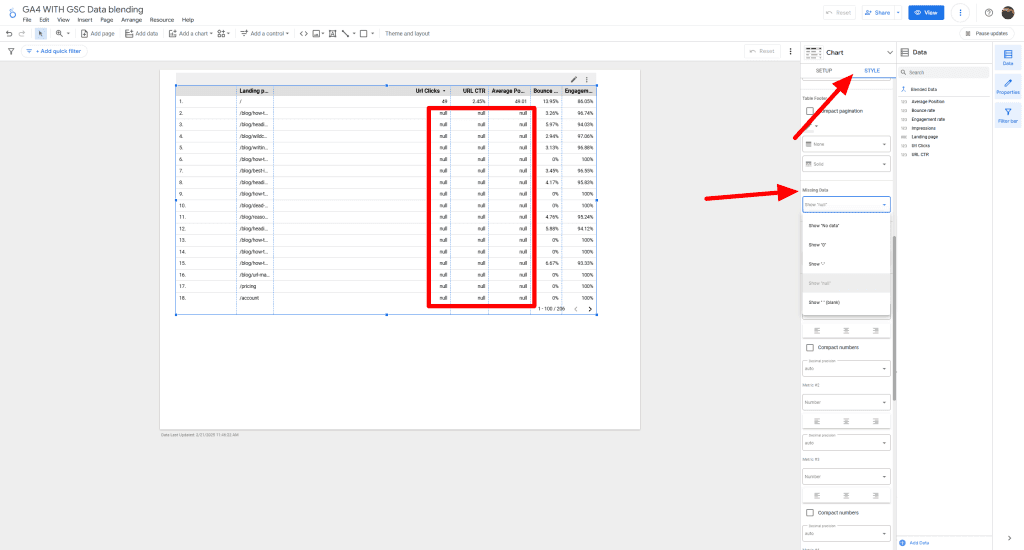
I’ve chosen to show 0:
Want clients to get it? Click Clicks in the metrics list, rename it “Search Clicks” in the “ADD Calculated” field. Maybe add a chart—click “Add a chart,” pick “Line Chart,” set it with the same source and metrics for trends.
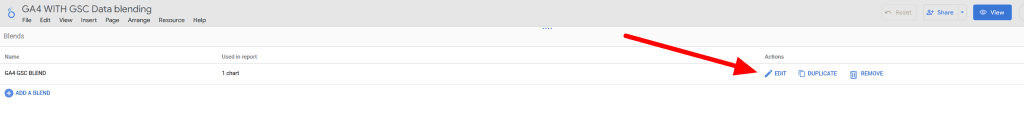
Go to Resource > Manage blend, click Edit:
Select Url Clicks, click on “Add Calculated Field”, Name it and in the Formula section, start typing Url and you can select the actual metrics and click save.
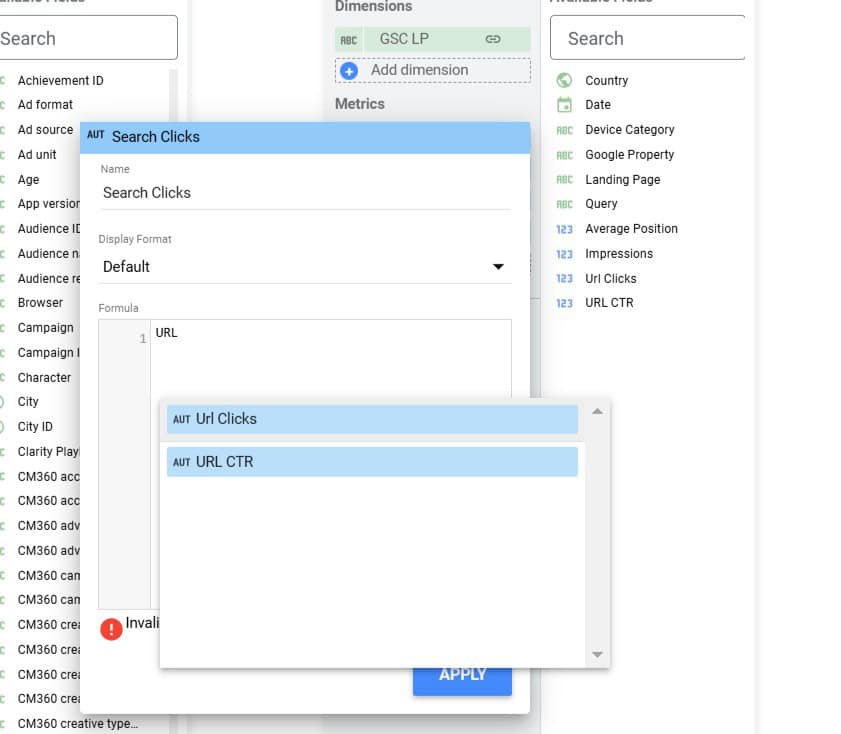
Now you can select Search Clicks as the metrics and you can rename all of the tables:
7. Tighten Up Blended Data with Filters and Sorting
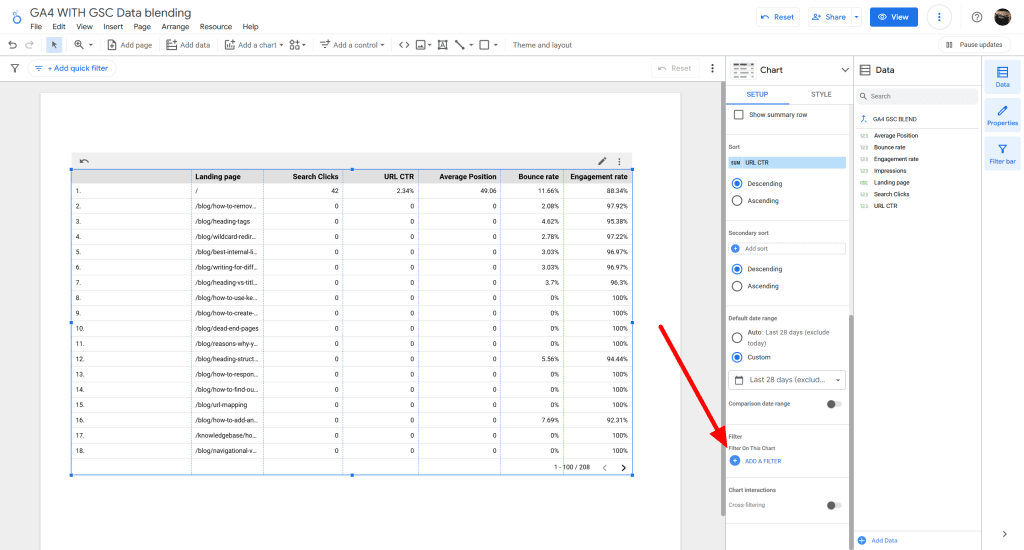
Select the Table: Make sure your table displaying the blended GA4 and GSC data is selected. You can see it’s selected in the screenshot below because the table has the blue outline and the right-hand properties panel is showing settings for “Chart” and “Data”.
Locate the “Default date range” Section:
- In the right-hand properties panel, look for the “Data” tab. It’s already selected in your screenshot.
- Scroll down within the “Data” tab until you find the section labeled “Default date range”. It’s located just above the “Filter” section.
Set the Date Range:
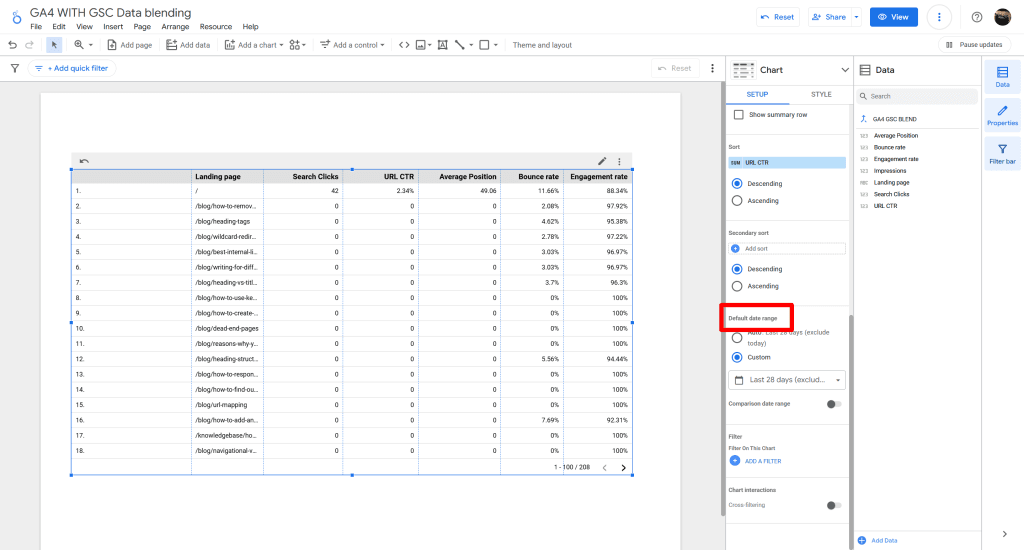
- Click on the date range selection. In your screenshot, it probably says “Auto date range”.
- A date range picker will appear.
- To use a quick date range: Click on “Custom” in the top right of the date range picker. Then you’ll see quick date range options like “Last 7 days,” “Last 30 days,” “This month,” etc. Select “Last 30 days” (or any other desired range).
- To set a custom date range: Click on the start and end dates in the calendar to select a specific date range.
- Click “Apply” in the bottom right corner of the date range picker.
Locate the “Filter” Section:
- In the right-hand properties panel, under the “Data” tab (which is already selected in your screenshot), scroll down until you find the “Filter” section. It’s located directly below the “Default date range” section.
Click “Add a filter”:
- In the “Filter” section, click the blue button that says “Add a filter”.
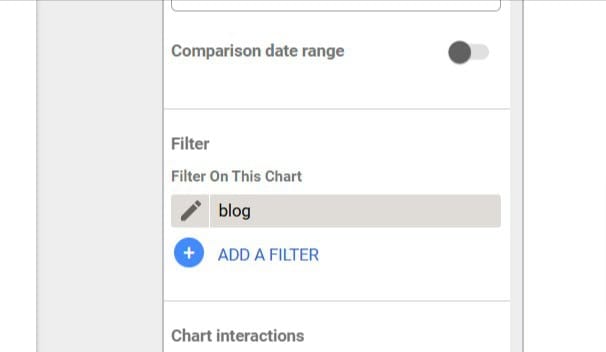
Create the Filter:
- A new filter creation panel will appear.
- Name your filter: In the top field, give your filter a descriptive name (e.g., “Product Pages,” “Specific Campaign,” etc.).
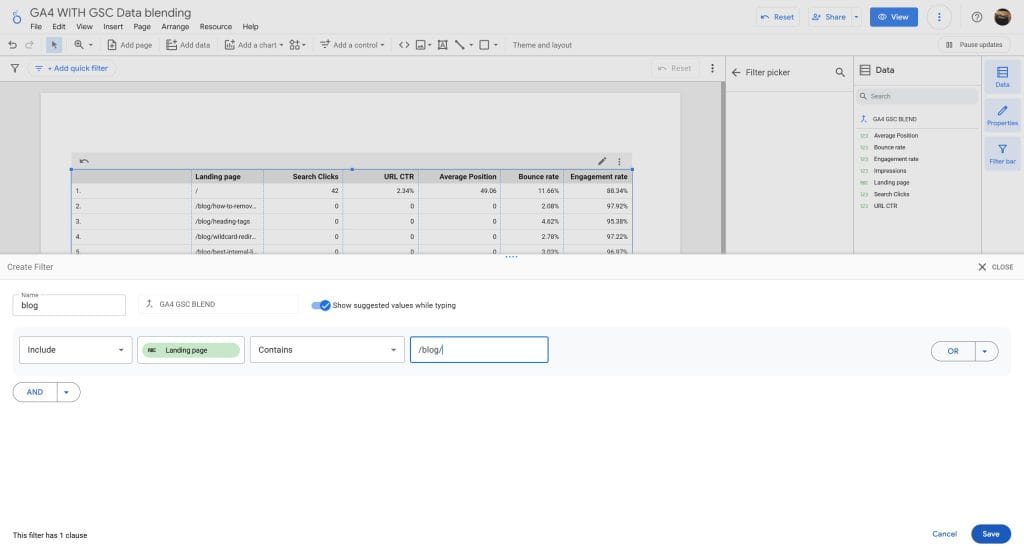
- Select the dimension: Click the “Select a field” dropdown and choose the dimension you want to filter by. In your case, you’ll likely want to use the cleaned landing page dimension you created (“GSC LP” or a similar name).
- Choose a condition: Select the condition you want to use (e.g., “Contains,” “Equals,” “Starts with,” etc.). For example, if you want to filter for product pages, you might use “Contains.”
- Enter the value: In the input field next to the condition, enter the value you want to filter by. For example, if you want to filter for product pages, you might enter
/product/. - Click “Save”: Click the blue “Save” button to save your filter.
Example Scenario (Blog or Product Pages):
Let’s say you want to filter your table to only show data for landing pages that contain “/product/”.
- You would click “Add a filter”.
- Name the filter “Product Pages”.
- Select the dimension “GSC LP” (or whatever you named your cleaned landing page field).
- Choose the condition “Contains”.
- Enter the value
/product/or /blog/ - Click “Save”.
8. Toss Interactivity into Looker Studio Reports
You can also add Advanced filter option to search for specific pages.
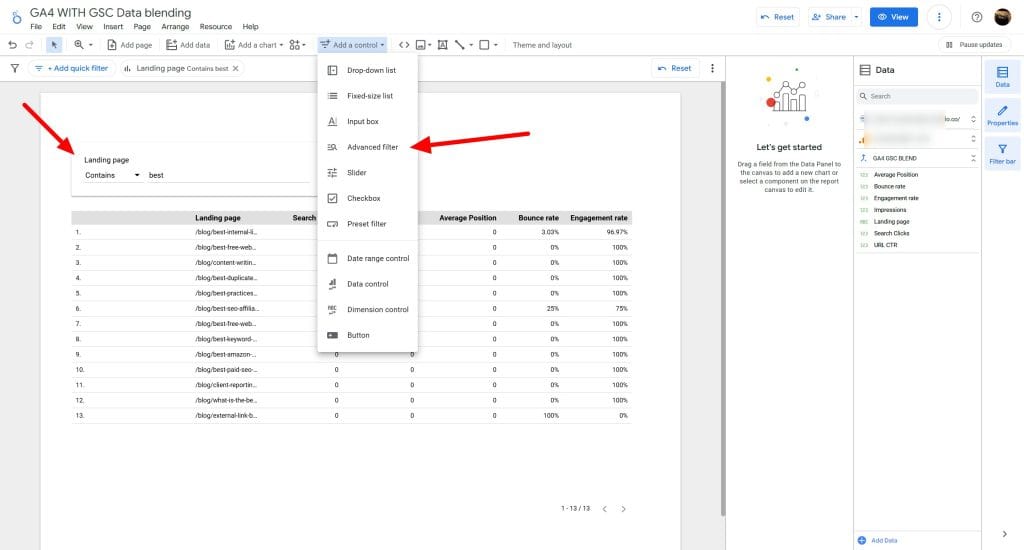
1. Add Control:
- Click “Advanced filter” in the toolbar.
- Place the input box on your report canvas where you want the search bar to appear.
Slow loading and other limitations of Looker Studio might restrict you from scaling.
You might have some of your clients Google Analytics and Google Search Console. In some cases, you might have multiple Google account for access. Or some are using trailing slash or not. Whether you are managing 5 clients to 20+ clients, it gets harder when you’re trying to scale your agency’s business. Think about how a client reporting platform can help. Read our article on Swydo vs Looker Studio for comparison or check out our other article on Looker Studio alternatives for more options.
Conclusion
You’ve got the whole rundown now—connect GA4 and GSC, sort out those join keys, add filters, and hand clients numbers that click. Agencies need this: one report to axe the mess and show your work pays off. Give it a spin, bend it for your trickiest clients, and see it pull through on crazy deadlines. Kick off with GA4 and GSC, then toss in whatever data they dump on you. Go build it.
Blend your data easily with Swydo’s seamless integration.
Start Free Trial