
Marketing agencies swim in data yet struggle to extract real value from it. Clients demand concrete results, not fancy dashboards. Teams collect numbers without translating them into effective strategies. Many claim “data-driven” status while few demonstrate what this means for actual business outcomes.
The marketing landscape overwhelms agencies with data—website analytics, social media metrics, CRM information, campaign results. This abundance makes gut feelings insufficient, as data collection differs vastly from data understanding.
Two fundamental statistical approaches can transform how agencies deliver value: descriptive and inferential statistics. These practical frameworks improve pitch success, client retention, and profit margins.
Essential Statistical Foundations for Agency Success
Marketing agencies face intense pressure to deliver measurable results. Clients demand creative campaigns that drive business outcomes. Statistical knowledge proves essential for demonstrating value and justifying fees. Two main approaches require your focus.
Descriptive Statistics
Analyzing What Has Happened
Purpose
Summarize and organize collected data
Key Questions
- What happened in our campaigns?
- How did users behave on our site?
- Who engaged with our content?
Common Techniques
- Central tendency measures
- Variability measures
- Frequency distributions
Marketing Applications
- Campaign performance reports
- Audience demographic analysis
- Content engagement metrics
Inferential Statistics
Predicting What Will Happen
Purpose
Draw conclusions and make predictions
Key Questions
- Will this new approach work better?
- What will happen if we increase spend?
- Which customers are likely to convert?
Common Techniques
- Hypothesis testing
- Regression analysis
- Confidence intervals
Marketing Applications
- A/B testing optimization
- Budget allocation modeling
- Conversion predictive scoring
Agencies that master both approaches deliver superior client results through evidence-based strategies and accurate performance predictions.
Extracting Value From Your Existing Data
Descriptive statistics summarizes past events. This process organizes collected data into meaningful patterns. Agency owners extract immediate insights from existing data through this approach. Often, this involves data blending from various marketing platforms to get a unified view before applying statistical measures.
Several key measures provide different perspectives:
Measures of central tendency—means, medians, and modes—identify typical values. Average customer spend calculations represent means. Most common purchase identification reveals modes. Median age of website visitors creates a balanced picture of typical visitors, particularly with outliers present.
Measures of variability—standard deviation, variance, and range—show data spread. High standard deviation in campaign performance indicates inconsistency or risk, revealing valuable information about volatility.
Frequency distributions illustrate how often different outcomes occur, presented through visual formats for easier understanding.
Two campaigns with identical average performance often feel different because of these variability measures.
Practical Marketing Applications for Descriptive Statistics
| Statistical Measure | What It Tells You | Marketing Application | Example |
|---|---|---|---|
| Mean | Average value | Typical customer behavior | Average order value: $75 |
| Median | Middle value (less affected by outliers) | True center of data when extremes exist | Median time on site: 2:45 minutes |
| Mode | Most common value | Most popular choices | Most frequently purchased product |
| Standard Deviation | How spread out data is | Consistency of performance | Email open rate consistency across campaigns |
| Range | Difference between highest and lowest values | Span of behavior or performance | Customer age range: 24-65 years |
| Frequency Distribution | How often different values occur | Pattern identification | Distribution of social engagement by time of day |
What’s your objective?
Summarize existing data
Make predictions
Descriptive Methods
- Mean/Median/Mode: When you need measures of central tendency
- Standard Deviation: When measuring consistency is important
- Frequency Distribution: When patterns in categories matter
- Percentiles: When comparing relative standings
Inferential Methods
- A/B Testing: When comparing two variations
- Regression Analysis: When modeling relationships
- Cluster Analysis: When identifying natural segments
- Time Series Forecasting: When predicting future trends
Most agencies stop at reporting these numbers without explaining business implications. This creates a major opportunity for differentiation.
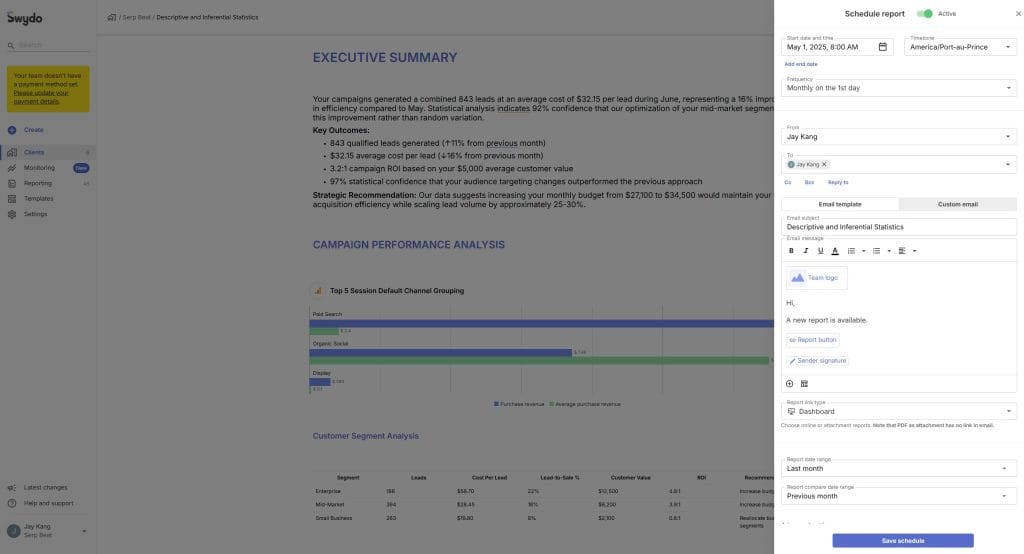
To illustrate how these statistical approaches translate into practical client deliverables, consider this comparison of a PPC campaign report using descriptive versus inferential statistics:
Descriptive Statistics Approach
What happened in the campaign
Campaign Performance Summary
Key Observations
- Highest performing ad group: “Product Features” (4.2% CTR)
- Best performing keyword: “industry solution” ($32.15 CPA)
- Worst performing ad: Version C (1.1% CTR)
- Peak performance time: Tuesdays, 2-5pm
- Device breakdown: Desktop 65%, Mobile 30%, Tablet 5%
Limitations
Shows what happened but doesn’t explain why or predict future performance. Cannot confirm if observed differences are statistically meaningful.
Inferential Statistics Approach
What it means and what will happen
Statistical Analysis
Strategic Insights
- Ad headline variation A shows statistically significant improvement (p=0.03)
- Weekday performance differences are not statistically significant (p=0.24)
- 95% confidence that increasing budget by 20% will yield 15-25% more conversions
- Regression model predicts 12% CPA improvement with new bidding strategy
- Mobile conversion rate underperformance is statistically significant (p=0.01)
Data-Driven Recommendations
Reallocate 25% of budget from lowest performing keywords to top performers for projected 18% ROI improvement at 90% confidence level.
While descriptive statistics tell you what happened in your campaigns, inferential statistics help you understand why and predict what will happen next with defined confidence levels.
Notice how the descriptive approach provides valuable performance data, but the inferential approach transforms that data into strategic insights with confidence levels and predictive elements. This difference illustrates why agencies need both approaches to deliver comprehensive value to clients.
While understanding these differences is valuable, the most effective client reporting integrates both approaches in a business-friendly format.
Here’s an example of how to present key PPC metrics with both descriptive context and inferential insights in an executive-friendly report:
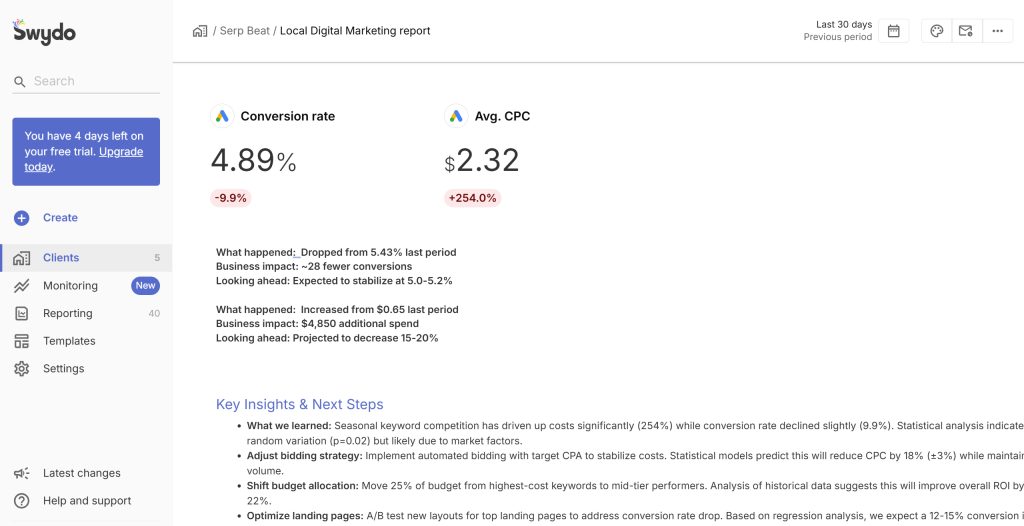
This integrated approach combines statistical rigor with business relevance by:
- Show what happened (descriptive statistics)
- Explain why it matters (business impact)
- Predict what will happen next (inferential statistics)
- Recommend specific actions with supporting evidence
Most clients don’t need to understand the statistical methods behind your recommendations—they need to understand the business implications and feel confident in your data-backed approach.
Many agencies stop at surface-level reporting—a critical mistake.
Three common issues emerge:
Numbers without context leave clients questioning meaning. Using inappropriate measures (means instead of medians) creates flawed recommendations. Poor visualization choices generate confusion rather than clarity.
Implement a three-layer reporting approach: core metrics with appropriate measures, variance indicators showing data spread, and contextual benchmarks against industry standards and historical performance. This approach elevates reporting from “here are numbers” to “these numbers mean this for your business”—clients pay premium rates for this insight.
As demonstrated in the example above, this integrated approach combines statistical rigor with business relevance by showing what happened, explaining why it matters, predicting what will happen next, and recommending specific actions with supporting evidence.
Make Accurate Predictions From Limited Sample Data
Clients care about the future, and inferential statistics provides a powerful tool by drawing conclusions about larger populations based on smaller samples. In this process, agencies use sample statistics to estimate broader population parameters, allowing for more informed predictions and strategic recommendations.
Inferential statistics becomes a powerful strategic tool in these moments.
Inferential statistics draws meaningful conclusions about larger populations based on smaller samples. Agency owners move from reporting past events to predicting future outcomes and recommending next actions. Clients pay premium rates for this predictive capability.
Several key concepts create inferential statistics power:
Sampling selects representative subsets from larger groups. Valid inferences require accurate reflection of entire group characteristics.
Hypothesis testing evaluates claims using sample data. This determines whether new campaigns significantly increased sales compared to previous efforts.
Confidence intervals provide ranges where true results likely fall, with specified confidence levels. This improves reliability understanding for consumer behavior estimates.
Regression analysis examines variable relationships, revealing how changes in factors like ad spend influence outcomes like sales.
A/B testing compares performance variations through random group assignments, determining whether observed differences show statistical significance or random noise.
Powerful Statistical Methods That Drive Client Results
| Statistical Method | What It Does | Marketing Application | Value to Clients |
|---|---|---|---|
| Hypothesis Testing | Determines if observed differences are statistically significant | A/B testing landing pages | Confirms with confidence that changes actually improve results |
| Confidence Intervals | Provides range of likely values for a parameter | Estimating campaign ROI | Shows realistic range of expected outcomes |
| Regression Analysis | Models relationships between variables | Forecasting sales based on marketing inputs | Predicts outcomes of different spending levels |
| Cluster Analysis | Identifies natural groupings in data | Customer segmentation | Creates more targeted marketing approaches |
| Time Series Analysis | Analyzes data points ordered by time | Seasonal trend forecasting | Predicts future performance based on historical patterns |
For agencies new to inferential statistics, start with tools like Optimizely for A/B testing, R for statistical analysis (via RStudio), or Python with libraries like Pandas and Scikit-learn for more advanced modeling. These provide accessible entry points that scale with expertise.
Inferential statistics provides agencies with:
- Risk reduction in client strategies through success probability quantification
- Resource allocation optimization toward channels with statistically significant ROI
- Client retention strengthening through actual impact demonstration
- Premium pricing power based on predictable results, not services
Implement this four-step process for inferential statistics leverage:
- Convert client objectives into testable marketing hypotheses
- Design experiments generating statistically significant findings
- Present strategy options with quantified success probability
- Use ongoing analysis to refine approaches based on incoming data
This process transforms client conversations from “This might work” to “We maintain 90% confidence this approach will deliver these specific results”—a compelling proposition against competitors.
| Feature | Descriptive Statistics | Inferential Statistics |
|---|---|---|
| Primary Question | “What happened?” | “What will happen?” |
| Data Focus | Analyzing complete datasets | Drawing conclusions from samples |
| Time Orientation | Past-focused | Future-focused |
| Key Metrics | Mean, median, mode, standard deviation | p-values, confidence intervals, regression coefficients |
| Marketing Tools | Analytics dashboards, performance reports | A/B testing platforms, predictive models |
| Client Value | Understanding current performance | Making data-driven predictions |
| Common Mistakes | Misinterpreting outliers, ignoring context | Inadequate sample size, overgeneralizing findings |
| Note: Both statistical approaches are essential for maximum client value. | ||
With a clear understanding of these differences, let’s examine the common pitfalls agencies encounter when implementing statistical approaches and how to avoid them.
While descriptive statistics show what happened, inferential statistics allows agencies to explore why and predict future outcomes. This often involves moving beyond simple correlations to consider causal analysis, helping to determine the true impact of specific marketing interventions.*
Common Data Mistakes That Cost Agencies Clients
Today, we experiences a troubling disconnect. Data availability exploded while analysis quality failed to match pace. Many agencies claim data-driven approaches but merely decorate with data, using numbers as window dressing rather than strategy drivers. This is particularly evident in areas like PPC tracking, where surface-level reporting often overshadows deeper statistical insights. This practice wastes budgets, leaves potential unrealized, and strains client relationships.
Descriptive Data Analysis Errors to Avoid
Descriptive statistics mistakes include:
Averages misinterpretation from outliers: Extreme values significantly skew means. Customer spending analysis containing a few massive purchases inflates average spend, misrepresenting typical customer behavior.
Data distribution ignorance: Examining only means and standard deviations without considering distribution shapes misses important patterns.
Correlation-causation confusion: Metrics moving together doesn’t indicate causation. Social media engagement increases might coincide with sales growth, yet both might result from external factors like seasonal promotions.
Quick Solutions to Common Data Analysis Problems
| Pitfall | Real-World Example | Impact on Client | Better Approach |
|---|---|---|---|
| Misusing Averages | Reporting mean purchase value when large orders skew data | Misleading perception of typical customer | Use median for skewed data; report both with explanation |
| Cherry-Picking Metrics | Highlighting CTR but hiding conversion rate | Incomplete campaign effectiveness picture | Create balanced scorecards with related metrics |
| Ignoring Context | Reporting 5% conversion rate without industry benchmarks | Unclear performance quality | Include relevant benchmarks and historical trends |
| Misleading Visualizations | Using truncated y-axis to exaggerate small differences | Artificial perception of significant improvement | Start y-axis at zero; use annotations for context |
Consider this example: An agency reported a “200% increase in engagement” for a client’s Instagram campaign. This sounded impressive until revealed that engagement went from 0.5% to 1.5%, still below industry average of 2.7%. The client felt misled when competitors showed better results despite supposedly lower percentage improvements.
Many agencies build reporting dashboards around impressive-looking vanity metrics disconnected from business outcomes. This creates success illusions while actual client objectives remain unmet, causing client loss.
Develop a three-tier metrics framework:
- Activity metrics: Agency actions (campaigns launched, content published)
- Performance metrics: Activity performance (engagement, clicks, conversions)
- Outcome metrics: Business impact (revenue, market share, customer lifetime value)
Connect reporting to the third tier, even when primarily sharing data from the first two tiers.
Statistical Prediction Errors That Destroy Client Trust
Inferential statistics contains potential errors:
Drawing conclusions from small or unrepresentative samples: Surveying only existing loyal customers distorts broader market understanding.
Statistical significance misunderstanding: Statistically significant results don’t automatically indicate practical significance or large effect size. Results simply suggest improbability of random chance occurrence.
Finding overgeneralization: Applying conclusions from specific studies to broader populations without considering differences creates faulty assumptions.
Confirmation bias: Interpreting results to confirm existing beliefs while ignoring contradictory evidence.
How to Fix Statistical Analysis Problems Before They Cost You
| Error | Real-World Example | Business Consequence | Correction Strategy |
|---|---|---|---|
| Inadequate Sample Size | Running A/B test with only 50 visitors per variant | Unreliable conclusions causing poor decisions | Calculate required sample size before testing |
| Confirmation Bias | Interpreting ambiguous data to support preferred strategies | Reinforcing ineffective approaches | Multiple team members independently analyze results |
| P-Hacking | Running multiple tests until finding a “significant” result | False positives wasting resources | Pre-register hypotheses and planned analyses |
| Overgeneralization | Applying findings from one demographic to all customers | Campaign failure with different audiences | Test explicitly with each target audience |
For A/B testing, use this formula to determine minimum sample size needed: n = 16σ²/d², where σ² is the variance and d is the minimum effect size you want to detect. Alternatively, use online calculators from Optimizely or VWO that calculate this automatically based on your inputs.
Many agencies make absolute claims based on statistically questionable evidence, creating expectations they cannot meet. Results failure rapidly erodes trust.
Implement these analytical process guardrails:
- Verify sample size and representation before drawing conclusions
- Report practical significance alongside statistical significance
- Communicate probability ranges rather than absolute predictions
- State conditions clearly where predictions remain valid
This approach builds client trust through intellectual honesty while providing actionable guidance.
The Complete Framework to Integrate Statistical Methods
The distinction between descriptive and inferential statistics carries practical implications for agency analytical structure. Sophisticated agencies treat these as complementary tools within unified frameworks rather than separate disciplines. Understanding integration methods improves insight-driven strategy delivery capacity.
Descriptive and inferential statistics work together for comprehensive marketing data understanding. Descriptive statistics provides groundwork through sample characteristic summarization, informing inferential technique selection and hypothesis formation.
A Step-by-Step Statistical Process for Marketing Success
| Stage | Descriptive Role | Inferential Role | Agency Deliverable |
|---|---|---|---|
| Discovery | Summarize current performance | N/A | Initial performance assessment |
| Strategy | Identify patterns and anomalies | Form hypotheses about causes | Strategic recommendations |
| Execution | Monitor real-time metrics | N/A | Campaign tracking dashboards |
| Optimization | Compare results to benchmarks | Test significance of variations | Optimization recommendations |
| Reporting | Summarize campaign outcomes | Predict future performance | Client performance reports |
| Planning | Provide historical context | Model scenarios for future campaigns | Strategic planning roadmap |
Process Implementation Example: For a new client, begin with a comprehensive audit using descriptive statistics to establish baselines across all channels. Identify the highest-impact opportunities based on conversion gaps and audience behavior patterns. Form hypotheses about what might improve performance. Test these hypotheses through controlled experimentation, measuring statistical significance of results. Scale successful approaches while refining your understanding of causality.
Effective agencies build cyclical workflows that use both approaches:
- Start with descriptive statistics to understand current situations
- Form hypotheses based on observations
- Test hypotheses using inferential methods
- Implement changes based on statistical significance
- Measure results with descriptive statistics
- Repeat cycles with continuous improvement
Multi-channel attribution presents a practical example where agencies struggle.
Traditional approaches use last-click attribution (descriptive statistics only), allocating 100% conversion value to final touchpoints. This misses awareness and consideration channel contributions, leading to budget misallocation.
An improved integrated approach:
- Map full customer journeys across touchpoints using descriptive statistics
- Develop attribution hypotheses based on observed patterns
- Apply inferential techniques like Markov chain modeling to test hypotheses
- Determine statistically valid attribution weightings across channels
- Implement optimized budget allocation based on findings
- Monitor performance using descriptive measures
- Refine attribution models as new data emerges
This integrated approach transforms common agency challenges into strategic advantages directly impacting client ROI.
12-Month Action Plan to Transform Your Agency
Theory provides value, but implementation creates results. Translate statistical concepts into concrete action plans working for specific agency circumstances, capabilities, and client rosters. This phased approach builds statistical competence progressively without disrupting current operations.
- Team skills assessment
- Data collection audit
- Reporting template development
- Client education materials
- Statistical validation checkpoints
- Peer review systems
- Enhanced client reporting
- Statistical pricing tiers
- Proprietary statistical frameworks
- Specialized technique development
- Statistical positioning in market
- Advanced client case studies
Months 1-3: Create Your Statistical Foundation
Assess team statistical skills and develop targeted training addressing gaps. Create standardized statistical glossaries and methodologies specific to service offerings.
Audit existing data collection procedures for statistical validity and implement quality control processes ensuring clean, reliable data. Develop standardized templates incorporating descriptive statistics in client reporting.
Client education matters. Create materials explaining statistical approaches in client-friendly language and establish KPIs blending descriptive and inferential insights.
Phase 1 Action Steps with Expected Outcomes
| Area | Action Items | Expected Outcome | Resource Investment |
|---|---|---|---|
| Team Development | • Skills assessment<br>• Training program development<br>• Statistical procedure documentation | Improved team confidence in data handling | Medium (primarily time) |
| Data Infrastructure | • Data collection audit<br>• Quality control implementation<br>• Reporting template development | More reliable data for analysis | Medium-High (systems and time) |
| Client Relations | • Educational materials creation<br>• Expectations alignment<br>• Performance framework establishment | Improved client understanding of metrics | Low-Medium (primarily time) |
Implementation Priority: Start with standardizing reporting templates. This offers immediate client value while building infrastructure for more advanced statistical approaches. Create templates showing key metrics with proper context and appropriate statistical measures to avoid common mistakes.
Months 4-6: Integrate Statistical Methods Into Daily Operations
Redesign deliverables incorporating statistically valid insights and recommendations. Develop pricing tiers based on statistical depth and predictive capability. Create case studies demonstrating ROI impact from statistical approaches.
Implement statistical validation checkpoints in campaign development processes and establish peer review systems for inferential analyses and predictions.
Redesign reporting dashboards balancing descriptive clarity and inferential depth for client relationships. Develop conversation frameworks explaining statistical concepts to clients without condescension.
Team Capability Building: Identify one team member who shows statistical aptitude to become your “statistical champion.” Invest in their advanced training while they develop simplified internal training for colleagues. This creates a multiplier effect across your organization.
Months 7-12: Establish Your Statistical Market Differentiation
Create educational content showcasing statistical expertise and develop proprietary statistical frameworks aligned with agency specialization. Share case studies demonstrating business impact achieved through statistical rigor.
Explore specialized statistical techniques relevant to client industries and develop predictive modeling capabilities for core client performance indicators.
Adjust market positioning emphasizing statistical validity as core differentiation and develop sales materials highlighting business impact from statistical rigor.
Market Positioning Strategy: Position your agency’s statistical approach as “Evidence-Based Marketing” – a term that resonates with clients seeking proven results. Create comparison materials showing how statistical rigor translates to better ROI compared to conventional approaches.
12 Key Metrics to Track Statistical Success
What indicates statistical evolution success? Which metrics track statistical capability investment returns?
This framework provides clear indicators across client relationships, internal operations, and overall business performance.
Track these key indicators for success measurement:
Comprehensive Statistical Measurement Framework
| Category | Metric | Baseline Measurement | Target Improvement | Measurement Method |
|---|---|---|---|---|
| Client Impact | ||||
| Retention Rate | Current annual retention % | +15% year-over-year | Client contract tracking | |
| Average Contract Value | Current ACV | +20% for statistically-driven services | Financial reporting | |
| Net Promoter Score | Current NPS | +10 points | Client surveys | |
| Referral Sources | % of referrals by type | 30% increase in reputation-based referrals | New client intake tracking | |
| Internal Performance | ||||
| Statistical Error Rate | Baseline error assessment | 50% reduction in 6 months | Internal review process | |
| Prediction Accuracy | Initial accuracy assessment | 25% improvement in 12 months | Prediction vs. actual tracking | |
| Resource Optimization | Current allocation efficiency | 15% improvement in ROI | Campaign performance analysis | |
| Team Confidence | Initial confidence survey | 40% increase in confidence scores | Team surveys | |
| Business Growth | ||||
| Profit Margin | Current service margins | +5-10% on statistically-driven services | Financial reporting | |
| New Business Win Rate | Current win % | +20% improvement | Sales pipeline tracking | |
| Service Evolution | Revenue % from data services | Double within 12 months | Service category reporting | |
| Talent Acquisition | Time-to-fill for analytical roles | 30% reduction | Recruitment metrics |
Measurement Implementation Tip: Create a “Statistical Maturity Score” for your agency, rating capabilities from 1-5 across key dimensions like data collection quality, analytical depth, and client-facing statistical communication. Assess quarterly to track progress and identify priority improvement areas.
Client-facing metrics include retention rate increases, average contract value growth, net promoter score improvements, and referral source diversification from relationship-based to reputation-based referrals.
Internal monitoring covers statistical error reduction, statistical projection accuracy improvements, budget allocation optimization, and team statistical concept confidence growth.
Business impact tracking includes profit margin expansion from premium pricing, new business win rate improvements, service offering evolution, and analytical professional attraction ability.
Why Statistical Expertise Creates Unmatched Competitive Advantage
Differentiation grows increasingly difficult in the marketing industry. Statistical expertise offers agencies genuine competitive advantages difficult to replicate. This extends beyond technical capabilities, changing how you deliver client value and position yourself in the marketplace.
Statistical proficiency with descriptive and inferential methods stands as a business necessity for modern marketing agencies. The relationship between these approaches enables thorough, rigorous data analysis, creating more effective strategies and improved ROI.
Agency owners find the distinction between statistical competence and excellence directly impacts bottom lines. Clients increasingly demand measurable results and data-backed strategies. Agencies excelling with both statistics types gain significant advantages, including the ability to demonstrate superior results, justify premium pricing, and ultimately get more clients who value data-driven success
- Client retention improves through demonstrably superior results
- Premium prices become justified based on predictable outcome delivery
- Agencies stand out amid competitive marketplace crowding
- Attracting and retaining analytically skilled professionals becomes easier
The progression from “we have data” to “we derive actionable insights from data” to “we predict and influence outcomes with data” represents the path forward-thinking agency owners take to succeed in increasingly sophisticated marketing ecosystems.
Executive Decision Framework: Apply this statistical decision matrix for major strategic decisions:
- Quantify potential outcomes,
- Estimate probability of each outcome based on data,
- Calculate expected value by multiplying outcomes by probabilities,
- Choose the option with the highest expected value adjusted for risk tolerance.
This changes intuition-based decisions into data-driven choices.
Implementing the frameworks and approaches discussed positions agencies as strategic partners rather than service providers. Statistical rigor changes marketing from creative guesswork into predictable results science.
Key Takeaway
Statistical expertise creates practical advantage in the competitive agency world. Focus on these core concepts to transform your business:
- Extract meaningful insights from existing data through descriptive statistics—contextualized information that justifies decisions, not just raw numbers
- Predict future results with confidence using inferential statistics, moving beyond reporting to evidence-based recommendations
- Connect work directly to client business results through the three-tier metrics framework (activity, performance, outcome)
- Follow the 12-month implementation roadmap with specific steps to build statistical capabilities without disrupting current operations
This statistical approach delivers tangible benefits: higher client retention, premium pricing power, and a distinctive market position built on proven results rather than promises.
Use both descriptive and inferential stats to deliver better results for your clients.
Start Your Free Trial Today