There’s a lot of information available online on how to grow your eCommerce business – from developing a killer social media strategy to acing your customer experience. Needless to say, eCommerce marketers have a lot of ground to cover, and plenty of questions come to mind. For instance:
Q. How do you ensure the efficacy of your eCommerce marketing, content curation efforts, and sales campaigns?
Q. Is conversion rate the only eCommerce metric that should be monitored?
Q. How can you get data-led insights into every aspect of your eCommerce sales funnel?
All these pressing questions can be answered with three simple words: By Reporting KPIs (Key Performance Indicators). To put it in basic terms, a KPI measures the success of a strategy/tactic and is quantifiable by nature. It allows you to track your business’ growth.
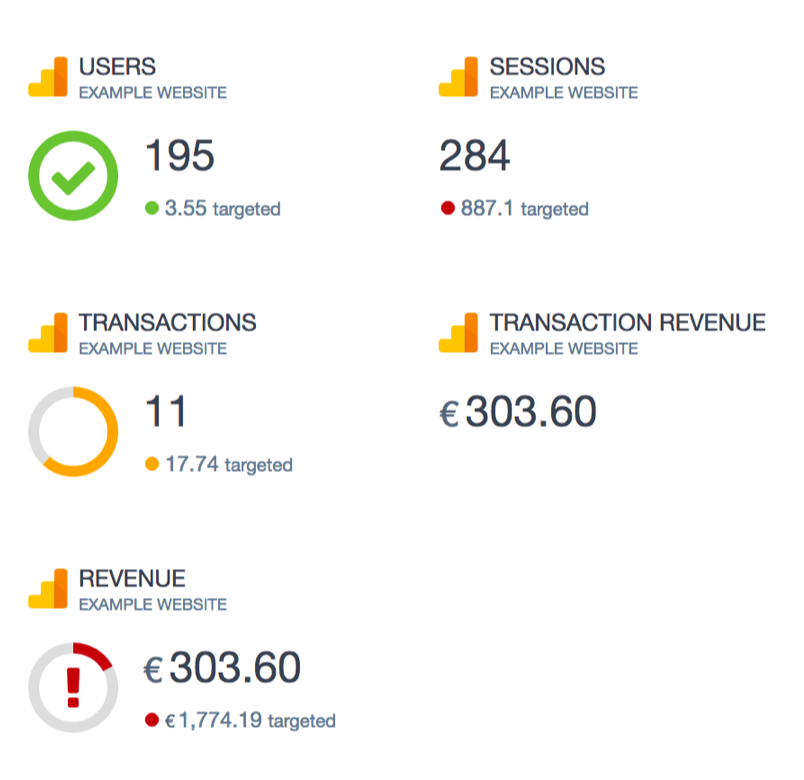
So why should you report KPIs? Reporting KPIs allows you to track critical eCommerce metrics such as Customer Lifetime Value, Customer Retention Rate, etc. over time and interpret emerging trends/results to make data-driven decisions going forward. This is where a reporting platform like Swydo comes in handy. It helps you to track costs, page speed, CTR, user sessions, among others:
If you’re wondering about how often to measure your KPIs, there’s no standard timeframe. It all depends on the type of KPI used, your target audience, where your customers are in the customer lifecycle, etc. Just know that you can measure KPIs weekly, quarterly, bi-weekly, or even monthly.
In this blog, we will look at the top-7 eCommerce KPIs that can protect the lifeblood of your business – your customers – and ensure that you’re moving in the right direction. Let’s jump right in.
Top 7 Important eCommerce KPIs To Keep A Pulse On
1. Sales Conversion Rate
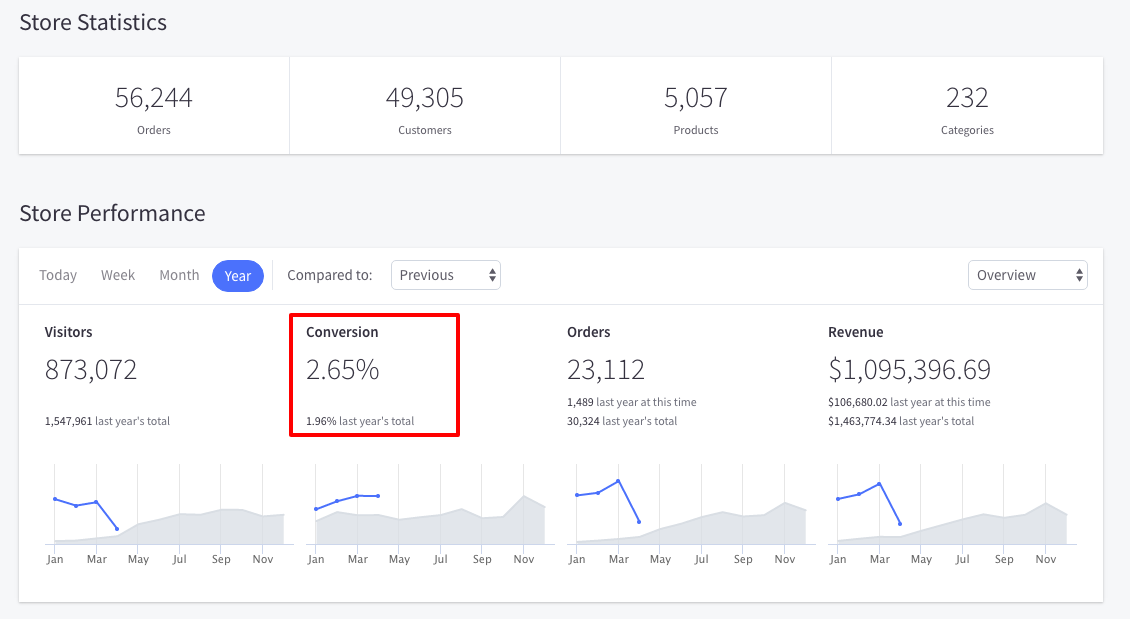
Ideal for: Optimizing your website’s traffic-driving efforts.
As the name suggests, the sales conversion rate is indicative of the total sales made over a specific time period. Here’s the formula to calculate the sales conversion rate:
Sales conversion rate = (Number of sales/Number of unique visitors) x 100
According to BigCommerce, the average ecommerce conversion rate lies anywhere between 1 to 2%. When calculating the sales conversion rate, make sure to factor in your average sales, cycle, your product type, etc.
To boost your conversion rate, deploy the following time-tested strategies:
- Engaging in onsite optimization split-testing
- Offering free shipping pricing
- Offering product bundles
- Ensuring that your website’s navigation is clean and organized
- Ensuring that your website speed can handle the visitor traffic
- Adding trust symbols such as testimonials, third-party accreditation, etc.
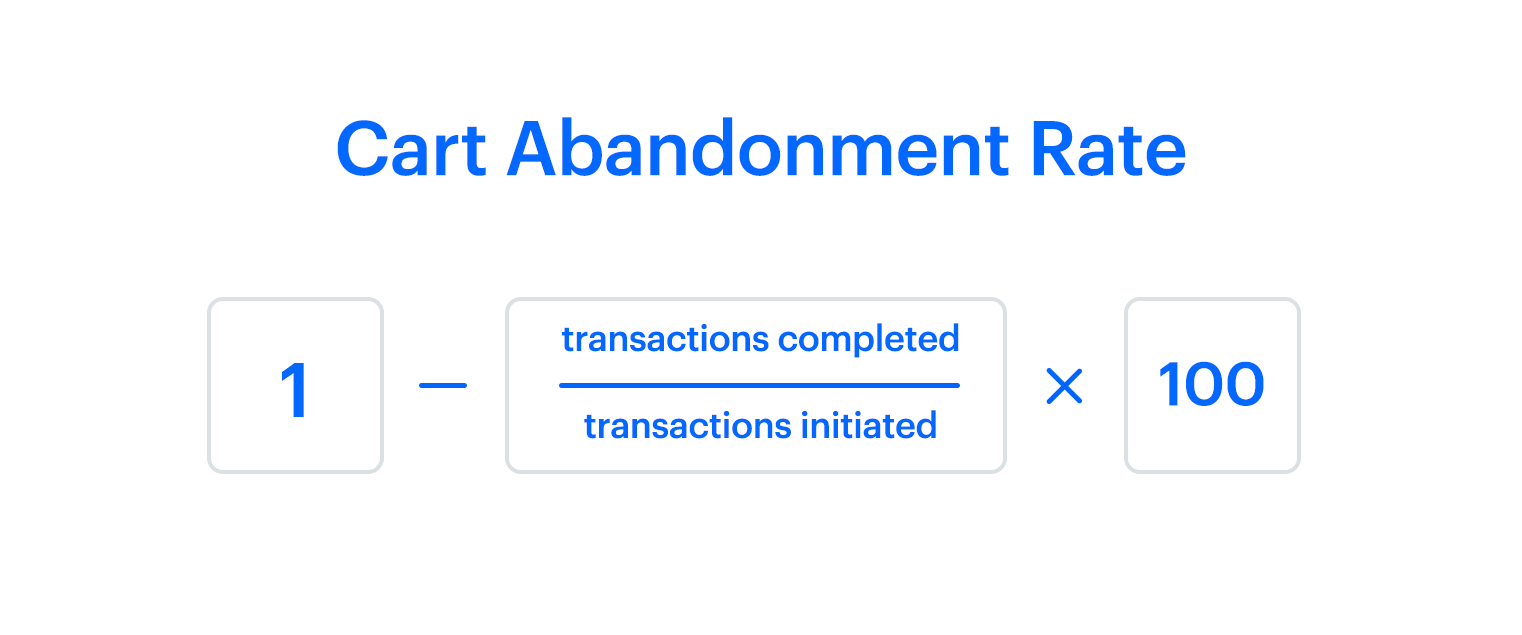
2. Cart Abandonment Rate
Ideal for: Understanding the extent to which your customers are abandoning the cart and leaving midway without making a purchase.
Cart abandonment rate signifies the rate at which customers add items to their cart but don’t end up making the purchase. To calculate the cart abandonment rate, use the following formula:
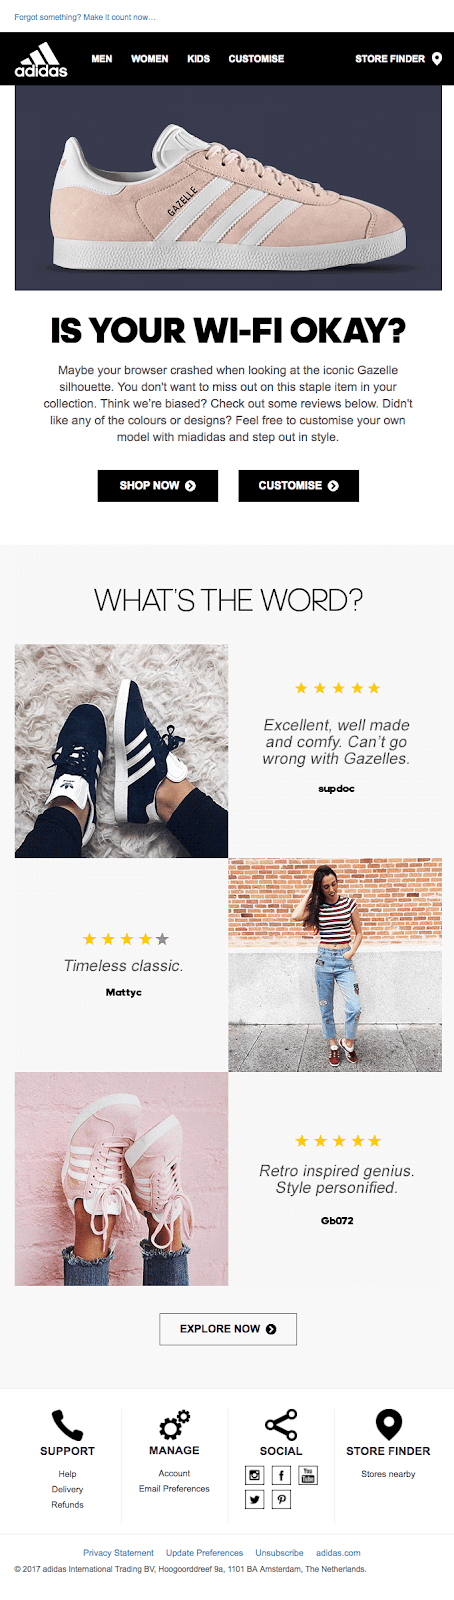
According to Statista, a staggering 88.05% of online shopping orders were abandoned. Needless to say, calculating your cart abandonment rate is critical to ensuring that you can take the necessary measures to lower this number. Plus, you can send cart abandonment follow-up emails as Adidas does:
You can also enable single-click seamless checkouts or offer additional discounts at checkout to encourage customers to complete the purchase:
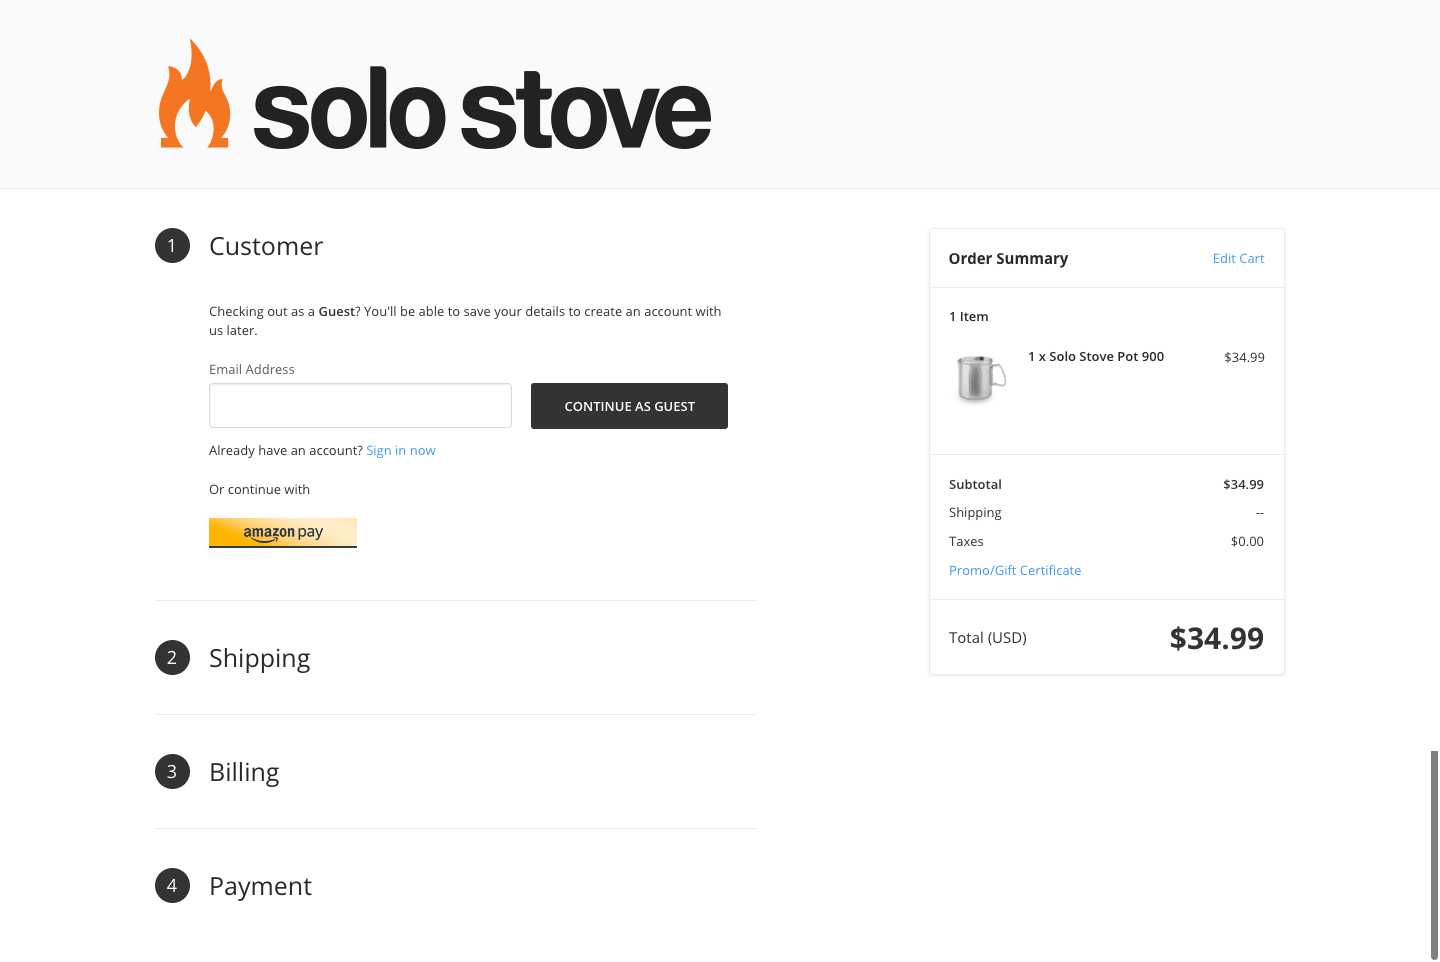 An Example Of A Single-Page Checkout Process – Image Source
3. Customer Retention Rate
Ideal for: Understanding the number of customers who stopped engaging with your brand within a specific time period.
To calculate the customer retention rate, try this formula:

If you’re wondering about how to boost the customer retention rate, you can leverage the power of intelligent chatbots to provide 24×7, personalized service – a big win among the customers of today:
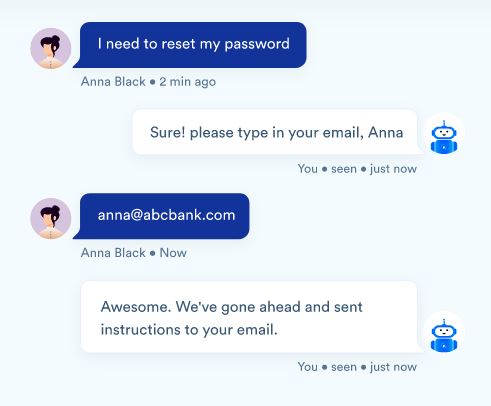
Chatbots also empower customers to self-serve and address issues themselves without having to wait for an agent to assist them. This speedy and convenient service makes this automated tool a hit among users.
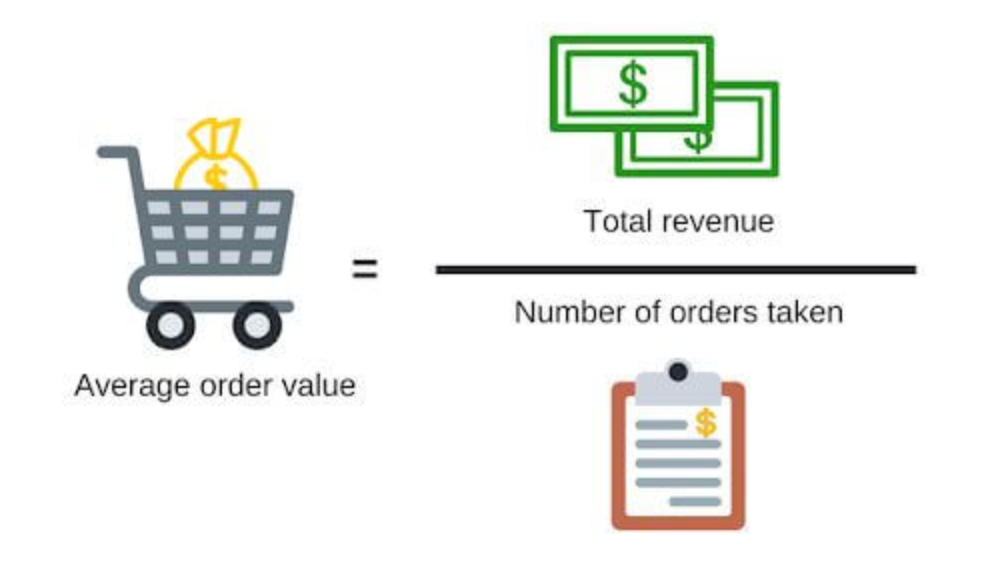
4. Average Order Value
Ideal for – Understanding how much your customers are spending on your product/service.
The math is simple: If the cost of acquiring new customers is greater than the amount they’re spending on every order, your business is losing money and vice-versa. To calculate the average order value:
If your average order value is less than your CPA (more on this in the next section), you’ll need to strategize ways to boost your customer’s order items as Madewell does:
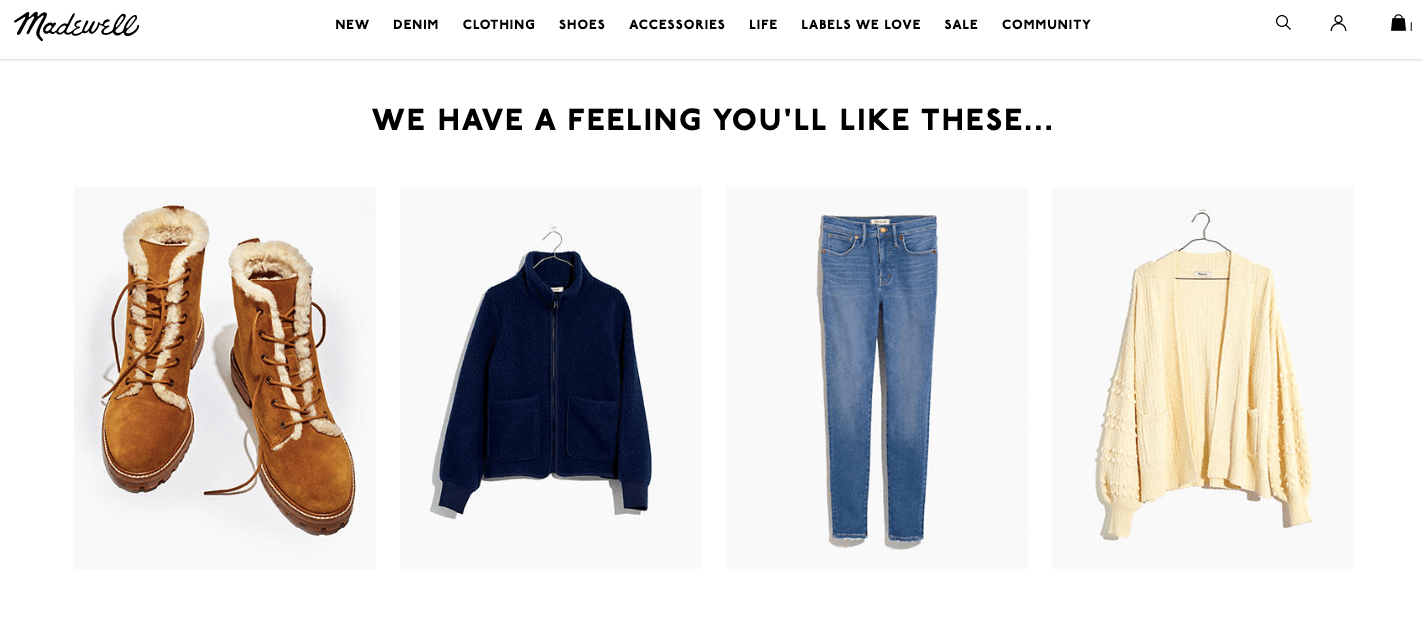
By offering personalized recommendations to the user as they’re checking out, the eCommerce brand attempts to boost the cart value. This kind of hyper-personalization can enhance your customer’s overall experience and boost customer loyalty. Additionally, you can offer customers relevant add-ons, loyalty programs, etc. to boost the order value and drive revenues.
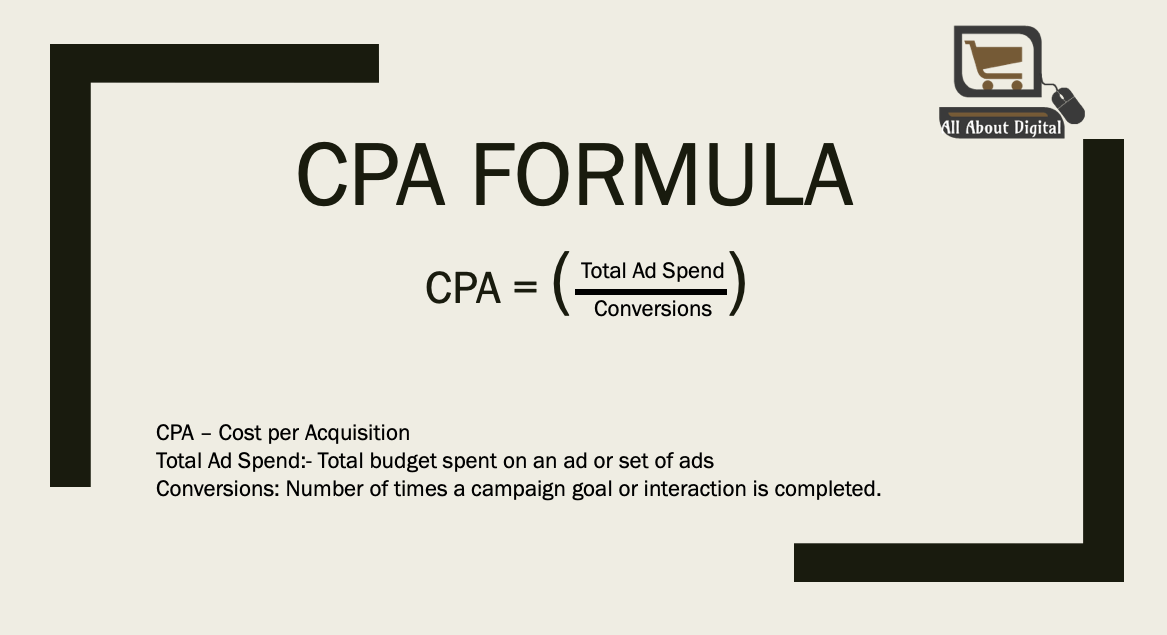
5. Cost Per Acquisition (CPA)
Ideal for: eCommerce marketers looking to understand how much they’re spending on acquiring new customers through every channel they deploy like PPC campaigns, email newsletters and more.
Basically, if your primary goal is not revenue or profit-oriented but rather customer acquisition oriented, CPA is for you. Here’s how you can calculate CPA:
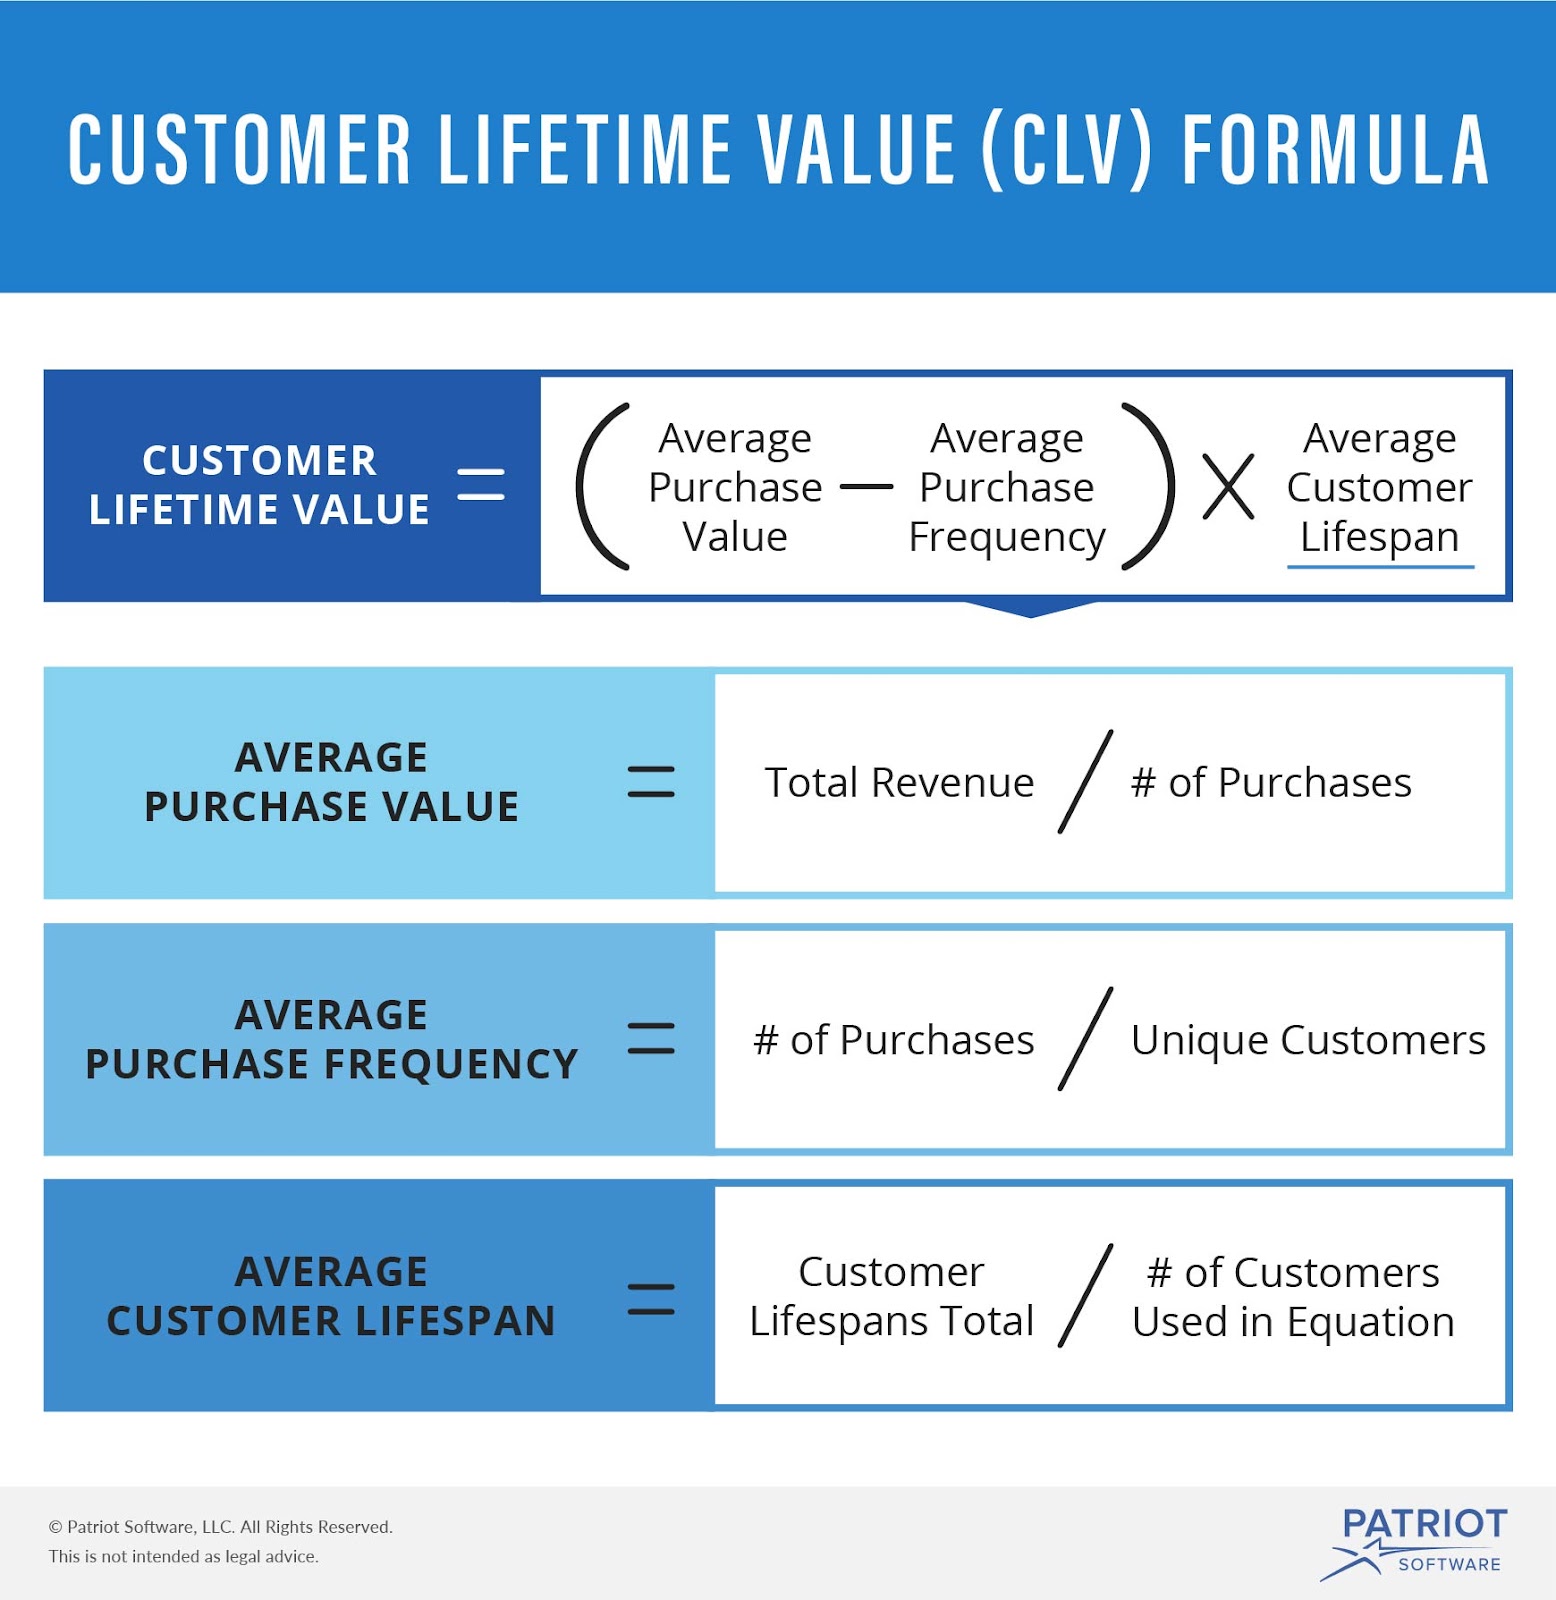
6. Customer Lifetime Value (CLV)
Ideal for: Understanding how much money your customer will spend on your brand in their entire lifetime as your customer.
CLV is one of the most critical metrics every eCommerce brand needs to measure to understand the overall health of the eCommerce business. Furthermore, it helps in gauging much the business can earn from a single customer based on the customer’s predicted lifespan.
This metric throws light on how much your customers like or dislike your product/service, what you’re doing right (or wrong) as a brand, and how you can improve your product/service. Here’s how you can calculate the CLV:
To boost your CLV, you can execute a number of useful hacks such as:
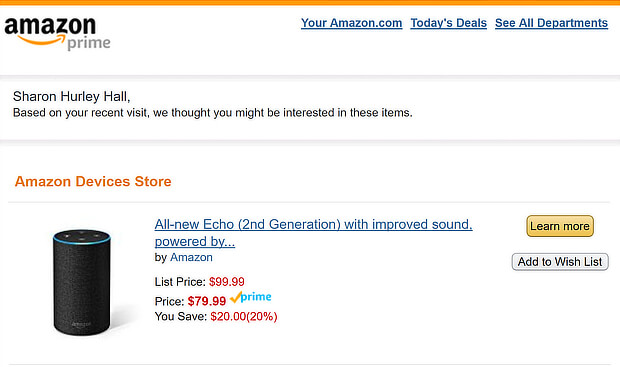
- Offering personalized product recommendations using AI-powered algorithms (as Amazon does) or even AI-enabled chatbots that can offer a customized shopping experience:
- Rewarding and incentivizing customers for being loyal customers:

7. Net Promoter Score (NPS)
Ideal for: Gauging your customer’s perception of your business/product/service.
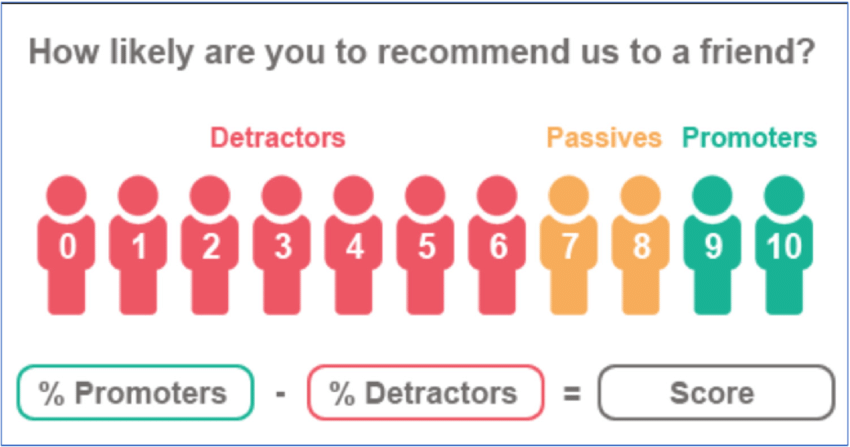
Unless you live under a rock, you might have come across the following question:
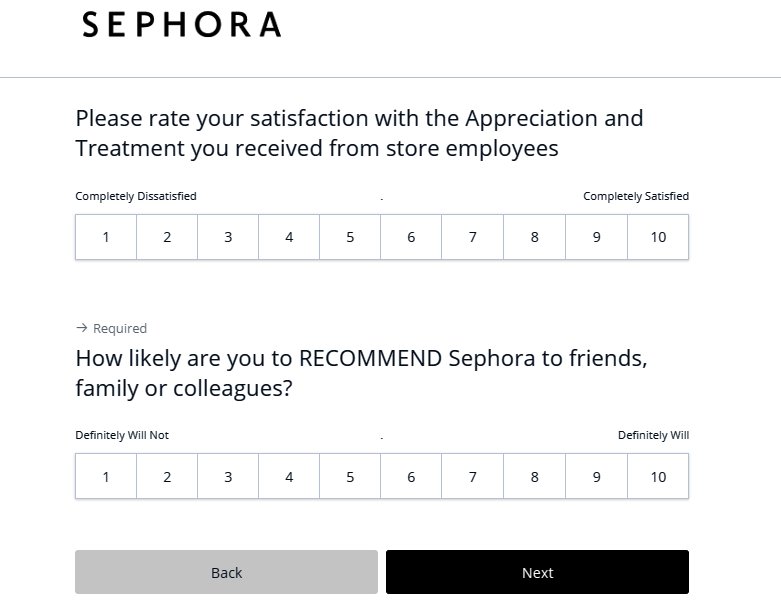
“How likely are you to recommend our company to a friend or colleague?”
This question is an example of an NPS survey which is often measured on a scale of 0 to 10. Based on the customer’s inputs, your brand can make the necessary changes to your customer experience or other critical touch-points in the user journey.
Here’s the formula to calculate the NPS:
Every time you roll out an NPS survey, make sure to ask the customer why they’ve given that particular rating (be it good or bad). Here’s an example of an NPS survey by Sephora:
Closing Thoughts: To KPI Or Not To KPI?
As a thumb rule, remember there is no single ‘master’ KPI will not provide a big-picture, holistic view of how your brand is faring in the customer’s eyes. You need to mix-and-match the right types of KPIs (based on your business goals) to arrive at a satisfactory KPI matrix that delivers impactful results and helps your company drive organic and sustainable growth.
To wrap up, here are the top-7 eCommerce KPIs you need to track to achieve long-term success and growth:
- Sales Conversion Rate
- Cart Abandonment Rate
- Customer Retention Rate
- Average Order Value
- Cost Per Acquisition
- Customer Lifetime Value
- Net Promoter Score
Are you ready to take your eCommerce KPIs game to the next level? We thought so.