
Most agency owners don’t have a growth problem. They have an operations problem dressed up as a growth problem.
You can see it in the data.
The average digital agency posted a 13% after-tax net margin in 2025, down from 14% the prior year. Revenue across the industry rebounded. Profit didn’t. The agencies that scaled past $1M a year and held their margins did one thing differently. They built the operational scaffolding that lets growth actually drop to the bottom line.
This guide is that scaffolding.
You’ll get eight frameworks you can use today. Real benchmarks from research you can verify. A decision tree for when to hire versus when to systemize versus when to automate. And an honest read on what AI changes for agency operations right now.
If you’re between $500K and $10M a year, this is the playbook you’ll wish someone had handed you at $1M. That’s the point where the systems that got you here stop working and nobody tells you why. The standard advice on how to grow a digital marketing agency treats the problem as sales-and-marketing. It almost never is at this stage. It’s operational capacity.
Let’s get into it.
What Agency Operations Actually Means
Agency operations is the set of systems, processes, structure, and metrics that turn client work into reliable profit at scale. It’s everything that happens between “we won the deal” and “the money hit our account, the client renewed, and our team isn’t burned out.”
Boring definition.
It is.
That’s why most agencies under-invest in it. Operations doesn’t have the dopamine hit of closing a new logo. But the trade-off is worth seeing clearly. Under $1M a year, you can hold the agency together with founder energy, group chats, and a shared Google Drive. Above $1M a year, those same things will start working against you.
Four functions run every agency:
- Revenue generation. Sales, marketing, account growth.
- Production. The actual client work.
- Support. Finance, HR, legal, IT, admin.
- Leadership. Strategy, hiring, performance, culture.
When founders say “operations,” they usually mean #2 and #3. Real operations is the connective tissue between all four. It makes sure work flows from sale to delivery to renewal without leaking time, money, or quality at every handoff.
Here’s the bind.
The work that pays the bills (production) eats the time required to build the systems that make production scale. Most agencies break through $1M a year despite their operations, not because of them. Then they hit the wall.
Operations vs. Project Management vs. Account Management
These three roles get blurred at every agency under $3M a year, and the confusion costs you. The simplest version:
- Project management owns the project. Scope, timeline, deliverables, internal coordination.
- Account management owns the client. Relationship, retention, expansion, communication.
- Operations owns the agency. The systems that make project and account management possible across many clients at once.
At $1M a year, one person can wear two of these hats. At $3M a year, you’ll regret combining any of them. At $10M a year, all three are distinct functions with their own leads.
Framework 1. The Operations Maturity Stack
At every major revenue threshold, your agency becomes a fundamentally different business. The playbook changes. The tool stack changes. The people you need change. The metrics that matter change.
Map yourself to one of five stages right now.
Framework 1 · The Operations Maturity Stack
Five stages, one question: does your ops maturity match your revenue?
Most agencies scale past a revenue threshold on hustle, then hit a wall their systems can’t absorb. Find your stage below.
STAGE 01
$0–$250K
Founder-Led
Spreadsheets and the founder’s memory run the agency. Fine for now.
STAGE 02
$250K–$1M
Systemized
First Ops Lead or Senior AM hire. Margins compress 6–18 months.
STAGE 03
$1M–$3M
Operated
Real PSA, monthly close, first non-founder leadership hire.
STAGE 04
$3M–$10M
Architected
Full-time COO, department leads, real-time dashboards.
STAGE 05
$10M+
Enterprise
Founder is the visionary, not the operator.
Where operations became a strategic disciplineStage 1. Founder-Led ($0 to $250K a Year)
The founder is in everything. Spreadsheets run the agency. The PM tool, if there is one, is Trello or Notion. Time tracking is whatever the founder remembers to write down. Clients talk to the founder for everything.
What’s right at this stage: almost everything is in the founder’s head, and that’s fine. You’re still learning what the agency wants to be. Hold off on over-systemizing.
The trap: founders skip this stage too fast, hiring before they’ve found their offer or pricing. Or they stay too long, refusing to formalize anything until everything breaks at $400K.
Three systems to build today: a simple CRM (HubSpot Free or Pipedrive starter), one PM tool, and a real bookkeeping setup. Not QuickBooks Self-Employed. Actual cash and accrual books from month one. Stop using Stripe and your business checking account as your accounting system.
Stage 2. Systemized ($250K to $1M a Year)
You’ve got 3 to 8 people. The founder is still in delivery but increasingly resents it. You have a PM tool everyone half-uses. Your first SOPs exist as Loom videos in a Notion page somewhere. Account management is the founder plus one stretched-too-thin senior person.
This is where the Operations Maturity Stack typically gets diagnosed wrong. Founders sitting at $700K to $900K a year think they need more clients. They actually need to graduate to Stage 3. They’re just allergic to the cost.
The hire that makes or breaks this stage isn’t another producer. It’s an Operations Lead or Senior Account Manager who can take the operational weight off the founder. That hire will compress margins for 6 to 18 months. Budget for that today.
Core builds: first version of your time-tracking discipline (Harvest, Toggl, or built into your PM), first quarterly P&L review, first formal client onboarding doc, first sales-to-delivery handoff template. The handoff template alone is probably worth $50K a year in saved chaos.
Stage 3. Operated ($1M to $3M a Year)
You hit your first real plateau here. Most agencies stall at this stage because the revenue engine still depends on the founder being in every sales conversation. The fix isn’t more hustle. It’s a real lead generation system for agencies that doesn’t require the founder’s calendar to function.
You need a real PSA (Productive, Scoro, Workamajig, or HubSpot Service Hub plus Forecast). A monthly P&L close that happens on a date, not “when we get to it.” Scoping discipline that doesn’t fold the moment a client pushes back. And your first non-founder leadership hire, usually a COO, Integrator, or Director of Operations. A separate question worth doing the work on at this stage is your full tool stack, since most Stage 3 agencies are paying for 30+ tools and using 8. A clean review of the best marketing agency tools for your specific service mix usually pays for itself in canceled subscriptions inside a month.
The most common mistake at this stage: hire a junior ops person and call them an Operations Manager. You need someone who’s run operations at an agency at least one stage above yours. Pay for the seniority. The salary delta is a rounding error compared to what they’ll fix.
Stage 4. Architected ($3M to $10M a Year)
This is where pod structures become a serious option. Where leadership cadence (weekly meetings with a fixed agenda, monthly leadership reviews, quarterly planning) stops being optional. Where your dashboards run in real time, not “I’ll pull a report when we need one.”
A Stage 4 agency has:
- A full-time COO or Integrator
- Department leads in delivery, account management, and growth
- A real finance function (fractional CFO at minimum, full-time if above $5M)
- Documented SOPs with assigned owners and review dates
- A revenue engine the founder doesn’t have to drive personally
Reporting is usually the first thing that exposes a Stage 4 agency running Stage 3 systems. If every account manager builds their client reports their own way, that inconsistency is a scale problem, not a preference problem. You want to standardize client reporting before you add the next ten clients, otherwise Stage 4 headcount produces Stage 3 margins.
If your founder is still in delivery at Stage 4, that’s the bottleneck. Not your sales pipeline.
Stage 5. Enterprise ($10M+ a Year)
Functional CFO. Real People Ops function. M&A-capable. Profit-sharing or equity programs in market. Sometimes a holding-company structure. The founder is the visionary, not the operator.
Most agencies never reach Stage 5. That’s fine. But the agencies that do all share one trait. They treated operations as a strategic discipline from Stage 2 onward, not an afterthought to hire for later.
A Diagnostic You Can Run in Five Minutes
Five questions. Score yourself 0 to 2 on each (0 = not at all, 1 = sort of, 2 = yes, robustly):
- Could the founder take a four-week unplugged vacation and the agency would still hit its monthly numbers?
- Do you close the books monthly within 10 days of month-end with cash AND accrual P&L?
- Is there a documented sales-to-delivery handoff every new client goes through, owned by a named person?
- Does each role have a defined capacity and a defined billable target, both tracked weekly?
- Do you have a person whose primary job is operations (not the founder, not “the senior AM who also does ops”)?
Score 0 to 3, Stage 1 mindset (regardless of revenue). 4 to 6, Stage 2. 7 to 8, Stage 3. 9 to 10, Stage 4+.
If your revenue says Stage 3 but your score says Stage 2, that gap is exactly what’s killing your margins today.
How Profitable Should Your Agency Be
The single biggest source of bad decision-making at agencies is comparing yourself to the wrong number. Owners measure themselves against gross billings (vanity), peers (skewed by whoever’s bragging that month), or some half-remembered “20% net margin” rule. The real conversation about agency profitability starts with which number you’re measuring against.
Here are the real benchmarks.
AGI vs. Revenue and Why Gross Billings Is a Vanity Number
Adjusted Gross Income (AGI) is revenue minus pass-through costs. That means media spend, contractors brought in for a specific project, software you bill back to the client. It’s the money your agency actually gets to keep before paying its own people. Drew McLellan at Agency Management Institute has been beating this drum for over a decade. AGI is the only revenue number that matters.
If you bill $200K a month but $80K of that is media spend you’re passing through to Meta and Google, your AGI is $120K. Every profitability benchmark below is calculated on AGI, not gross billings.
Real Benchmarks · How Profitable Should Your Agency Be
Where every dollar of AGI should go, and where agencies actually land
Drew McLellan’s 55/25/20 rule, next to 2025’s real net margin data.
The 55/25/20 Rule (% of AGI)
The 55 and 25 can shift. The 20 is the one you never steal from.
Net margin, 2025 data
Source: Promethean Research, 2026 State of Digital Services Report (n=119).
The 55/25/20 Rule
Drew McLellan’s framework is the most widely cited allocation rule in agency benchmarking:
- 55% of AGI goes to fully loaded delivery salaries (the people doing client work, including benefits and payroll taxes)
- 25% goes to overhead (rent, software, admin, leadership not in delivery)
- 20% drops to profit before taxes
You can shift the 55 and the 25 around. McLellan’s rule is simple: protect the 20. That’s the number you never steal from.
Delivery Margin, the Metric You’re Probably Not Tracking
Marcel Petitpas at Parakeeto draws a distinction most agencies miss. Three different “margins” get talked about as if they’re the same number:
- Agency-wide delivery margin on your P&L. Target 50%+ for a healthy agency.
- Project-level delivery margin. Target 60%+ at the project level (per Parakeeto’s published benchmark, because project-level needs to absorb shared delivery costs and slack capacity).
- Net margin. What actually drops to the bottom line after overhead.
The reason this distinction matters is simple. Your P&L margin is the average. Your project-level margin is where you can intervene. If your overall delivery margin is 55% but a third of your projects sit at 35% and another third sit at 75%, that’s a completely different fix than if everything were uniformly at 55%.
You can’t fix what you can’t see at the project level.
What the Actual Data Says
Current industry research, the short version:
- Average digital agency net margin sat at 13% in 2025, down from 14% the prior year, on average revenue of $4.43M. That translates to roughly $575K in after-tax profit (Promethean Research, 2026 State of Digital Services Report, n=119 agency leaders).
- Studio agencies with fewer than 10 FTE averaged 19% net margins in 2025, materially higher than larger shops.
- Agencies that reduced their service mix in 2025 grew 13% and posted 30% net margins, versus the 10% margins typical of agencies that broadened their offering. Focus pays. Sprawl doesn’t.
- Fewer than half of agencies operate above 10% net margins, and nearly 1 in 5 can’t calculate their margin at all (Productive.io, State of the Agency Business 2025, n=93).
- 76% of agencies still rely on project-based fees as their primary revenue model. Value-based or performance-based models combined remain below 5% (same Productive report).
When someone tells you their agency does 35% net margins, either they’re lying, they’re in the top sliver of operators, or they sell one thing extremely well to a tightly defined market.
Revenue per FTE, the Second-Most-Useful Number
Karl Sakas at Sakas & Company benchmarks revenue per FTE at $150K to $200K (including the owner). Below $120K and you’re structurally underwater. Below $100K is panic territory. The Promethean averages cluster around the same range.
Quick test.
If your agency does $2M AGI with 16 FTEs, you’re at $125K per FTE. That’s a 55/25/20 problem dressed up as a “we need more revenue” problem. You don’t need more revenue. You need fewer people, more output per person, or higher pricing.
Framework 2. Pricing That Survives the AI Productivity Curve
The most expensive operational mistake an agency can make right now is to keep selling time when AI is collapsing the time required.
Bill hourly and every productivity tool you adopt directly cuts your revenue. That’s not a sustainable model. It used to be defensible when “the hour” represented the actual unit of expert effort. Now it doesn’t. Clients have noticed. Done right, your agency pricing model should reward speed and expertise, not punish them.
The same Productive report shows 76% of agencies still use project-based fees as their primary model, with value-based and performance-based models combined sitting under 5%. Plenty of room to move up the pricing maturity curve.
The Pricing Quadrant
Map your pricing options on two axes: who carries the risk, and what the price is tied to.
Framework 2 · Pricing That Survives the AI Productivity Curve
The pricing quadrant: who carries the risk, what the price is tied to
Most agency profitability sits on the diagonal from fixed-fee to value-based.
Fixed-fee project
Scope is set, agency absorbs the risk of overrun.
Start herePerformance-based
Agency risk, priced on the outcome delivered.
Hourly / T&M
Client pays for time; every efficiency gain cuts revenue.
Value-based / outcome
Client risk, priced on results, not hours.
Migrate here over 12 monthsThe interesting move isn’t picking one quadrant. It’s understanding where each of your services sits today and whether you can shift one quadrant rightward (toward outputs) over the next 12 months.
Most agency profitability sits on the diagonal from “fixed-fee project” to “value-based.” That’s pricing tied to outputs, with risk shared appropriately.
The Pricing Transition Path
If you’re hourly today and want to move toward value-based pricing without blowing up your existing client base, do these in order:
- Productize first. Pick your highest-volume engagement type and turn it into a named, fixed-fee offer with a clear scope. Not “consulting hours.” Call it “the Q1 Conversion Sprint, $X.”
- Test on new clients. Hold off on converting existing hourly clients first. Lead with the productized offer on new sales conversations.
- Track delivery margin per productized offer. If your project margin on the productized version lands above 70%, you’ve priced it correctly.
- Layer outcome-tied pricing onto a single offer. Once you have stable margins on a fixed-fee offer, add a performance component for one specific client willing to share upside.
- Migrate the book over 12 months. Existing hourly clients renew into the new structure at their natural renewal point.
How to Handle the “AI Makes This Faster” Client Question
When a client asks why they should pay the same fee if AI is doing 30% of the work, you need a script. The honest answer:
“You’re not paying for the time. You’re paying for the outcome and the expertise behind the decisions. AI hasn’t changed what good looks like. It’s changed how fast we can produce it. We’re reinvesting the saved time into deeper strategy, better creative testing, and faster iteration. That’s what’s moving your number.”
That answer only works when it’s true. If you aren’t reinvesting the saved time, fix that first.
A Pricing Rule of Thumb You Can Use Today
Parakeeto’s pricing rule is straightforward. Target a rate of at least 2.5× your Average Cost Per Hour (ACPH). Spend no more than 40 cents to earn a dollar of revenue on any given project. If a producer costs you $50 an hour fully loaded, your billable rate target is $125 minimum. Below that and the math doesn’t support a healthy delivery margin.
Framework 3. Team Structure That Matches Your Stage
Five structures, mapped by what fits at each size.
- Flat or founder-led. Everyone reports to the founder. Works to about $500K. Breaks above that.
- Functional. Departments (creative, paid media, account management) work across all clients. Common at $500K to $3M. Creates handoff friction.
- Pod or client-team. Small cross-functional teams own a portfolio of clients end-to-end. Common at $1M+.
- Matrix. People belong to both a functional group and a client team. Used in larger agencies with specialized roles.
- On-demand or elastic. Small full-time core with a contractor bench. Common in specialist agencies that need to flex.
Why Pods Get the Most Attention
The pod model is having a moment because the economics often work better than functional structures. Karl Sakas defines a typical pod as 3 to 6 people. That’s an Account Strategist (serving as client strategist and account manager), a designer, a developer, a content strategist, and a project coordinator. Each pod runs autonomously.
The benefits Sakas calls out:
- Scalability. Add new pods as you add clients. Hard to serve 50+ clients in a traditional structure. Doable with pods.
- Client experience. Each client gets a dedicated team that knows their business. Faster responses, stronger relationships, more retention.
- Accountability. Small dedicated teams with clear ownership tend to outperform sprawling functional teams.
Where pods fail:
- Load imbalance. Pod A gets the three biggest clients, Pod B gets seven small ones. Without active rebalancing, Pod B underutilizes and Pod A burns out.
- Role stagnation. Designers see the same brands every week. Without rotation or cross-pod creative reviews, the work goes stale.
- No promotion path. Each pod has 1 to 2 people in each role. Career progression gets messy.
- Client monotony. Some senior creatives explicitly don’t want to live inside one client’s brand every day. Force them into a pod and you’ll lose them.
Pod Economics, Run the Math
A simple pod P&L for an illustrative pod.
Costs (fully loaded):
- Pod lead: $130K
- Senior strategist/practitioner: $110K
- Mid-level executor: $85K
- Mid-level executor: $85K
- Total fully loaded cost: $410K
Revenue at typical pod composition:
- 6 retainer clients × $8K MRR = $48K a month = $576K a year
Pod-level economics:
- Revenue: $576K
- Direct delivery cost: $410K
- Pod delivery margin: 29%
That’s not enough. Healthy delivery margin sits at 50%+ agency-wide and 60%+ at project level. To get this pod to a healthy margin, one of three things has to change:
- Raise average MRR per client to about $11K (probably means moving upmarket)
- Stretch the pod from 6 to 8 clients (means tighter SOPs, maybe a junior add)
- Shift the role mix toward more cost-effective seniority (mid-level instead of senior, onshore-offshore split)
Most pod problems are pod-economics problems. If the math doesn’t work, the structure won’t either.
When to Spin Up a New Pod
Add a pod when all four conditions are true:
- Your existing pods sit above 80% billable for two consecutive months
- You have at least three signed clients ready to onboard (or three pipeline opportunities closing inside 60 days)
- You have a credible pod lead identified, either internal promotion or hired ahead of the demand
- You have the cash to absorb 4 to 6 months of margin compression before the new pod fills
Hold off on adding a pod just because “we’re hiring anyway.” Add a pod when existing pods are full and there’s signed demand.
How Many Clients Is the Right Number
Sakas’s published benchmark says most agencies should run 10 to 20 active clients (unless you’ve successfully run pods, where you can carry more).
- Fewer than 10? You have a client concentration problem. One client fires you and you face layoffs.
- More than 25? You have a client dilution problem. Lots of small clients demanding excessive attention. Hard to be consistently profitable without a structural change like pods.
Count your active clients right now. If you’re outside 10 to 25, structure is your problem before sales is.
Framework 4. Capacity Benchmarks That Tell You When to Hire
Capacity is what someone can do. Billable time is what they’re actually doing on revenue-earning work. Parakeeto’s published benchmarks are the cleanest public reference set:
Framework 4 · Capacity Benchmarks
Weekly billable targets, by role
Parakeeto’s published ranges. Anything sustained past the danger line is a recruiting bill you haven’t seen yet.
A note on the danger zone. Anything sustained above 85% is a recruiting bill you haven’t seen yet. Run your producers at 95% and you’ll lose them. Replacement cost is typically 6 to 9 months of fully loaded salary. The math kills you faster than the under-billable hours would have.
How to Calculate Capacity (the Parakeeto Formula)
Parakeeto’s published formula for revenue potential:
(Capacity ÷ Utilization Target) × ABR = Revenue Potential
Where:
- Capacity = total available hours across the team for a given period
- Utilization Target = the % of those hours that should be billable
- ABR = Average Billable Rate (effective rate, not list rate)
If your numbers say you can produce $4M of revenue and you’re delivering $2.4M, you don’t have a capacity problem. You have a sales problem or a pricing problem. If your numbers say you can produce $2.4M and you’re delivering $2.4M, you don’t have a sales problem. You have a capacity problem, and any new sales will break your team.
Get this calculation right and most operational arguments at your agency end today.
Bonus Number. Billable Ratio
Sakas’s billable-ratio benchmark is 60% or higher across the entire team. Below 60% and you’re losing money on people. Above 60% and the math starts to support healthy margins, assuming your rates aren’t underwater.
Framework 5. The Three-Tier Agency Dashboard
Most agencies track lagging metrics. Revenue last month. Profit last quarter. Churn this year. By the time those numbers tell you something’s wrong, it’s already wrong. Becoming a data-driven marketing agency doesn’t mean tracking everything. It means tracking the handful of metrics that predict the next quarter.
A leading indicator is a metric that shows you what’s about to happen. Track these and you’ll stop being surprised.
Five Leading Indicators to Run
- Delivery margin per active project. Updated weekly. Anything below 50% gets flagged. Anything below 35% gets a same-day intervention.
- Revision rate by project type. Track what % of deliverables come back with material revision requests. A spike on a specific project type means a brief problem, a brand-fit problem, or a senior-review problem.
- Time-to-value for new clients. Days from contract signed to first meaningful result. Long time-to-value predicts early churn more reliably than almost any other metric.
- Lead time per deliverable type. Days from project kickoff to delivery. Shorter lead times mean less queue time, fewer context losses, fewer revision cycles.
- Forward-booked billable hours (4-week and 12-week). What % of your team’s capacity for the next 4 and 12 weeks is signed and scheduled? If 4-week is below 70%, you’ve got an immediate sales problem. If 12-week is below 50%, you’ve got a structural pipeline problem.
The Productive 2025 data is grim here. Only 14% of agencies plan resources more than three months ahead, and 52% allocate within four weeks (same Productive State of the Agency Business 2025 report cited above). That’s why most agencies are constantly firefighting. They can’t see far enough out to stop the fire before it starts.
Different Roles Need Different Dashboards
Map your metrics to who owns them and how often they need to see them.
Framework 5 · The Three-Tier Agency Dashboard
Not everyone needs the same numbers, or the same cadence
Leading indicators only work if the right role sees them at the right frequency.
Tier 1 · Owner & leadership
- AGI trailing 4 weeks vs. forecast
- Net margin, trailing month
- Forward-booked billable hours (4-wk & 12-wk)
- Client concentration, top 3 clients
- Pipeline value × probability
- Employee sentiment trend
Tier 2 · Operations & department leads
- Project-level delivery margin (red / yellow / green)
- Active projects past deadline
- Open scope-change requests
- Billable hours by role this week
- Data connection health across reporting
Tier 3 · Project & account managers
- Status of each active deliverable
- Hours logged vs. budget per project
- Client communication SLA compliance
- Open client requests, by age
Tier 1. Owner and leadership (weekly review)
- AGI trailing 4 weeks vs. forecast
- Net margin trailing month
- Forward-booked billable hours, 4-week and 12-week
- Client concentration (% from top 3 clients)
- Active opportunity pipeline value × probability
- Employee sentiment trend
Tier 2. Operations and department leads (daily)
- Project-level delivery margin (red/yellow/green)
- Active projects past deadline
- Open scope-change requests
- Billable hours by role this week
- Data connection health across reporting (broken connections cost real hours)
Tier 3. Project managers and account managers (continuous)
- Status of each active deliverable
- Hours logged vs. budget per project
- Client communication SLA compliance
- Open client requests by age
Each metric needs a formula, a threshold (when does it turn yellow, when does it turn red), and a named owner. Without owners, dashboards become wallpaper.
This is where reporting infrastructure either pays for itself or quietly bleeds your team. Most agencies build client-facing reports (the ones that go out monthly) and call it done. Meanwhile the internal monitoring layer that would have caught a broken Meta connection or a Google Ads token expiring three weeks ago doesn’t exist. Separate the two. Client reports show progress and outcomes on a defined cadence. Internal monitoring boards run continuously and alert someone when a metric drifts outside its expected range.
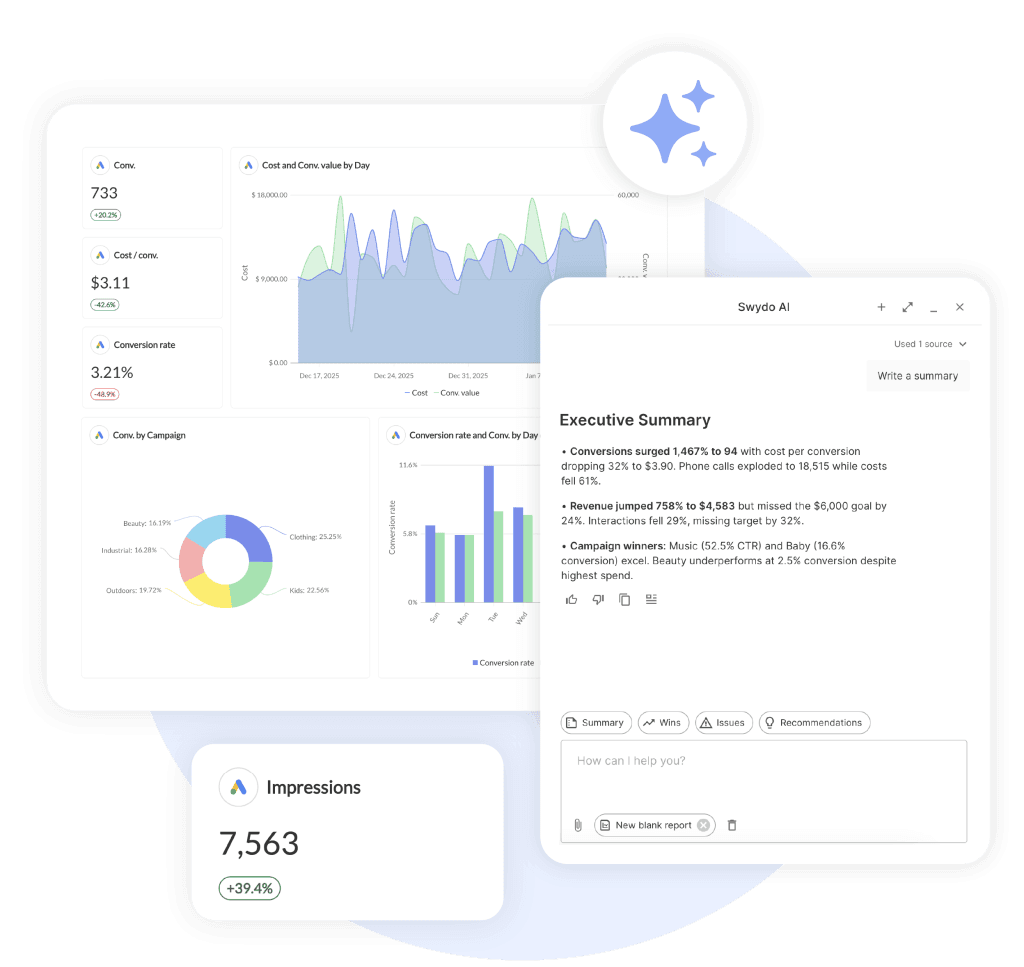
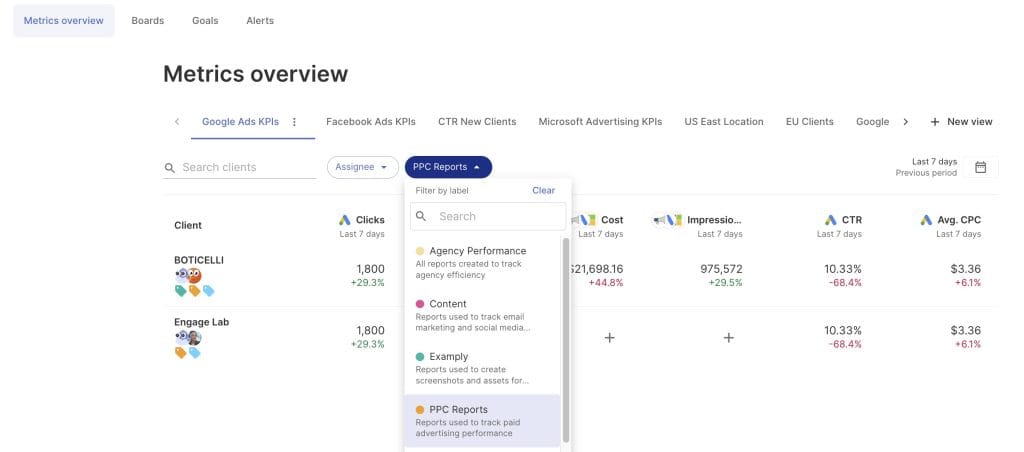
The practical version of this is a two-minute morning pass across the whole book. In Swydo, four components handle it. Metrics Overview puts every client’s core numbers on one screen. Goals show pacing against target, so you see the accounts that will miss before the month closes.
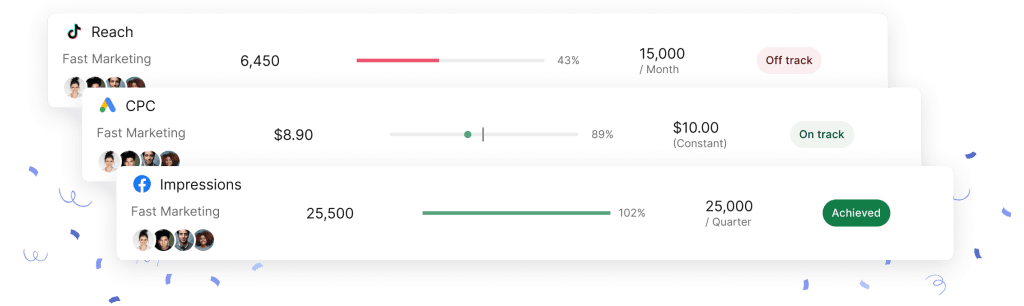
Alerts fire when a metric moves outside the range you set, so nobody has to remember to look. And the Data Health Check surfaces broken or stale connections before an account manager builds a report on top of bad data. At 5 clients you can run that sweep manually.
At 50 you can’t, and the agencies that try are the ones finding out about problems from the client. The principles of client reporting best practices apply to both layers, the client-facing one and the internal one most agencies skip.
Framework 6. SOPs Your Team Will Actually Use
The standard agency advice on SOPs is wrong. It goes something like this. Lock the senior team in a room, document every process, hand the binder to the team, watch nobody open it.
A better mental model. SOPs are a byproduct of solving real problems, not a project unto themselves.
The Team-Led Principle
SOPs built by the team get followed by the team. Top-down SOPs get ignored. Run this approach:
- Identify the most painful current operational problem. Not “we should document X.” Something actively causing pain this week.
- In a 15- to 30-minute session, ask the team how they currently handle it. Write it down where everyone can see.
- Ask what’s broken about the current approach and how to make it better.
- Write the new version together. Assign an owner. Set a review date.
- Repeat on a different problem next week. Run this for 60 to 90 days. Your team will start identifying process gaps on their own.
Takes longer than the lock-the-manager-in-a-room approach. Also produces SOPs that live somewhere other than an abandoned Notion page.
Build These SOPs First
You can’t document everything at once. Sequence matters.
At Stage 2 ($250K to $1M a year), build first
- Sales-to-delivery handoff (the single highest-ROI document at this stage)
- Client onboarding (first 30 days)
- Weekly client status communication template
- Time tracking standards (what counts as billable, granularity, when to log)
- Scope-change request and approval process
At Stage 3 ($1M to $3M a year), add
- Quality review checklist per deliverable type
- Project kickoff process
- Client offboarding (yes, even when they leave happy; get the testimonial, run the retro)
- Hiring rubric per role
- Performance review cadence and template
At Stage 4 ($3M to $10M a year), add
- Pod or team rotation policies
- Cross-team escalation paths
- Senior leadership decision rights documentation
- Strategic planning cadence (quarterly OKRs or Rocks)
- Compensation philosophy and bands
SOP Review Cadence
The missing layer at most agencies is simple. SOPs aren’t read-once documents. They need a review cadence and a named owner. The simplest version:
- Every SOP has a named owner (a person, not a department)
- Every SOP has a review date stamped on it (typically 6 months out)
- The owner either updates the SOP or confirms it’s still current by that date
- Operations runs a quarterly check on overdue SOP reviews
Not glamorous infrastructure. Also what separates agencies that grow into their SOPs from agencies that produce them and abandon them.
Framework 7. The HSA Decision Tree (Hire, Systemize, Automate)
The default move when something breaks is “hire someone for that.” It’s usually the wrong move.
Framework 7 · The HSA Decision Tree
Something broke. Before you post a job listing, run these four questions.
Hire
Budget for a 6–18 month margin dip while they ramp.
Contractor / Fractional
Or load-balance the work internally.
Systemize
A new hire won’t fix a broken process.
Full automation
Zapier, n8n, Make. Highest-leverage on documented SOPs.
AI workflow
Deterministic automation with an LLM step inside it.
AI agent, or stay human for now
Narrow, well-bounded tasks only. Nothing client-facing without a human in the loop.
Newest & most overhyped categoryRun four questions in order:
- Is this work judgment-based or deterministic?
- Judgment-based (strategy, creative decisions, client relationship): only humans can do this well today. Go to question 2.
- Deterministic (data pulls, status updates, formatting, scheduling): jump to question 4.
- Is the bottleneck a capacity issue or a process issue?
- Capacity (the right person exists but they’re maxed out): consider hiring or shifting load. Go to question 3.
- Process (the work takes too long because the process is broken): systemize first. A new hire won’t help.
- Will the workload sustain a full-time role?
- Yes: hire.
- No: contractor, fractional, or load-balance internally.
- Is the deterministic work the same every time or does it vary?
- Same every time: full automation (Zapier, n8n, Make).
- Varies in predictable ways: AI workflow or assisted automation.
- Varies unpredictably: AI agent, or stay with a human for now.
The mistake most agencies make is to jump from “this is broken” to “let’s hire” without checking the systemize or automate branches. A $10K-a-year automation that handles work currently done by a $70K junior is a 7× margin upgrade. A $70K hire to do work that a $10K automation could handle is the opposite.
The same four questions apply to tooling, not just headcount. A reporting layer you build yourself in Looker Studio looks free until you price the maintenance hours against a subscription, which is the entire build versus buy client reporting calculation. Run the numbers with fully loaded hourly cost, not the sticker price of the software.
Budget for the Margin Dip
When you do hire, especially for a senior role, expect 6 to 18 months where the hire compresses your margins before they pay back. Budget for it now. Most agencies underestimate this and panic at month 4.
Framework 8. AI in Agency Operations Without the Hype
Most agency AI content gets this wrong by treating AI as a single thing. There are three distinct categories with very different cost structures and risk profiles.
AI Assistants, Lowest Barrier and Lowest Leverage
Claude or ChatGPT open in a browser tab. Your team uses it for first drafts, research summaries, brainstorming, brief expansion, copy editing. No automation. No integration. Just a smart tab.
When this is enough: most agencies under $1M a year should be here. The productivity gains from teaching your team to prompt well are real, immediate, and need zero engineering investment.
Typical ROI: 5 to 15% time savings on knowledge work tasks. Cost: free to about $20 a seat per month.
AI Workflows, Deterministic Automation With LLM Steps
Zapier, Make, or n8n with an LLM call in the chain. Examples that work in agencies:
- New client signs → automation drafts the welcome email, creates the onboarding project, assigns the first tasks
- End of week → automation pulls last week’s metrics, drafts a client status update, flags anything out of range
- New brief comes in → automation routes it to the right pod, extracts key requirements, creates the kickoff deck shell
When this is right: Stage 3 and beyond, on processes you’ve already documented as SOPs. Hold off on automating undocumented chaos. You’ll just produce automated chaos. The highest-leverage starting point for most shops is report automation for marketing agencies, since reporting is documented, repetitive, and consumes account manager hours that should be going to strategy.
Typical ROI: 30 to 70% time savings on the automated workflow. Cost: roughly $50 to $500 a month per workflow, plus build time.
AI Agents, Goal-Given and Tool-Using
The newest category and the most overhyped. An AI agent doesn’t follow a fixed workflow. It gets a goal, picks its own tools, executes. Think Claude with browser access running a competitive research task, or a custom agent that monitors campaign performance across platforms and proposes optimizations.
When this is right today: narrow, well-bounded tasks where the cost of being wrong is low. Competitive research. Lead enrichment. First-pass campaign analysis. Status update drafting from raw data.
When it’s wrong: anything client-facing without a human in the loop. Strategy. Anything that depends on the proprietary judgment your agency is hired for.
Typical ROI: highly variable. Some agencies report 40 to 60% time savings on specific narrow tasks. Others have burned $20K on agent build-outs that produced nothing usable. The category is real but immature.
Where the AI Money Actually Lives
The highest-ROI uses across agencies that have moved the needle:
- Briefing and intake. Agents that extract structured briefs from messy client emails.
- Internal QA. Pre-delivery checks on deliverables (spelling, brand voice, link validity, brief adherence).
- Reporting and status updates. Drafting first-pass reports and weekly client updates from raw platform data.
- Research and first-pass strategy. Competitive teardowns, audience research, content gap analysis.
- Meeting capture and follow-up. Fathom, Fireflies, Granola. Basically a solved problem now.
The Promethean 2026 data shows 34% of agencies have fully rolled out AI, with another 28% actively doing so. The agencies moving fastest treat AI as an operational discipline (with measurement) rather than a tool acquisition (without).
The AI ROI Ledger
Track these fields for each AI initiative, quarterly:
- Workflow. What process did this address?
- Baseline. Hours and cost before AI.
- Post-AI. Hours and cost after.
- Time saved monetized. Hours × fully loaded cost per hour.
- Tool cost (TCO). Software, integration, maintenance time.
- Net quarterly ROI. (Time saved monetized − TCO) ÷ TCO.
If you can’t fill out the ledger for an AI initiative after 90 days, kill it. Most agencies have 5 to 10 AI tools in their stack that nobody can defend on the math.
A Note on Junior Roles
The temptation to cut junior roles because “AI does that now” is real and mostly wrong. Junior roles are where senior roles come from. Agencies that aggressively cut junior hiring this year are 18 to 24 months from a senior bench problem.
Reframe the junior role instead. Less time on work AI can do. More time on work that builds judgment. Think client exposure, observation, structured mentorship, owning small client relationships end-to-end.
Client Success Starts in the First 90 Days
The sales-to-delivery handoff is the single highest-leverage process at any agency. Get it right and the first 90 days set up a multi-year retention. Get it wrong and you’re playing catch-up for the rest of the engagement. Most agencies underinvest in client onboarding because it doesn’t feel like billable work. It’s the highest-ROI unbilled work you’ll do all year.
A real handoff includes:
- A documented handoff meeting with sales and delivery both present
- All commitments made in the sales process (including verbal ones) written down
- Client goals, KPIs, and how success will be measured, agreed with the client, not for them
- A named delivery lead the client has met before kickoff
- A 30/60/90 day plan with specific milestones, sent to the client in writing
- A first reporting cadence agreed before week one of work
Build this before anything else in this guide if you don’t have it. It’s that high-leverage.
The Quarterly Audit Cadence
Every retainer client should get a real quarterly business review, not a glorified monthly report. The structure:
- Performance vs. goals from the prior quarter. Honest. Misses included.
- Strategic implications of the last quarter’s results. What did we learn?
- Proposed direction for the next quarter. Including any shifts in approach.
- Asks of the client. What we need from them to do better work.
- Health check on the relationship. Open conversation about what’s working and what isn’t.
The conversation in #5 is where you catch churn before it happens. Clients leave when they feel unheard for months, not when something specific goes wrong.
When to Fire a Client
The hardest operational call is firing a client who pays you. Most agencies wait too long. Use this scoring matrix:
Score each of your clients on three dimensions, 1 to 5:
- Profitability. Project margin on this account.
- Operational drag. How much of leadership’s time does this client consume relative to revenue?
- Strategic fit. Does this work build the case studies, capabilities, and references you want?
A client scoring 3 or below on two of three dimensions is a candidate to offboard. A client scoring 1 on any dimension while consuming senior time is actively making you worse at serving the rest of your book.
Fire the bad client and your margins almost always improve. Morale improves too, which improves retention of the team that serves your good clients. The early-warning signs sit inside the client churn KPIs you should be running monthly anyway.
A Retention Benchmark You Can Actually Use
Sakas’s published target is straightforward. Annual client turnover should sit at 10 to 20%. Above 20% and the cause is usually upstream. Poor sales qualification. Weak onboarding. Service-quality issues. New business won’t fix a leaky bucket. The work of improving client retention lives further up the funnel than most agencies want to admit.
Profit-Sharing, the Conversation Most Agencies Skip
Ask your team to build operations with you. To systemize, document, and improve the agency. Do that and you owe them a share of what they build. This isn’t ideology. It’s an alignment mechanism.
Four progressive levels, each appropriate for a different stage:
Level 1. Discretionary bonus pool. A pool announced at year-end based on agency performance. Founder or leadership decides allocations. Simple. Easy to start. Doesn’t create much real alignment because nobody knows how their work translated to their bonus.
Level 2. Formula-based bonus. A defined % of EBITDA above a threshold goes into a pool, distributed by a formula (tenure, role, individual performance score). A common structure is 10 to 20% of EBITDA above a baseline going to a team pool. People can calculate roughly what their bonus will be. Alignment improves materially.
Level 3. Phantom equity. Senior team members get “shares” that pay out on liquidity events (sale, dividend distribution). Not real equity, so no voting and no cap table. Strong retention tool for senior people. Requires real legal setup.
Level 4. Actual equity or ESOP. Real ownership. Real cap table changes. Best for senior hires you want to build the next stage of the agency with. Significant legal, tax, and accounting complexity.
Move up the stack as the agency matures. Most agencies should reach Level 2 by $2M revenue. Level 3 becomes appropriate as you approach $5M+ and start thinking about senior retention. Level 4 is a serious decision usually tied to either succession planning or an explicit exit timeline.
Why Most Profit-Share Plans Fail
Three common failure modes:
- Opaque math. People can’t calculate what they’ll get, so it doesn’t influence behavior.
- No floor. Years with no payout (because the agency had a bad year) erode trust faster than no plan would have.
- Wrong roles included. Profit-share for the team that builds the system is alignment. Profit-share for everyone, including roles that don’t influence margin, is a tax.
The agencies that get this right communicate the formula clearly, run the plan consistently for at least three years, and tie it specifically to the roles that drive the margin they’re sharing.
How to Actually Get Out of Delivery as the Founder
This is the question almost every founder eventually asks. Map yourself to one of four rungs on the involvement ladder:
- Mandatory. You’re doing the work yourself. The agency can’t function without you in delivery.
- Necessary. You’re reviewing or approving most work. Team can produce without you, but quality needs your check.
- Needed. You’re consulted on specific decisions. Team operates independently except on escalations.
- Optional. The agency runs without you in operations. Your role is strategic.
The progression isn’t linear. Most founders move up two rungs, get pulled back when something breaks, and start over. Normal. The point is to know which rung you’re on and what’s blocking the next one.
Three concrete moves that push you up the ladder, starting today:
- Biweekly 30-minute 1:1s with each direct report. Not status updates. Surfacing issues. Drew McLellan at AMI has been beating this drum forever, and it works.
- A weekly leadership meeting with a fixed agenda. Whatever framework you pick. The discipline is the cadence, not the format.
- A documented decision-rights matrix. Who can decide what, up to what dollar amount, without your sign-off. The lack of this matrix is the single biggest reason founders get pulled back into operations.
Do these three things consistently for six months and you’ll move up at least one rung. Do them only when it occurs to you and you won’t move at all.
The Eight Frameworks, Together
Each framework solves a specific operational conversation:
- The Operations Maturity Stack. Diagnose where you actually are vs. where your revenue suggests you should be.
- Pricing That Survives the AI Productivity Curve. Move pricing from inputs toward outputs.
- Team Structure That Matches Your Stage. Pick the structure that fits your size.
- Capacity Benchmarks. Calculate when to hire.
- The Three-Tier Dashboard. Separate metrics each role needs.
- Team-Led SOPs. Build process the team actually follows.
- The HSA Decision Tree. Choose between hiring, systemizing, automating.
- AI in Agency Operations Without the Hype. Measure AI bets honestly.
The mistake is to treat these as eight separate projects. They’re a system. Clear foundations (Stage 1 and 2) tell you what to build. Team structure creates ownership. Team-led SOPs make it sustainable. Capacity planning gives you forward visibility. Leading-indicator dashboards make problems visible before they cost you. Pricing and cost-of-delivery discipline create the margin to invest in everything else. AI done with measurement creates leverage. Profit-share keeps the team that built the system invested in maintaining it.
Miss any one layer and the others lose force. Get them all running and you stop being surprised by your own business.
Your Next Steps
Hold off on rolling out everything at once. Pick four moves and run them in order.
Step 1. Score yourself on the Operations Maturity Stack diagnostic. Be honest. The gap between your revenue stage and your operational stage is your priority list.
Step 2. Run the Parakeeto capacity formula on your team. (Capacity ÷ Utilization Target) × ABR = Revenue Potential. Compare to your current revenue. The gap tells you whether you have a sales problem, a capacity problem, or a pricing problem.
Step 3. Stand up the most basic version of the Tier 1 owner dashboard. Even if it’s a spreadsheet. Cadence is the point, not the tooling.
Step 4. Run the HSA Decision Tree on the single most painful operational problem you’re facing right now. Skip the default of hiring. Skip the default of automating. Pick the lever that actually fits.
That’s the foundation. Everything else in this guide gets easier once those four moves are in motion.
Agency Operations FAQ
Direct answers on the systems, structure, and numbers that turn client work into reliable profit
Agency operations is the set of systems, processes, structure, and metrics that turn client work into reliable profit at scale.
It covers everything between winning the deal and the money landing with the client renewed and the team still functional. Four functions run every agency. Revenue generation, production, support, and leadership. Most owners use the word operations to mean production and support only.
Real operations is the connective tissue between all four, and its job is to move work from sale to delivery to renewal without leaking time, money, or quality at every handoff.
Project management owns the project. Account management owns the client. Operations owns the agency.
Project management handles scope, timeline, deliverables, and internal coordination. Account management handles relationship, retention, expansion, and client communication. Operations builds the systems that make both possible across many clients at once.
At $1M one person can reasonably wear two of these hats. At $3M you will regret combining any of them. At $10M all three are separate functions with their own leads.
Score yourself 0 to 2 on five questions, where 0 is not at all and 2 is yes, reliably.
Could the founder take four unplugged weeks off and the agency still hit its monthly numbers? Do you close the books monthly within 10 days with both cash and accrual views? Is there a documented sales-to-delivery handoff with a named owner? Does every role have a defined capacity and billable target tracked weekly? Is there a person whose primary job is operations, not the founder and not the senior account manager who also does ops?
A score of 0 to 3 means you are operating like a sub-$250K agency, 4 to 6 like a $250K to $1M agency, 7 to 8 like a $1M to $3M agency, and 9 to 10 like a $3M-plus agency. If your revenue says one stage and your score says a lower one, that gap is what is eating your margin right now.
Because it is an operations problem wearing a sales problem’s clothes.
At that ceiling the founder is still in every sales conversation and every quality review, so revenue and founder hours grow at the same rate until the hours run out. Hiring another producer does not help, since it adds delivery capacity to a bottleneck that sits in sales and approval.
The standard advice treats the plateau as a marketing problem and sends owners off to generate more leads. At this stage it almost never is. It is operational capacity, and more leads make the strain worse.
When the founder is the bottleneck blocking the next $1M, and you have the cash to absorb six to eighteen months of margin compression while they ramp. Usually between $1M and $3M in revenue.
Hire someone who has run operations at an agency at least one stage larger than yours. Promoting a junior coordinator into the title is the most common version of this mistake and it costs about a year.
The salary difference between a junior and a real operator is a rounding error next to what the operator fixes in their first year. Budget for the margin dip now so you do not panic at month four and undo the hire.
The cadence matters more than the framework. EOS works well for some agencies and overcomplicates things for others.
Three components work regardless of what you call them. A quarterly planning rhythm, whether you call them Rocks or OKRs. A weekly leadership meeting with a fixed agenda. And a clear accountability chart showing who owns what.
Whether you buy the full rollout with an implementer or assemble your own version from those three pieces matters far less than running the rhythm consistently for two years. Most failed EOS implementations at agencies are abandoned cadences, not bad frameworks.
Target 20% net profit before taxes. The industry average sits around 13%.
Studio agencies under 10 FTE average about 19%. Agencies that narrowed their service mix have posted 30%, against roughly 10% for agencies that broadened. Below 10% you are structurally fragile, meaning one lost client puts payroll at risk.
The number only means anything if you calculate it on AGI and after paying yourself a market-rate salary. Most impressive-sounding agency margins fail one of those two tests.
AGI is Adjusted Gross Income, your revenue minus pass-through costs like media spend, project contractors, and software you bill back to the client.
Bill $200K a month with $80K going straight to Meta and Google and your AGI is $120K. That is the money your agency actually keeps before paying its own people, and every operational benchmark worth using runs on it.
The standard allocation is 55% of AGI to fully loaded delivery salaries, 25% to overhead, and 20% to profit before taxes. The 55 and the 25 can flex against each other. The 20 is the one you never borrow from.
Delivery margin is what remains after the cost of the people doing the work. Net margin is what remains after everything, including overhead.
Three targets matter. Agency-wide delivery margin on your P&L should clear 50%. Project-level delivery margin should clear 60%, because individual projects need to absorb shared delivery costs and slack capacity. Net margin lands wherever overhead leaves it.
The distinction is operational, not academic. Your P&L margin is an average and you cannot act on an average. A 55% agency-wide margin made of projects at 35% and 75% is a completely different problem from one where everything sits at 55%, and only the project view tells you which you have.
Pay yourself the market rate for the job you actually do, then treat profit as a separate line on top.
If you would hire someone at $180K to run the agency the way you run it, that is your salary. Profit is what the business earns after paying that person. An owner drawing $60K and calling the difference a 30% margin is hiding payroll inside profit, and every operational decision made on that number is made on bad data.
It also decides what the agency is worth. Buyers normalize owner compensation to market rate before applying any multiple, so an artificially low salary inflates your margin today and gets corrected the moment anyone runs diligence.
Profit is an accounting result. Cash is a timing problem. They separate when money leaves faster than it arrives.
Three causes account for most of it. Clients pay on net 45 or net 60 while payroll runs every two weeks. Media spend gets fronted on agency cards and reimbursed a month later. And completed work sits unbilled because nobody closed the project out.
The fixes are unglamorous and fast. Bill retainers in advance rather than in arrears, take a deposit on every project, move media spend onto client-owned ad accounts so you stop financing their campaigns, and hold three months of payroll in reserve before taking a distribution.
$150K to $200K per full-time employee, counting the owner.
Below $120K you are structurally underwater. Below $100K is an emergency. At that benchmark, a $1M agency should run on five to seven people, and a $2M agency with 16 people at $125K per head has a pricing or utilization problem rather than a revenue problem.
Check this ratio before every hire, not after every third one. Headcount is the easiest thing to add and the hardest thing to remove.
Fully loaded cost is base salary plus payroll taxes, benefits, software, equipment, and a share of overhead. It typically runs 1.2 to 1.4 times base salary.
Divide that annual figure by the hours the person is actually available to deliver and you get their Average Cost Per Hour. A $100K salary becomes roughly $130K loaded, and across about 1,500 available delivery hours that is around $87 an hour.
Every pricing and staffing decision depends on this number. Scope against base salary instead of loaded cost and you will underprice by about 30% without ever seeing it on a project report.
It depends on the role. Applying one target across the whole team is how agencies burn out producers while under-using leads.
| Role | Weekly billable target |
|---|---|
| Production (designers, developers, copywriters) | 70% to 90% |
| Team leads and project managers | 50% to 75% |
| Strategy and account leadership | 50% to 60% |
| Agency-wide, net annual | 50% to 60% |
Anything held above 85% is a recruiting bill you have not received yet, and replacement cost runs six to nine months of fully loaded salary. Watch realization alongside utilization, since 85% utilization at 70% realization is really a 60% effective rate.
Capacity divided by utilization target, multiplied by average billable rate, equals revenue potential.
Capacity is total available hours across the team for the period. Utilization target is the share of those hours that should be billable. Average billable rate is what you effectively collect per hour, not what your rate card claims.
The answer settles most internal arguments. If the math says $4M and you are delivering $2.4M, you have a sales or pricing problem. If the math says $2.4M and you are delivering $2.4M, the next deal you sign will break your team.
Run four questions in order before you post a job listing.
Is the work judgment-based or deterministic? Judgment work stays human for now, deterministic work skips to the automation branch. Is the bottleneck capacity or process? A broken process does not get fixed by adding a person to it. Will the workload sustain a full-time role? If not, use a contractor or rebalance internally. And for deterministic work, does it run identically every time or does it vary? Identical means full automation. Predictable variation means an automated workflow with an AI step inside it.
The math is why the order matters. A $10K annual automation replacing work done by a $70K junior is a seven-times upgrade. A $70K hire doing work a $10K automation handles is the same trade in reverse.
Not automatically. Pods win on client ownership and retention. Functional departments win on talent development and are easier to run below $3M.
Check the economics before the org chart. A four-person pod costing $410K fully loaded and serving six clients at $8K a month produces $576K and a 29% delivery margin, well short of the 50% you need. Fixing it means higher average retainers, more clients per pod, or a cheaper role mix.
Pods also fail in predictable ways. Load imbalance between pods, no promotion path when each pod holds one person per role, and senior creatives who have no interest in seeing the same three brands every week.
Ten to twenty active clients, unless you run pods successfully, in which case you can carry more.
Fewer than ten is a concentration problem, where one departure triggers layoffs. More than twenty-five is a dilution problem, with small accounts consuming attention their revenue does not justify.
At the account manager level, plan for 8 to 15 clients each depending on contract size. Senior AMs on enterprise accounts carry 3 to 6. AMs running high-volume small accounts can handle 15 to 20 before quality slips.
Keep the capability you sell in-house and use contractors for spike capacity and specialist skills you cannot fill forty hours a week.
Contractors are the right answer for overflow, one-off technical work, and testing a new service line before committing a salary to it. They are the wrong answer for the core work your positioning is built on.
The warning sign is when contractors deliver most of your client work. At that point you are a broker earning broker margins, your quality control lives outside your walls, and you have built very little a buyer would pay for.
Move from pricing inputs toward pricing outputs. Fixed-fee productized offers first, outcome-based pricing second, hourly last.
Hourly billing means every efficiency gain cuts your own revenue, which is untenable while AI compresses the time work takes. Roughly three quarters of agencies still run project-based fees as their primary model, and value-based plus performance-based models combined sit under 5%.
The sequence that works is productize your highest-volume engagement into a named fixed-fee offer, sell it to new clients only, track delivery margin on it, and add a performance component once that offer holds above 70% project margin.
At least 2.5 times your Average Cost Per Hour. Spend no more than 40 cents to earn a dollar of project revenue.
A producer costing $50 an hour fully loaded needs a $125 minimum billable rate. Below that the delivery margin cannot support overhead and profit regardless of how efficient the team is.
Use it as a floor check on fixed-fee work too. Divide the fee by the hours you expect to spend and confirm the effective rate still clears the multiple.
Scope creep is a documentation problem, not a client problem. Clients ask for more because nothing written down says what more costs.
Four mechanisms handle almost all of it. Countable deliverables in the statement of work, so three landing pages rather than landing page support. A stated revision limit with a price attached beyond it. A written change order process that produces a number before work starts. And a budget alert at 80% consumed, which is the one most agencies skip.
The failure mode is rarely one outrageous request. It is fifteen small ones nobody flagged until the project was 130% over budget and too far along to reset.
Raise new client pricing first, then move existing clients at their individual renewal dates rather than all at once.
A 10% to 15% increase at renewal, announced 60 days ahead and paired with a plain summary of results delivered, is accepted more often than owners expect. Raising the whole book on one date turns a series of individual conversations into a single event clients compare notes about.
Accounts that refuse are usually the ones already scoring lowest on profitability and highest on operational drag, which makes the conversation a filter as much as a raise.
Tell them they are paying for the outcome and the expertise behind the decisions, not for the hours. AI changed how fast good work gets produced. It did not change what good looks like.
Then show where the saved time went. Deeper strategy, more creative testing, faster iteration, more frequent optimization. That answer holds only if it is true, and a client can tell within two quarters whether it is.
The conversation is far harder if you bill hourly, because the hourly model already conceded that time is the thing being bought.
Six numbers, reviewed on the same day every week.
AGI over the trailing four weeks against forecast. Net margin for the trailing month. Forward-booked billable hours at four weeks and twelve weeks. Client concentration across your top three accounts. Pipeline value multiplied by probability. And employee sentiment trend.
Forward-booked hours is the one most owners are missing and the one that predicts next quarter. Below 70% booked at four weeks is an immediate sales problem. Below 50% at twelve weeks is a structural pipeline problem. Only about 14% of agencies plan resources more than three months out, which is why so many live in permanent firefighting mode.
No more than 20% to 25% of AGI from any single client.
Past that line the client starts setting your terms. Scope arguments you would win with a normal account become arguments you cannot afford to have, and rate increases stop being negotiable in your favor.
Above 40% from one client you are functionally an outsourced department with none of the job security. Track top-three concentration weekly, not annually.
Client reports show progress and outcomes on a fixed cadence. Internal monitoring runs continuously and alerts someone when a number drifts outside its expected range.
Most agencies build the first and skip the second. That is why a broken Meta connection or an expired Google Ads token gets discovered three weeks later, usually by the client, usually in a meeting.
They need different cadences and different thresholds. A monthly client report is the wrong instrument for catching a data outage on day two, and the internal board that catches it is not something a client should ever see.
Start with the sales-to-delivery handoff. It is the highest-return document at any agency under $3M.
After that, in order, build client onboarding for the first 30 days, a weekly client status template, time tracking standards defining what counts as billable, and a scope-change request process. Five documents cover most of the chaos.
Build them with the team rather than for the team. Take one painful problem, spend thirty minutes documenting how it is handled today, agree on a better version, assign an owner and a review date, then repeat next week. Every SOP needs a named owner and a review date roughly six months out, or the library quietly goes stale and stops being trusted.
Five places carry most of the return. Brief intake from messy client emails, pre-delivery QA checks, first-pass reporting and status updates, research and competitive teardowns, and meeting capture with follow-up.
Match the tool to your stage. Assistants in a browser tab return 5% to 15% time savings for almost no cost and suit most agencies under $1M. Automated workflows with an AI step return 30% to 70% on a specific process, but only on work already documented as an SOP, since automating undocumented chaos produces automated chaos. Agents are real and immature, so keep them on narrow tasks where being wrong is cheap.
Track baseline hours, post-AI hours, monetized time saved, and total tool cost every quarter. If you cannot fill that in after 90 days, cancel the tool.
Score every account 1 to 5 on profitability, operational drag, and strategic fit. Anything scoring 3 or below on two of the three is a candidate.
A client scoring 1 on any dimension while consuming senior time is actively reducing your ability to serve everyone else. Offboarding them usually improves margin and morale in the same quarter.
Watch the aggregate too. Annual client turnover should sit at 10% to 20%. Above 20% the cause is upstream in qualification, onboarding, or delivery quality, and new business will not fix a leaking bucket.
Three habits move founders out faster than anything else, and all three are cadence problems rather than talent problems.
Run biweekly 30-minute one-on-ones with each direct report, focused on surfacing issues rather than reporting status. Hold a weekly leadership meeting with a fixed agenda, where the discipline is the consistency and not the format. And write a decision-rights matrix stating who decides what, up to what dollar amount, without your sign-off.
The missing decision-rights matrix is the single most common reason founders get pulled back in. People escalate because nothing ever told them they were allowed to decide.
See every client’s numbers in one glance, whether you run 5 accounts or 50.
Start Your Free Trial Today