
Marketing agencies face a constant challenge: transforming vast amounts of data into insightful client reports.
With marketers spending an average of 3.55 hours each week on data analysis, efficient reporting tools are crucial. On average, marketers report spending 24% of their data-related time collecting data, 22% analyzing it, 20% visualizing it, 19% cleaning it, and 18% presenting it.
This guide compares seven top client reporting platforms and several business intelligence tools, helping you choose the right solution to streamline your reporting process and showcase your agency’s value.
Explore how these tools can transform your client relationships and drive growth.
| Tool | Visualization | Automation | Integrations | Customization | Starting Price |
|---|---|---|---|---|---|
| Swydo | Comprehensive | Full-featured | 30+ Platforms | Customizable | $69/month |
| AgencyAnalytics | Basic | Flexible | 80+ | Dashboards | $79/month |
| Whatagraph | Basic | Automated | 55+ | Drag-and-Drop | $286 (Free tier available) |
| DashThis | Basic | Limited | 30+ | Templates | $49/month |
| Raven Tools | Basic | Automated | 30+ | Templates | $49/month |
| NinjaCat | Advanced | Real-Time + AI Agents | 150+ | Metrics | Contact |
| TapClicks | Advanced | Flexible + AI | 250+ | Templates | $599/month |
Why Use Client Reporting Software?
Client reporting software is more than just a time-saver; it’s a strategic tool that elevates your agency’s performance. Reporting platforms automate data collection and analysis, freeing your team from tedious manual tasks. The efficiency you gain translates to more time for strategy, creativity, and client communication.
More importantly, these online reporting tools transform raw data into clear, compelling visuals. Instead of sifting through spreadsheets, you and your clients can instantly grasp key performance indicators, identify trends, and understand the impact of your campaigns. Clarity fosters data-driven discussions, leading to more informed decisions and better results.
With so many options available, choosing the right software can be challenging. This guide highlights top 7 client reporting and business intelligence tools, outlining key features and considerations to help you choose the best fit for your agency.
Want to try our client reporting platform finder? Select the amount of clients you have and the monthly budget you would like to spend for your reporting tool for all your clients and viola!
Client Reporting Tool Finder
What Should You Look for in Client Reporting Tools?
When selecting a client reporting tool for your agency, it’s crucial to understand which features will truly make a difference in your day-to-day operations.
Let’s break down the key features and how they compare across the tools we’ve discussed:
1. Data Visualization Features
All the tools mentioned in this article offer essential data visualization options. Here’s a comprehensive comparison:
Compare Data Visualization Features
| Tool | Bar/Column Chart | Line Chart | Pie/Donut Chart | Area Chart | Table/Data Grid | Gauge Chart | Funnel Chart | Map/Geospatial Chart | Single Metric/KPI |
|---|---|---|---|---|---|---|---|---|---|
| Swydo | ✓ | ✓ | ✓ | ✓ | ✓ | ✗ | ✗ | ✓ | ✓ |
| AgencyAnalytics | ✓ | ✓ | ✓ | ✗ | ✓ | ✓ | ✗ | ✓ | ✓ |
| Whatagraph | ✓ | ✓ | ✓ | ✓ | ✓ | ✗ | ✓ | ✗ | ✓ |
| DashThis | ✓ | ✓ | ✓ | ✗ | ✓ | ✓ | ✗ | ✗ | ✓ |
| Raven Tools | ✓ | ✓ | ✓ | ✗ | ✓ | ✗ | ✗ | ✗ | ✓ |
| NinjaCat | ✓ | ✓ | ✓ | ✓ | ✓ | ✗ | ✗ | ✓ | ✓ |
| TapClicks | ✓ | ✓ | ✓ | ✗ | ✓ | ✓ | ✓ | ✗ | ✓ |
Key Insight: Swydo offers the most comprehensive range of visualization options, including advanced features like treemaps and heat maps. If your reporting needs diverse visualization types, Swydo or TapClicks might be your best bet.
2. Automation & Scheduling
All tools mentioned offer automation and scheduling features, but they differ in sophistication and specific capabilities. Here’s a detailed breakdown:
Feature Comparison Across Tools
| Feature | Swydo | AgencyAnalytics | Whatagraph | DashThis | Raven Tools | NinjaCat | TapClicks |
|---|---|---|---|---|---|---|---|
| Automated report generation | ✓ | ✓ | ✓ | ✓ | ✓ | ✓ | ✓ |
| Customizable scheduling | Daily, Weekly, Monthly, Custom, Time, Timezone | Daily, Weekly, Monthly, Custom | Daily, Weekly, Monthly | Daily, Weekly, Monthly | Daily, Weekly, Monthly | Daily, Weekly, Monthly, Custom | Daily, Weekly, Monthly, Custom |
| Real-time data updates | ✓ | ✓ | ✓ | ✓ | Partial | ✓ | ✓ |
| Automated alerts | ✓ | ✗ | ✗ | ✗ | ✗ | ✓ | ✓ |
| Goal tracking | ✓ | ✓ | ✗ | ✗ | ✗ | ✓ | ✓ |
| Multi-client scheduling | ✓ | ✓ | ✓ | ✓ | ✓ | ✓ | ✓ |
| Automated email distribution | ✓ | ✓ | ✓ | ✓ | ✓ | ✓ | ✓ |
| Shareable link distribution | ✓ | ✓ | ✓ | ✓ | ✓ | ✓ | ✓ |
| Budget monitoring | ✗ | ✗ | ✗ | ✗ | ✗ | ✓ | ✓ |
Key Insight: While all tools offer robust automation and scheduling features, Swydo, NinjaCat, and TapClicks stand out with their comprehensive offerings. Swydo provides a strong balance of features including automated alerts, goal tracking, and flexible scheduling, making it suitable for agencies of various sizes. NinjaCat and TapClicks offer additional advanced features like budget monitoring, which may be beneficial for larger agencies or those managing substantial ad spends.
When choosing a tool, consider your specific needs:
- For comprehensive automation with alerts and goal tracking, Swydo offers a strong, well-rounded solution.
- If budget monitoring is crucial, NinjaCat or TapClicks might be more suitable.
- For agencies prioritizing ease of use alongside solid automation features, AgencyAnalytics could be a good fit.
- If your needs are more basic, Whatagraph or DashThis might suffice.
It’s crucial to evaluate these automation and scheduling capabilities in the context of each tool’s overall feature set and your agency’s specific requirements. The ideal choice will align with your workflow, client needs, and growth plans.
3. Data Integration Sources
The number and variety of data integration sources can significantly impact your reporting capabilities. However, it’s not just about quantity – the quality, depth, and relevance of these integrations are equally important.
| Tool | Number of Integrations | Key Integrations | Custom Data Import |
|---|---|---|---|
| Swydo | 30+ | Google Ads, Analytics, Facebook Ads, Instagram, LinkedIn | Yes (via Google Sheets) |
| AgencyAnalytics | 80+ | Google suite, social media, SEO tools, call tracking | Yes (via Google Sheets, API) |
| Whatagraph | 50+ | Marketing platforms, social media, ecommerce | Yes (via Google Sheets) |
| DashThis | 30+ | Digital marketing platforms, Google Analytics, social media | Yes (via Google Sheets, API) |
| Raven Tools | 30+ | SEO tools, Google suite, social media | Yes (via API) |
| NinjaCat | 150+ | Advertising platforms, analytics, call tracking, CRM | Yes (via API) |
| TapClicks | 6000+ | Extensive range across marketing, advertising, and analytics | Yes (via API, CSV) |
Key Insights:
- Quality over Quantity: TapClicks boasts a vast array of integrations, but for many agencies, the 30-80 integrations offered by tools like Swydo prove more than sufficient. Swydo focuses on providing robust integrations with essential data sources, ensuring comprehensive coverage of all key metrics for reporting. This depth and quality of integration can be a significant advantage.
- Specialization Matters: Some tools specialize in certain areas. For instance, Raven Tools has a strong focus on SEO integrations, while NinjaCat offers extensive coverage of call tracking and CRM tools.
- Custom Data Flexibility: All tools offer some form of custom data import, either through CSV files, API access, or both. Swydo’s Google Sheets integration offers a unique, user-friendly approach to custom data importing.
- Future-Proofing: Consider not just the platforms you use now, but those you might adopt in the future. Tools with more integrations or easy custom data import options offer more flexibility as your agency grows and evolves.
- Client Needs: The best choice depends on your clients’ tech stack. If you work with many local businesses, call tracking integrations might be crucial. For ecommerce clients, platforms with strong ecommerce integrations like Whatagraph might be more suitable.
When evaluating data integration capabilities, consider:
- The specific platforms your clients currently use
- Potential platforms you might need in the future
- The depth of data available from each integration
- The ease of setting up and maintaining these integrations
- The flexibility for adding custom data sources
Ultimately, the goal is not just to have access to data, but to easily transform that data into meaningful insights for your clients. The ideal tool will offer a balance of comprehensive integrations and user-friendly data management features, aligning with your agency’s current needs and future growth plans.
4. Customization and Templating
Client reporting tools offer a range of features to streamline the reporting process and create branded, tailored reports. Here’s what you can typically expect:
- White-labeling: Brand reports with your logo, colors, and design aesthetic.
- Drag-and-drop Interfaces: Easily arrange and customize report elements without advanced technical skills.
- Customizable Metrics and KPIs: Track and report on any client KPI, whether it’s automatically pulled from integrated platforms, calculated from existing data, or manually entered KPIs for custom insights.
- Pre-built and Reusable Templates: Use and modify template libraries, or create and save your own for consistency across clients.
- PPC Markup: Factor in management fees when reporting on ad spend and ROI (available in platforms like Swydo, NinjaCat and AgencyAnalytics).
- Advanced Calculations and Data Insights: Derive complex insights from your data, though capabilities may vary between tools.
Key differentiators often include:
- Depth of customization
- User interface intuitiveness
- Range of integrations
- Sophistication of data analysis capabilities
Some platforms may excel in specific areas such as extensive template libraries, flexible custom metric creation, or advanced data visualization options.
5. Collaboration Features
Collaboration capabilities can greatly enhance your team’s efficiency and improve client relationships.
Here’s a detailed comparison of collaboration features across the different platforms:
Feature and Role Management Comparison
| Feature | Swydo | AgencyAnalytics | Whatagraph | DashThis | Raven Tools | NinjaCat | TapClicks |
|---|---|---|---|---|---|---|---|
| Team role assignments | ✓ | ✓ | ✓ | ✓ | ✓ | ✓ | ✓ |
| Task assignment | ✗ | ✓ | ✗ | ✗ | ✓ | ✓ | ✓ |
| KPI Progress monitoring | ✓ | ✓ | ✗ | ✗ | ✓ | ✓ | ✓ |
| Report sharing (email/URL/PDF) | ✓ | ✓ | ✓ | ✓ | ✓ | ✓ | ✓ |
| White-labeling | ✓ | ✓ | ✓ | ✓ | ✓ | ✓ | ✓ |
| Client portal | ✓ | ✓ | ✗ | ✗ | ✓ | ✓ | ✓ |
Key Insights:
- Team Collaboration: All platforms offer some level of team collaboration through role assignments. However, AgencyAnalytics, Raven Tools, NinjaCat, and TapClicks go a step further by offering task assignment and progress monitoring features, which can be crucial for larger agencies or complex projects.
- Client Communication: Most platforms (except Whatagraph and DashThis) offer client portals, providing a seamless way for clients to access their reports. This feature can significantly enhance client relationships and transparency.
- Customization and Branding: All platforms offer white-labeling options, allowing agencies to maintain their brand identity in client-facing reports. The extent of customization may vary, with NinjaCat and TapClicks offering particularly extensive options.
- Scalability: Platforms like AgencyAnalytics, NinjaCat, and TapClicks offer more advanced collaboration features, which may be beneficial for larger agencies or those planning for significant growth.
When evaluating collaboration features, consider:
- The size of your team and how complex your workflows are
- How much direct access you want to give clients to their reports
- The importance of branding and customization in your client relationships
- Your need for custom integrations or advanced automation
The ideal tool will offer collaboration features that streamline your internal processes, enhance client communication, and scale with your agency’s growth. While all these platforms offer solid collaboration capabilities, the best choice will depend on your specific team structure, client relationships, and future plans.
7 Dedicated Client Reporting Platforms for Your Agency
Now that we’ve covered what to look for, let’s dive into seven client reporting tools specifically designed for marketing agencies. We’ll focus on how each can address your unique needs:
1. Swydo
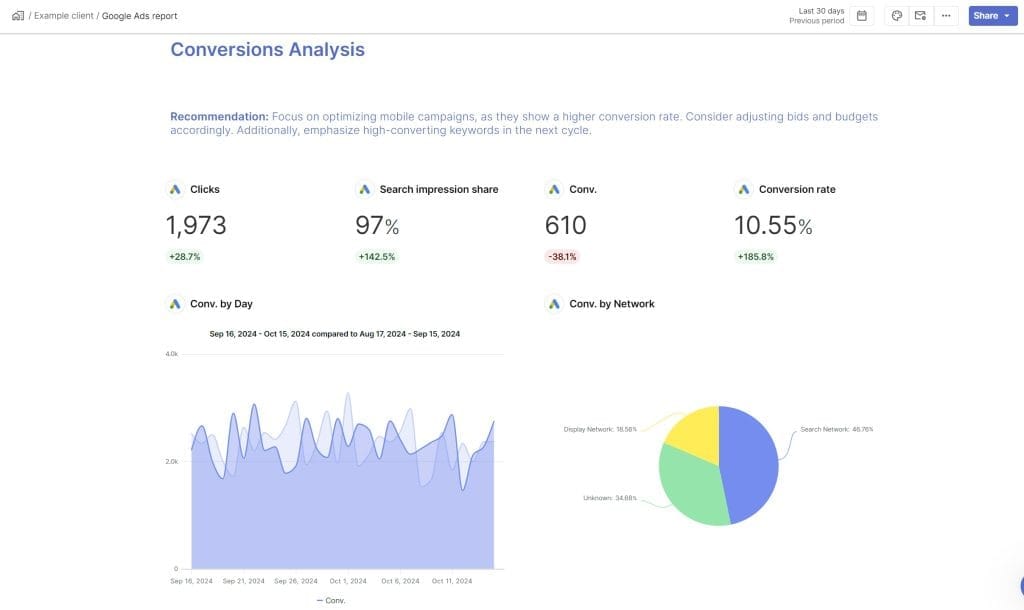
While we may be biased, our product truly speaks for itself. Swydo positions itself as a comprehensive client reporting tool catering to agencies of all sizes. Its standout feature is the balance between a user-friendly interface and advanced customization options. This makes it particularly valuable for agencies that want to create professional, tailored reports without investing extensive time in design and data compilation. Swydo’s real-time KPI tracking with monitoring and alerts, along with its wide range of visualization options, make it suitable for agencies looking to offer in-depth, customized reporting to their clients.
Swydo Best for: Agencies of all sizes looking for an all-in-one reporting solution with strong customization options.
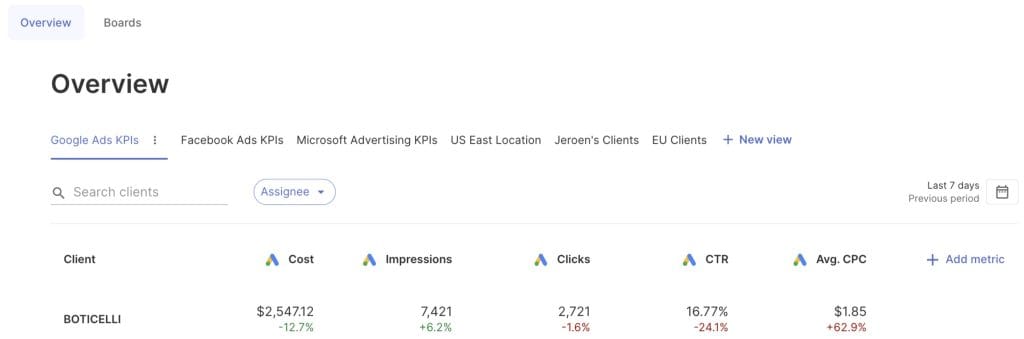
Key differentiator: A key differentiator is real-time monitoring and alerts for KPI tracking, combined with highly customizable metrics and layouts for reports and dashboards. This provides an all-in-one client monitoring overview, allowing you to see essential KPIs for all your clients in a single dashboard.
Key features:
- Over 30+ integrations
- Pre-built dynamic reporting templates
- Combined Data Sources feature (May 2025): Merge metrics from up to 5 ad platforms into single widgets
- Goal tracking feature with real-time alerts based on set metrics
- Branded templates for customized reports with logos, colors, and other brand elements
- Client overview dashboards
- AI-powered report summaries
- Customizable visual widgets including heatmaps, scatter plots, and bubble maps
- Live data integration from ad platforms and organic analytics tools
- Team collaboration features with role assignments (editor, admin, collaborator)
- Multi-language support for report creation (14 languages)
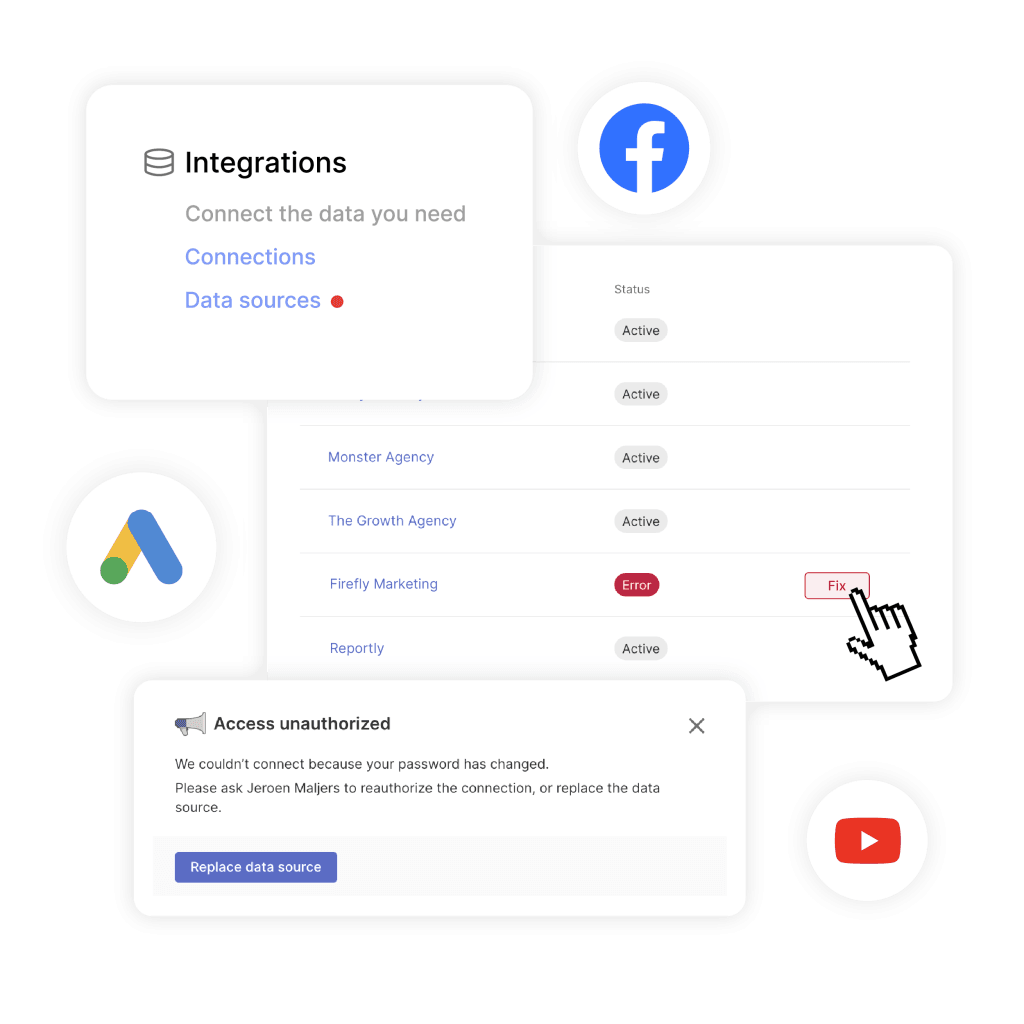
- Automated data source health check alerts
Pros:
- Highly customizable metrics and layouts for reports and dashboards
- Flexible pre-built templates for streamlined reporting
- Instant monitoring with real-time campaign insights
- Ability to manually add any KPIs when an integration is lacking
- Offers a wide array of visualization choices, incorporating sophisticated features like heatmaps and scatter plots
- Proactive alerts when data connections break—before reports go out
- Most cost-effective option for high-volume data sources
Cons:
- Fewer integrations when compared to competitors
- Currently lacks scatter plot visualizations
- Some users have reported occasional lag with embedded reports
Pricing:
- First 10 data sources included in initial monthly base fee: $69/month (unlimited clients)
- 11-100 data sources: $4.50 per data source
- 101-500 data sources: $3.00 per data source
- 501+ data sources: $2.00 per data source
What’s a data source?
- You might have a connection to Google Analytics (counting as one connection).
- Within that Google Analytics connection, you could have multiple website properties (each counting as a separate data source).
For example:
- You connect Google Analytics (one connection)
- You have three client websites tracked in Google Analytics (three data sources)
Swydo stands out for its balance of comprehensive features and user-friendly interface. It’s particularly well-suited for agencies that want to offer customized, professional reports without spending hours on design and data compilation. The pricing structure actually incentivizes large-scale deployments ($2.00/source at volume), making it financially superior for large agencies managing thousands of simple accounts.
2. AgencyAnalytics
AgencyAnalytics positions itself as a versatile reporting solution for small and medium-sized agencies managing multiple clients across various digital marketing channels. Its standout feature is its extensive integration capabilities, with over 80 connections to popular marketing platforms, making it particularly valuable for agencies that need to report on a wide range of marketing activities, from PPC and SEO to social media and e-commerce.
Read AgencyAnalytics vs Swydo comparison
Best for: medium-sized to premier agencies managing multiple clients across diverse digital marketing channels, especially those needing to consolidate data from numerous platforms.
Key differentiator: Extensive integration options (80+) covering a wide range of marketing platforms, allowing for comprehensive multi-channel reporting and real-time campaign insights through customizable dashboards.
Key features:
- Access to over 80+ integrations
- Automated report scheduling
- Custom dashboards for tracking client data
- Task assignment and progress monitoring for team collaboration
- Ask AI Co-Pilot for conversational data queries
- AI Summary with tone customization
- 11-second Smart Dashboards for rapid setup
- Benchmarking Reports to compare against industry averages
- Roll-up Reports and Dashboards
- Forecasting and Anomaly Detection (Pro+ plans)
Pros:
- Extensive integration options covering most PPC, SEO, and e-commerce platforms
- Real-time campaign insights from monitoring dashboards
- Smart reports to quickly create reports using specific integrations
- AI-powered data analysis
Cons:
- Considered expensive compared to some alternatives
- Occasional issues with integrations and widget failures
- Lacks some advanced visualization options like treemaps, heat maps, and scatter plots.
Pricing:
- Freelancer: $79/month (or $59/month annual) for 5 clients
- Agency: $239/month (or $179/month annual) for 10 clients
- Agency Pro: $479/month (or $349/month annual) for 15 clients
- Additional clients: $20/month each
- Enterprise: Custom pricing for large agencies
Not that majority of the features are not available in the Freelancer and Agency plans.
AgencyAnalytics shines in its reporting capabilities, making it a strong choice for agencies with a heavy focus on search engine optimization strategies.
3. Whatagraph

Whatagraph distinguishes itself as a solution for collecting and unifying data from over 50 integrations across various marketing channels. Its key strength lies in its ability to monitor and data joining, making it particularly well-suited for agencies dealing with complex, multi-channel marketing campaigns. Whatagraph’s intuitive drag-and-drop interface and large library of dashboard templates make it an attractive option for agencies wanting to quickly produce professional-looking reports without a steep learning curve.
Read our Whatagraph vs Swydo article
Whatagraph Best for: Small and mid-sized agencies with complex reporting needs across multiple marketing channels.
Key differentiator: Ability to save data on Google BigQuery for advanced analysis.
Key features:
- Connect 55+ sources
- Add data via API or spreadsheets
- Unify metrics across reports with the “Organize” feature
- Cross-channel data monitoring
- Currency conversion for reports
- No-code data transfer to BigQuery
- AI-powered insights with Whatagraph IQ+
- Dedicated Customer Success Manager on all paid plans
Pros:
- Intuitive drag-and-drop interface
- Large library of dashboard templates and widgets
- Interactive reports with automatic updates
- Provides a funnel chart option, which is less common among the tools.
Cons:
- Some users find it costly compared to alternatives
- Occasional performance lags when creating reports
- Limited data integrations compared to some competitors
- Customization features may not be as flexible as some users desire
- Does not offer geospatial/map charts or gauge charts
Pricing:
- Basic: $286/month (billed monthly) or $229/month (billed annually)
- Boost: $724/month (billed monthly) or 579/month (billed annually)
- Max: Custom pricing
Note: All paid plans include unlimited users, reports, and workspaces. Pricing is credit-based where credits are used to connect data sources, send data to warehouses, and blend cross-channel data.
Whatagraph’s strength lies in its intuitive interface and wide range of pre-built templates, making it a good choice for agencies that want to quickly produce professional-looking reports without having to invest a lot of time in learning the software.
4. Dashthis
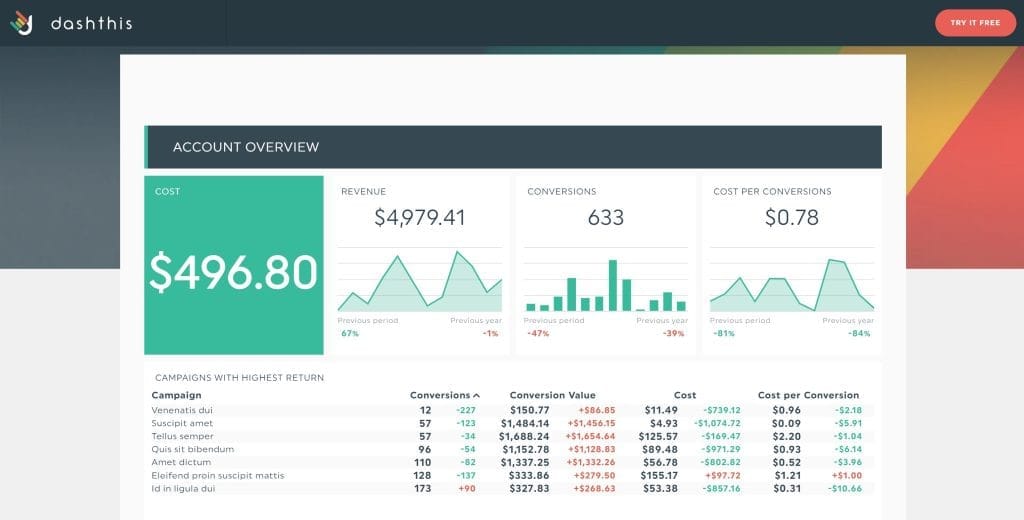
DashThis positions itself as a simple, streamlined reporting platform ideal for agencies looking for a straightforward solution. Its standout features include the ability to connect with over 30 marketing platforms, add third-party data via CSV, and create unlimited client accounts across all plans. This makes DashThis particularly appealing to small-sized agencies with basic reporting needs or those prioritizing ease of use over advanced features and customization options.
Read our DashThis vs Swydo comparison article
DashThis Best for: Small-sized agencies with basic reporting needs looking for a straightforward, easy-to-use solution.
Key differentiator: Simplicity and ease of use, with a focus on creating unlimited client accounts across all plans.
Key features:
- Connect 30+ marketing platforms
- Add third-party data using a CSV file
- 8 widget types and reusable templates
- Share dashboards via email, URL, or PDF
Pros:
- Aggregate, manage, visualize, and create reports on one dashboard
- All plans allow you to create unlimited client accounts
- Simple, easy-to-use user interface
- Offers a gauge chart option, which some competitors lack
- 15-day free trial to test the features
Cons:
- Limited integrations compared to some alternatives
- Pricing may be high for small-sized agencies
- Has a more limited range of visualization types compared to some competitors.
- Some users find better alternatives with cheaper pricing
Pricing:
- Individual: $49/month ($42/month annual) for 3 dashboards
- Professional: $159/month ($135/month annual) for 10 dashboards
- Business: $309/month ($264/month annual) for 25 dashboards
- Standard: $479/month ($409/month annual) for 50 dashboards
- AI Insights PRO Add-On: $19/month per account (includes chat mode and custom dashboard context)
DashThis is a good fit for agencies that prioritize simplicity and ease of use over advanced features and customization options.
5. Raven Tools
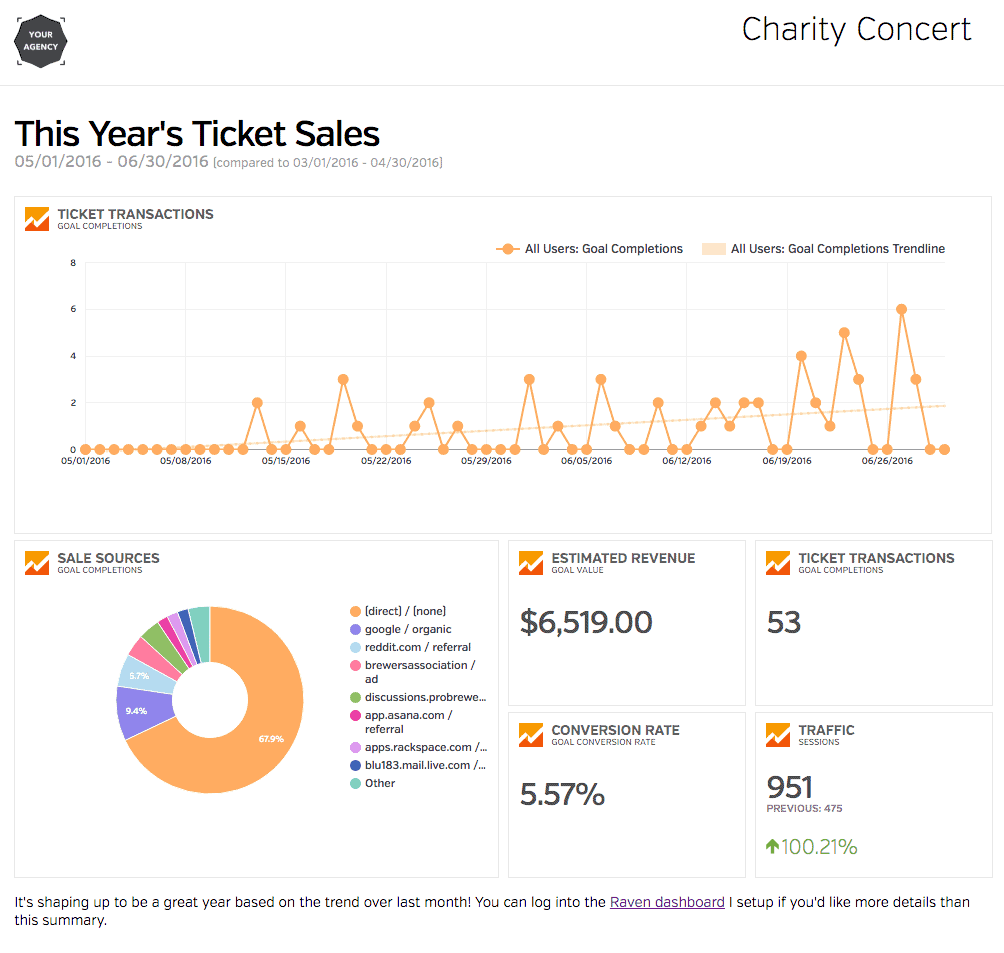
Raven Tools sets itself apart as an all-in-one SEO and marketing reporting platform. Its unique selling point is the combination of extensive SEO analytics features alongside reporting capabilities. This makes it especially valuable for SEO-focused agencies that need both in-depth SEO analysis tools (like SERP rank tracker and backlink checker) and client reporting capabilities in one platform. Raven Tools’ ability to run live website audits and create reusable report templates adds to its appeal for SEO-centric agencies.
Raven Tools Best for: SEO firms looking for a tool with both reporting and SEO analytics features.
Key differentiator: Combines SEO and reporting in one platform, ideal for SEO-focused agencies.
Key features:
- Connect up to 30 data platforms
- Access to SEO tools like SERP rank tracker, competitor domain research, backlink checker
- Run live audits on websites
- Create and reuse templates
Pros:
- Combination of SEO and client reporting features for agencies
- Focuses on essential chart types (bar, line, pie) which aligns with its SEO-centric approach
- Easy to set up and use
- Integrates seamlessly with popular marketing tools
Cons:
- Has the most limited range of visualization options among the compared tools.
- User interface could be improved according to some users
- Pricing plans may be costly for the features offered compared to some alternatives
Pricing:
- Small Biz: $49/month ($39/month annual) for 2 domains/campaigns
- Start: $109/month ($79/month annual) for 20 domains
- Grow: $199/month ($139/month annual) for 80 domains
- Thrive: $299/month ($249/month annual) for 160 domains
- Lead: $479/month ($399/month annual) for 320 domains
Raven Tools is particularly well-suited for agencies that specialize in SEO and want a tool that combines in-depth SEO analysis with client reporting capabilities.
6. NinjaCat
NinjaCat positions itself as an end-to-end digital marketing performance management platform, targeting agencies specializing in multi-location businesses or complex data management. Its standout feature is the use of AI Copilot and Natural Language Processing for cleaning and analyzing data, generating valuable insights, reports, and visualizations. With over 150 data connectors and the ability to incorporate agency markups into calculated metrics, NinjaCat is particularly suited for larger agencies or those requiring advanced data analysis and customization options.
NinjaCat Best for: Agencies servicing multi-location businesses or those dealing with complex data sets.
Key differentiator: Uses AI Copilot and NLP for data cleansing and analysis, generating valuable insights, reports, and visualizations.
Key features:
- Up to 150 data connectors
- Smart dashboards with real-time alerts
- Budget monitoring with alerts
- API access for custom integrations
- Ability to incorporate agency markups into calculated metrics
Pros:
- Allows direct connection with business intelligence tools like Tableau and Looker Studio
- API access enables custom integrations
- Provides scatter plot functionality, which is less common among the tools.
- Incorporates agency markups into calculated metrics for accurate profitability tracking
Cons:
- Data loading issues
- Pricing may be costly for smaller agencies
- Lacks gauge charts and funnel charts.
- Steeper learning curve than some other tools due to advanced features
Pricing: Not publicly displayed; schedule a demo for a quote.
NinjaCat is a powerful choice for larger agencies or those dealing with complex, multi-location clients who require advanced data analysis and customization options.
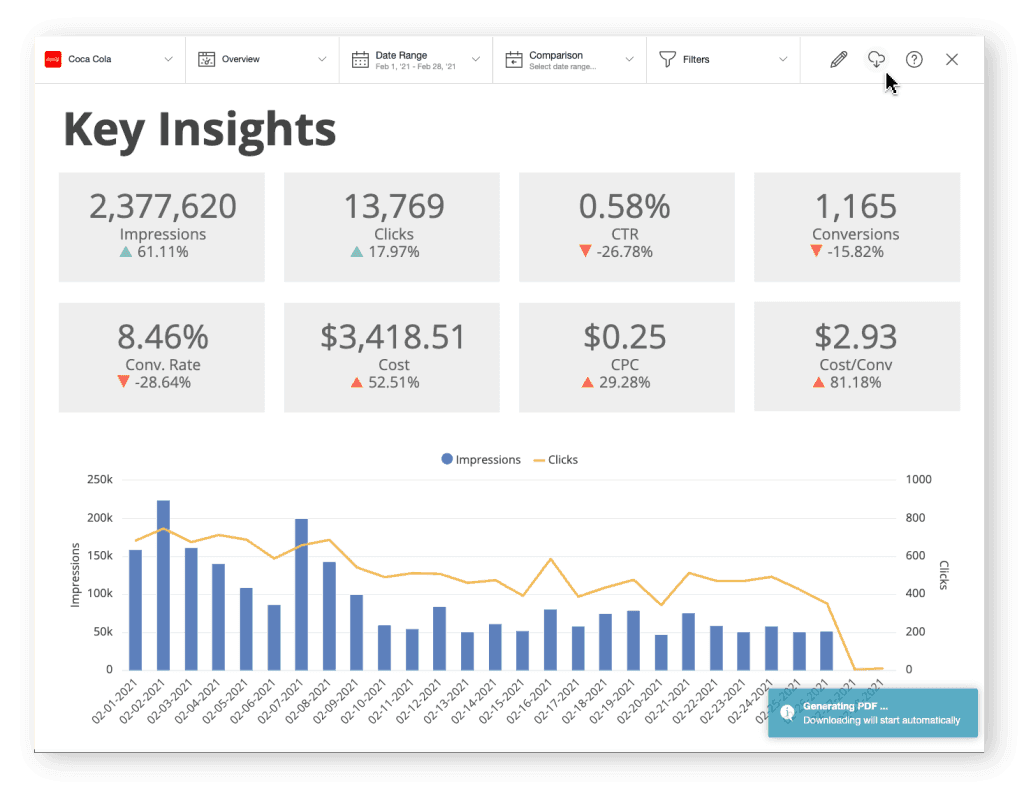
7. TapClicks
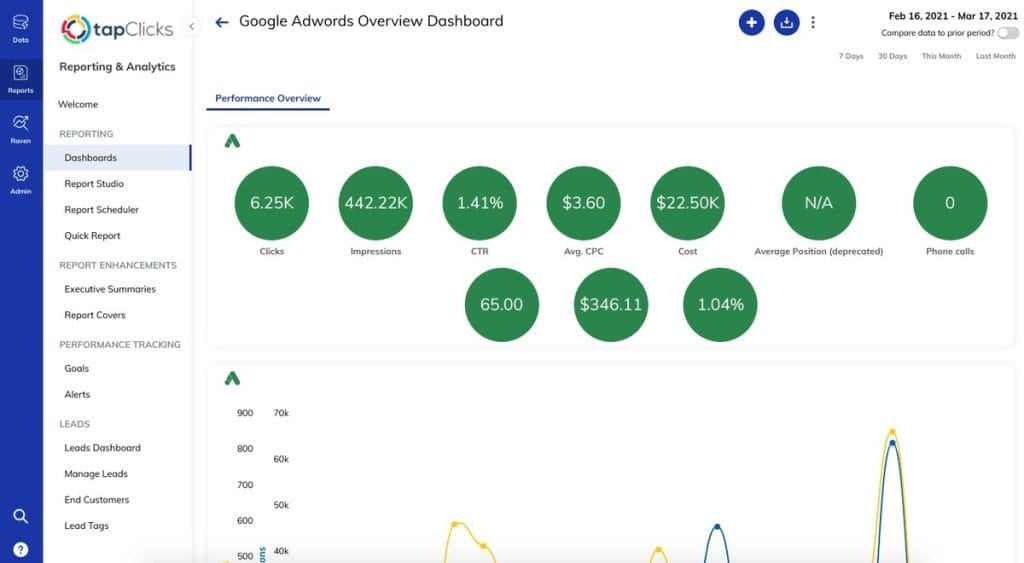
TapClicks offers a comprehensive solution for large-scale data management and analysis, positioning itself as an enterprise-level platform. Its key differentiator is the vast array of data integrations, connecting with over 6000 data sources. This makes it particularly valuable for large agencies or those serving enterprise clients with extensive data management and competitive analysis needs. TapClicks’ advanced features like in-depth marketing analysis capabilities and access to iSpionage for PPC and SEO competitor analysis set it apart for agencies requiring robust, all-encompassing reporting and analytics solutions.
TapClicks Best for: Large agencies serving enterprise clients with huge volumes of data.
Key differentiator: All-in-one platform for holistic data management, including access to iSpionage for competitor PPC and SEO analysis.
Key features:
- Connects with over 6000 data sources
- TapAnalytics for in-depth marketing analysis
- Visual, customizable, automated reports
- Automated report scheduling
- Advanced calculations for data insights
Pros:
- Customizable report templates
- Ability to monitor, filter, and verify metrics
- Wide range of visualization options
- Offers a combo chart option, which is unique among the compared tools
Cons:
- Pricing may be higher than some alternatives, especially for smaller agencies
- Some users find the interface dated or clunky
- Does not provide area charts or geospatial/map charts.
- May have a steeper learning curve due to extensive features
Pricing:
- TapDataLite: $99/month
- TapData+: $349/month with over 250 data sources
- TapData Max: $649/month with all features
TapClicks is particularly well-suited for large agencies or those dealing with enterprise clients who require extensive data management and competitive analysis capabilities.
Client Reporting Tool Pricing Comparison
This full price comparison table will help you understand each client reporting platform and its pricing structure.
| Tool | Starting Price | Data Sources Included | Client Capacity | Key Pricing Details |
|---|---|---|---|---|
| Swydo | $69/month | 10 Included | Unlimited Clients | Additional: $4.50 (11-100), $3.00 (101-500), $2.00 (501+) per source |
| AgencyAnalytics | $79/month | 80+ Integrations | Up to 5 Clients | Agency: $239/mo for 10 clients; Additional clients $20/mo |
| Whatagraph | Free tier available; Paid ~$680/month annual | 55+ Integrations | Unlimited | Credit-based; Enterprise starts ~$7,500/year |
| DashThis | $49/month | 34+ Integrations | Unlimited Clients | Per-dashboard pricing; Professional $159/mo for 10 dashboards |
| Raven Tools | $49/month | 30+ Integrations | 2 Domains | Start: $109/mo for 20 domains; up to 30% annual discount |
| NinjaCat | Contact for Quote | 150+ Integrations | Variable | Enterprise pricing, typically $1,500+/month |
| TapClicks | $599+/month | 250+ Sources | Up to 10 Clients | Requires Data + Destination plans; full setup $1,500-2,000+/month |
General Reporting Platforms
While the dedicated client reporting tools we’ve discussed are designed specifically for marketing agencies, some agencies may find themselves needing more robust, versatile solutions. This is where general business intelligence (BI) and data visualization platforms come into play. These tools offer more advanced analytics capabilities and can integrate data from a wider range of sources, including both marketing and non-marketing data.
Why consider a general reporting platform?
- Advanced analytics: These platforms often provide more sophisticated data analysis tools, including predictive analytics and machine learning capabilities.
- Data versatility: They can handle larger and more diverse datasets, allowing you to integrate marketing data with financial, operational, or other business data for a more comprehensive view.
- Customization and scalability: General BI tools typically offer more flexibility in creating custom visualizations and reports, and can scale with your agency as it grows or diversifies its services.
- Cross-industry insights: As these tools are used across various industries, they may offer features or perspectives that spark innovative approaches to your clients’ challenges.
- Client expectations: Some clients, particularly larger enterprises, may prefer or require reports from recognized BI tools they’re already familiar with.
However, these advantages come with trade-offs. General BI platforms often have a steeper learning curve, may require more technical expertise to set up and maintain, and can be more expensive than specialized agency reporting tools. They might also lack some of the marketing-specific features and integrations found in dedicated agency tools.
When to consider a general reporting platform:
- Your agency is growing rapidly and needs a more scalable solution
- You’re dealing with clients who have complex, multi-faceted data needs
- You want to offer more advanced data analysis services to differentiate your agency
- You’re expanding beyond traditional marketing services and need to incorporate diverse data sources
Here are some popular general reporting platforms that marketing agencies might consider:
Looker Studio (formerly Google Data Studio)
Looker Studio is a free business intelligence reporting software that has gained popularity among marketers and agencies for its robust capabilities and integration with Google’s ecosystem.
Read Looker Studio vs Swydo comparison article
Use cases: Best for agencies heavily invested in Google’s ecosystem, needing to create interactive reports that combine data from multiple Google services and basic third-party integrations.
Key differentiator: Free tool with deep integration into Google’s ecosystem, offering an accessible entry point for data visualization and reporting.
Key features:
- Integration with Google Cloud and BigQuery for advanced data analysis
- Looker’s ability to blend data from multiple sources for cross-platform insights
- Real-time collaboration with simultaneous report editing
- Interactive reports with filters and data exploration capabilities
- Real-time campaign and KPI monitoring
Pros:
- 20+ built-in connectors & 1000+ partner connectors
- Data blending available (but limited on free plan)
- Free to use, making it accessible for agencies of all sizes
- Drag-and-drop editor for ease of use
- Rich visualization elements for comprehensive, data-driven reports
- Seamless integration with Google’s marketing tools
Cons:
- Can be complex to use for more advanced reporting needs (e.g. blended data)
- Some functionalities are basic compared to paid alternatives
- Additional integrations may incur extra costs (i.e. 3rd party data connection services)
- Users report occasional lagging issues on larger projects
- Data connections drop frequently, often at the end of the month
- No or limited customer support on the free plan
- Complex pricing options
Pricing: Free, with department-level BI and Google Cloud support starting at $9/month for one user and project.
Looker Studio is an excellent choice for agencies that are deeply integrated with Google’s marketing ecosystem and are looking for a cost-effective solution for creating interactive, visually appealing reports.
Tableau
Tableau is a powerful business intelligence tool known for its robust visualization and reporting capabilities. It’s particularly well-suited for agencies dealing with large volumes of complex data.
Use cases: Best for agencies dealing with complex, large-scale data sets and requiring advanced data exploration and visualization capabilities.
Key differentiator: Powerful data visualization capabilities with a wide range of customization options, complemented by robust data processing abilities for handling very large datasets.
Key features:
- VizQL technology translates actions into charts and graphs without coding
- Integrates with multiple data sources
- AI-powered Explain Data tool for performance insights
- Real-time data analysis from live sources
- Customizable role-based permissions for team collaboration
- Advanced analytics for predictive modeling and trend analysis
Pros:
- Supports exports in various file types (spreadsheets, PDFs, data cubes)
- Advanced analytics tools for predictive modeling and clustering
- Handles large datasets with no row or size limitations
- Provides interactive report dashboards
- Works well with a wide range of databases and platforms, including Google services, R, Python, Einstein Discovery and MATLAB
Cons:
- Higher price point compared to some alternatives, which may be challenging for smaller agencies
- Requires significant IT knowledge to fully leverage its capabilities (extensive training and active community available)
- The extensive feature set can be overwhelming for new users
- Lack of integration with Microsoft products may be a drawback for some agencies
Pricing:
- Viewer: $15/user/month (standard) or $35/user/month (enterprise) – annual billing
- Explorer: $42/user/month (standard) or $70/user/month (enterprise) – annual billing
- Creator: $75/user/month (standard) or $115/user/month (enterprise) – annual billing
- Tableau+ bundle with AI features: Custom pricing
Tableau is an excellent choice for agencies dealing with large, complex datasets and requiring advanced analytics capabilities. Its powerful visualization tools can help you present data in compelling ways, but the learning curve and price point may be prohibitive for smaller agencies or those with simpler reporting needs.
PowerBI
PowerBI, Microsoft’s entry in the business intelligence space, offers a robust platform for data visualization and reporting. Its integration with other Microsoft products makes it a popular choice for agencies already invested in the Microsoft ecosystem.
Use cases: Best for agencies already using Microsoft products, requiring deep integration with Excel and other Microsoft tools, and needing both cloud-based and on-premises deployment options.
Key differentiator: Seamless integration with Microsoft’s ecosystem (e.g. Excel, Azure, and Teams), offering a balance of powerful analytics and user-friendly interfaces, with strong AI-powered insights.
Key features:
- Powerful data visualization with diverse chart options
- AI and ML tools for predictive analysis
- Company-wide data access and collaboration
- Integrates with business tools and CRM systems
- Ability to analyze large datasets with pre-calculated queries
- Custom visualizations using R and Python
- Real-time data with Automatic Data Refresh
Pros:
- Free version available (with cost-effective Pro & Premium plans)
- Free version includes custom visualizations, real-time data analysis, and integration with R and Python
- User-friendly drag-and-drop interface
- Seamless integration with all Microsoft 365 apps
- Enables faster and more accurate data analysis
- Relatively affordable pricing for small and medium-sized agencies
- Strong AI capabilities for predictive analytics
Cons:
- Can be complex to use for non-technical users (features like DAX formulas and custom visualizations may overwhelm new users)
- Many advanced features are only available in paid plans
- Limited to Windows operating system, which may be an issue for agencies using Macs
- Some users report performance issues when analyzing very large databases
- Confusing pricing tiers for some users, especially when scaling up to Premium features
Pricing:
- Power BI Free: $0 (limited features)
- Power BI Pro: $14/user/month (up from $9.99)
- Power BI Premium Per User: $24/user/month (up from $20)
- Power BI Premium Per Capacity: Starting at $4,995/month
PowerBI is a strong contender for agencies deeply embedded in the Microsoft ecosystem. Its AI capabilities and integration with other Microsoft tools can provide powerful insights, but the Windows-only limitation and learning curve may be drawbacks for some agencies.
Klipfolio
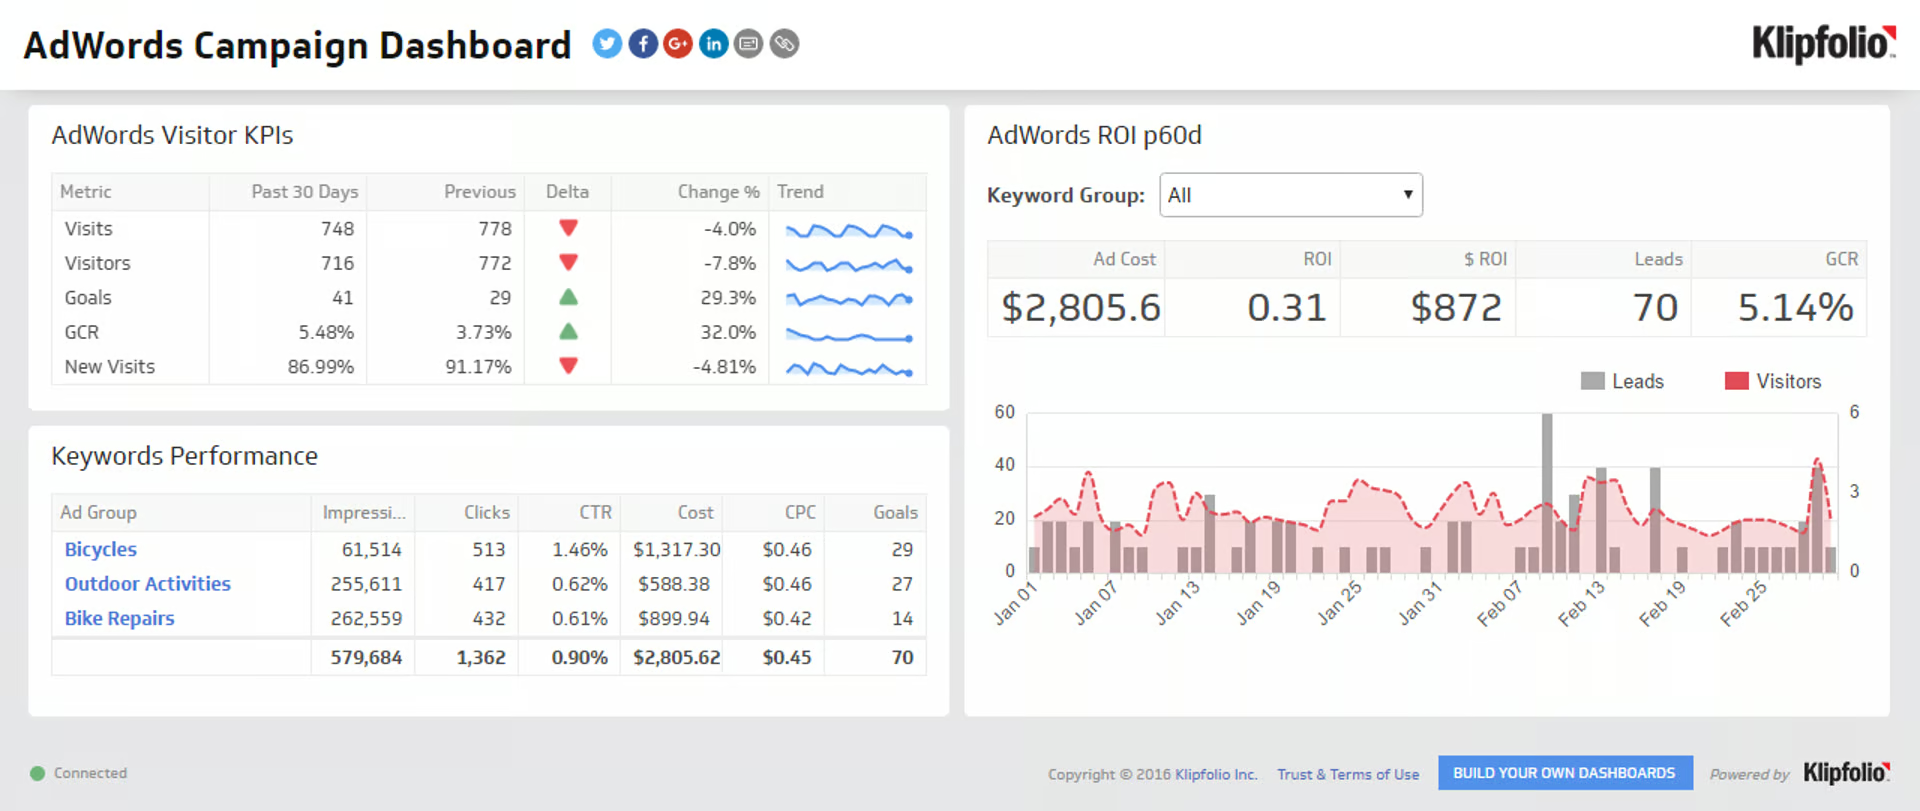
Klipfolio stands out for its extensive customization options and real-time data monitoring capabilities, making it a versatile choice for agencies of various sizes.
Use cases: Best for small to medium-sized agencies looking for a cloud-based solution with real-time data monitoring and a balance of pre-built and customizable reporting options.
Key differentiator: Offers a unique blend of pre-built metrics (called Klips) and the ability to create custom metrics, with a focus on real-time data monitoring and mobile accessibility.
Key features:
- 100+ pre-built connectors for data integration
- PowerMetrics AI tool for instant data insights
- Customizable report templates and pre-built dashboards
- Automated reporting with PDF exports and shared links
- Extensive library of formulas, functions, and filters for dashboard customization
Pros:
- Easy setup with no coding required for basic use
- Cloud-based, allowing access to data anytime, anywhere
- Affordable and scalable pricing plans
- Ability to control data access with password-protected links
- Wide variety of dashboard templates for quick setup
Cons:
- Some users report confusion between Klips and PowerMetrics features
- Complex customization (such as creating highly specific metrics or using advanced formulas) can present a steep learning curve
- Pre-built templates have limited modification options
- Advanced customization may require technical skills
- Working with large datasets might encounter issues with latency and refresh times
Pricing:
- Grow: $199/month (10 users, 20 dashboards)
- Team: $499/month (20 users, 50 dashboards)
- Business: $999/month (30 users, 100 dashboards)
- Enterprise: Custom Pricing (Unlimited users, unlimited dashboards)
Klipfolio is an excellent choice for agencies that prioritize customization and real-time data monitoring. Its scalable pricing model makes it accessible to agencies of various sizes, though some technical skills may be needed to fully leverage its customization capabilities.
Geckoboard
Geckoboard focuses on real-time data visualization, making it ideal for agencies that need to keep a constant pulse on their clients’ performance metrics.
Use cases: Best for agencies that need to create and display real-time KPI dashboards, especially those wanting to showcase live data on office displays or share with clients.
Key differentiator: Specializes in creating visually appealing, real-time dashboards optimized for display on large screens and various devices, with a focus on simplicity and immediate data comprehension.
Key features:
- Real-time dashboards for KPI tracking
- 90+ integrations
- Automated report scheduling for regular snapshots
- Data connections via Zapier or API
- TV dashboard optimization for large screens
- Pre-built widgets for quick dashboard creation
- Interactive View for in-depth metric analysis
Pros:
- Allows users to track KPIs and metrics in real-time
- Flexible customization options
- Pre-built widgets and templates for custom dashboards
- Optimized for display on large screens, perfect for agency war rooms
Cons:
- Data sources are limited on the basic plan
- Data refresh rates can be slower than expected
- Premium features are locked in higher plans
- No support for ad hoc reporting
- Features may be basic compared to some competitors
- Limited advanced customizations (e.g. changing colors or deep data exploration)
Pricing:
- Essential: $49/month for 1 dashboard (up to 5)
- Pro: $199/month for 5 dashboards
- Scale: $699/month for 30 dashboards
Geckoboard is an excellent choice for agencies that prioritize real-time data visualization and need to create impressive dashboard displays for client meetings or agency offices.
Databox
Databox positions itself as an easy-to-use, cloud-based analytics platform that centralizes data from various sources, making it a good all-in-one solution for agencies.
Use cases: Best for small to medium-sized agencies seeking an all-in-one solution for data aggregation, goal tracking, and performance monitoring across multiple platforms.
Key differentiator: Offers a user-friendly interface with strong mobile optimization, automated insights, and a unique scorecarding feature for tracking performance against goals.
Key features:
- Time-based goals with real-time notifications
- Benchmark performance against previous periods
- 70+ integrations
- Centralized custom dashboards for data
- Instant goal tracking for ad campaigns
- Team collaboration on shared goals
Pros:
- Intuitive user interface suitable for users with no coding experience
- Drag-and-drop functionality and visual appeal
- Compatible with different devices, including TVs, Apple watches, and mobile phones
- Free plan available for small agencies or those just starting out
Cons:
- Limited to 3 data sources on most plans, with extra costing $6/month
- AI-powered tools are only available on paid plans
- Some users find the customization options limited compared to more advanced platforms
- Learning curve when it comes to setting up custom metrics or working with more complex datasets
- Pricing gets steep for agencies needing unlimited data sources or advanced features
Pricing:
- Professional: $199/month ($159/month annual) – 3 data sources included
- Growth: $499/month ($399/month annual) – includes AI insights, advanced filtering
- Premium: $999/month ($799/month annual) – full enterprise features
- Additional data sources: $7/month each ($5.60 annual)
Databox is a solid choice for agencies looking for an easy-to-use, all-in-one solution for data aggregation and reporting. Its free plan and intuitive interface make it accessible for small agencies or those just starting with data-driven reporting. However, agencies that require more advanced analytics or larger data source capacity may find the pricing or features restrictive.
How to Choose Between Specialized and General Reporting Tools
When deciding between a specialized client reporting tool and a more general business intelligence platform, consider the following:
| Factor | Specialized Reporting Tools | General Business Intelligence (BI) Tools |
|---|---|---|
| Complexity of reporting needs | Suitable for standard marketing metrics (e.g., campaign performance, conversion rates, basic website analytics) | Better for complex, multi-dimensional analysis (e.g., multi-channel attribution, customer lifetime value analysis, predictive modeling) |
| Technical expertise required | More user-friendly; often offer drag-and-drop interfaces, pre-built dashboards, and no-code integrations (e.g., Whatagraph, DashThis) | May require more technical know-how; understanding of SQL, databases (e.g., Snowflake, Google BigQuery), and data transformation processes |
| Client expectations | Ideal for clients expecting fast, digestible reports (e.g., campaign performance, engagement tracking) | Better for advanced clients expecting in-depth analysis, predictive insights, real-time reporting, or financial forecasting |
| Budget considerations | Generally more affordable; often offer tiered pricing models | Can be a significant investment; typically billed by user or capacity, with additional costs for training and implementation |
| Data source integration | Good for focusing on specific areas (e.g., marketing, sales, customer support metrics) | Better for integrating data from multiple sources and departments (e.g., marketing, finance, HR, operations) |
| Growth and scalability | May suffice for current needs but could limit future expansion | More suitable for agencies planning to offer comprehensive data analysis services in the future |
| Examples | Whatagraph, DashThis, Swydo, AgencyAnalytics | Power BI, Tableau, Geckoboard |
Key Considerations:
- Evaluate current needs and future growth plans.
- Consider the technical skills of your team.
- Assess the complexity of your clients’ reporting requirements.
- Review your budget and potential return on investment.
- Examine the variety and complexity of data sources you need to integrate.
- Look for tools that allow easy upgrades or integrations to avoid future disruptions.
No single tool fits every agency. Evaluate your needs and explore a mix of specialized and general platforms to find the perfect solution for your reporting and analysis requirements.
Types of Agency Reporting Tools
When considering reporting tools, it’s crucial to understand the two main categories:
Specialized Client Reporting Tools
These tools are purpose-built for agencies to create client reports. They excel at pulling data from various marketing sources based on pre-set metrics or KPIs. Their primary focus is on presenting historical data in a visual, standardized format that demonstrates the impact of marketing campaigns.
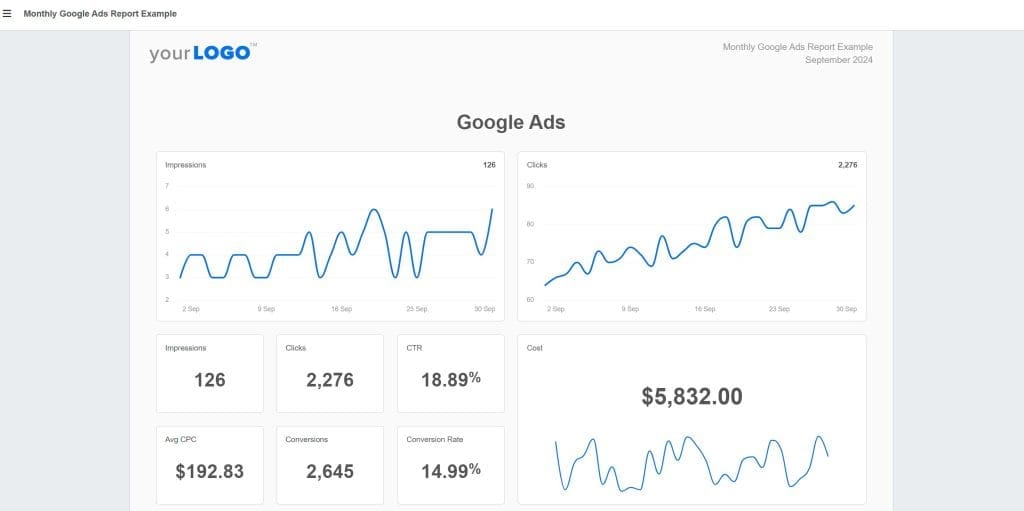
For instance, a specialized client reporting tool might automatically generate a monthly performance report showcasing key metrics like CPC (cost-per-click), conversion rates, and ROI. These tools are designed to answer specific questions like “What was the ROAS (return on ad spend) from the last ad campaign?” or “How many visitors signed up from the ad?”
Key characteristics of specialized client reporting tools:
- User-friendly interfaces designed with agency workflows in mind
- High degree of customization and flexibility in report creation
- Automation features that significantly reduce manual reporting time
- Present data in digestible formats, making it easy for clients to understand
- Often provide real-time access to marketing data
- Usually integrate well with common marketing platforms
However, these tools may have limitations in handling complex, multi-dimensional data analysis or integrating with non-marketing data sources.
Business Intelligence (BI) Tools
While these tools can be used for client reporting, they offer a more versatile and comprehensive approach to data analysis. As discussed earlier, BI tools provide advanced analytics capabilities, handle larger and more diverse datasets, and offer more flexibility in creating custom visualizations.
The key difference is that BI tools are not restricted to pre-set metrics or data sources, instead providing a holistic view of data across an organization. They excel at uncovering trends, patterns, and relationships within data, and can often provide predictive insights.
When choosing between specialized and general reporting tools, consider your agency’s specific needs, technical expertise, client expectations, budget, and growth plans. Many agencies find that a combination of specialized reporting tools and more general BI platforms provides the best of both worlds, allowing them to create quick, focused marketing reports while also having the capability to perform deeper data analysis when needed.
What Are Client Reporting Requirements?
Client reporting is essential for a strong agency-client relationship. Think of it as a progress update, a way to open a dialogue with your client. It’s an opportunity to showcase your expertise, build trust, and solidify your partnership. A compelling report doesn’t just show numbers; it demonstrates a deep understanding of their business and a commitment to their success.
Show the value you deliver and offer insights that drive strategic decisions. A well-crafted report translates your work into tangible results. It goes beyond vanity metrics and focuses on the KPIs that truly matter to your clients — increased leads, higher conversion rates, stronger brand awareness. Contextualize the data and explain the “why” behind the numbers. This allows clients to make informed decisions that propel their business forward.
To create reports that resonate, you need to follow these client reporting best practices:
Communicate with clarity
Use straightforward language that everyone can understand. Avoid technical jargon and present data in a digestible format, using visuals to highlight key takeaways. Focus on the metrics that directly impact your client’s business goals and show how your work contributes to their success.
Personalize your reports
Every client is unique, with their own set of goals, challenges, and communication preferences. Tailor your reports to their specific needs, demonstrating that you understand their business and are invested in their individual success. A marketing manager might want detailed campaign information, while a CEO might prefer a high-level overview of ROI and key performance indicators. Adapt the level of detail and the narrative accordingly.
Provide real-time access
Clients want to see what’s happening now. Real-time dashboards give them immediate access to campaign performance, promoting transparency and enabling quick decision-making.
Deliver reports promptly
Send reports ahead of schedule to demonstrate your proactive approach and respect for your client’s time. This allows them to digest the information, formulate questions, and have more productive discussions.
Offer actionable advice
Don’t just present data; provide context and explain what it means for their business. Offer clear, actionable recommendations for improvement, positioning yourself as a strategic advisor who guides them towards success.
Design visually appealing reports
Use charts, graphs, and other visuals to make complex data easily understandable and engaging. Maintain a clean, professional design that reflects your agency’s brand identity and builds trust with your clients.
Tell a story with your data
Structure your report with a clear narrative that outlines their goals, showcases progress, and highlights key achievements. Use benchmarks and historical data to provide context and demonstrate the impact of your work.
Why Should Agencies Automate Their Reports?
For digital marketers, every minute counts and efficiency is paramount. Automating client reports frees up valuable time and resources, allowing your agency to focus on strategy, creativity, and building strong client relationships.
Here’s how automation can transform your workflow:
- Reclaim valuable time. Instead of manually gathering and compiling data, let automation handle the heavy lifting. This frees you and your team to focus on high-value activities like developing creative campaigns, refining strategies, and nurturing client relationships.
- Minimize errors. Automated systems reduce the risk of human error associated with manual data entry and calculations, ensuring accurate and consistent reports that build your agency’s credibility.
- Build trust through transparency. Automated reports provide clients with a clear, unbiased view of performance, fostering trust and open communication. When clients have access to real-time data and understand how you measure success, it strengthens your partnership.
- Stay agile with real-time monitoring. Keep a constant pulse on campaign performance with automated reporting tools that offer real-time dashboards. This allows you to quickly identify trends, spot potential issues, and make data-driven adjustments to keep your clients ahead of the curve.
- Scale your agency efficiently. As your client base grows, manual reporting becomes unsustainable. Automation allows you to manage a larger volume of reports without sacrificing quality or efficiency, enabling you to scale your agency effectively.
- Reinforce your brand with consistency. Automated reports ensure that all your client communications adhere to the same structure, include essential metrics, and reflect your brand guidelines, reinforcing your professionalism and building a sense of reliability.
- Shift from reporting to advising. By automating data collection and report generation, you free up time to focus on analysis, extract meaningful insights, and provide proactive advice to your clients, strengthening your relationships and driving better results.
How to Choose the Right Tool for Your Needs
With the myriad of reporting tools available, choosing the right one for your agency can feel overwhelming. Here’s a checklist to help you evaluate and select the best tool for your needs:
Here’s a table layout that highlights each feature category, with a brief question or description to guide the reader’s assessment. You could further customize it by adding columns for specific tools if you’re reviewing multiple options.
| Feature Category | Key Considerations |
|---|---|
| Budget and Pricing | – Is the tool cost-effective for your agency’s size? – How does pricing scale with more clients/data sources? – Any hidden fees for additional features? |
| Reporting Complexity | – Does it provide simple and complex reporting options? – Can it create visually appealing reports? |
| Integration Capabilities | – Does it integrate with platforms your clients use? – How easy is it to add new integrations? – Can it import data from sources not directly integrated? |
| Ease of Use | – Is the user interface intuitive? – What’s the learning curve for your team? – Are templates/drag-and-drop features available? |
| Customization Options | – Can reports be branded with logos and colors? – How flexible are reporting templates? – Can custom metrics be created? |
| Data Visualization | – What types of charts/graphs are offered? – Can visualizations be easily customized? – Are interactive dashboards available? |
| Automation Features | – Can reports be scheduled for auto-generation/sending? – Does it offer real-time updates? – Are alerts for key metric changes available? |
| Collaboration Features | – Can reports be shared with clients and team members? – Are user roles and permissions adjustable? – Can clients interact with reports/dashboards? |
| Technical Support | – What level of support is provided? – Are there comprehensive resources (help docs, tutorials, videos)? – Is there an active user community? |
| Scalability | – Will it grow with your agency? – Is it easy to add new clients/data sources? – Are there limits on the number of reports you can create? |
The best tool matches your agency’s needs, how you work, and your plans for the future. Try free trials or demos to see how different tools work for your team.
FAQs for Client Reporting Software
To wrap up, let’s address some common questions about marketing agency reporting software:
Key Takeaway
Client reporting forms the backbone of successful agency-client relationships. It showcases your value, builds trust, and drives strategic decisions. Implement these best practices to transform your reporting from a routine task into a powerful tool for client retention and agency growth.
At Swydo, we’ve designed a comprehensive, user-friendly platform specifically for marketing agencies like yours. Our solution helps you:
- Create stunning, customizable reports in minutes
- Integrate data from 34+ marketing platforms
- Automate report generation and distribution
- Offer real-time dashboards for instant client access
- Scale your reporting process effortlessly as your agency grows
Join 2,500+ marketing agencies already using Swydo to impress their clients and streamline their reporting process.
Accelerate your client reporting with our 14-day free trial – no credit card required. Experience how Swydo helps you create reports that wow your clients, save you time, and drive your agency’s success.
Work smarter with Swydo’s tools to turn data into actionable insights, strengthen client relationships, and propel your agency to new heights. Make every report count!
Client Reporting Software FAQ
Quick answers to help you choose the right reporting solution for your agency
Client reporting software automatically pulls data from marketing platforms like Google Ads, Facebook, and Analytics to create branded reports for your clients. It eliminates manual data collection and transforms spreadsheets into professional visual reports.
Yes, if you spend more than 2 hours per week creating client reports manually. The average marketer spends 3.55 hours weekly on data analysis. Reporting software typically reduces this by up to 75% while improving report quality and client satisfaction.
Reporting software automatically updates with real-time data, creates professional visuals, and eliminates manual errors. Spreadsheets require manual data entry, break easily, and look unprofessional. Reporting software also offers client portals and automated scheduling.
Most agencies see immediate time savings within the first week. Full ROI typically occurs within 30-60 days through increased efficiency, reduced errors, and improved client retention. Setup takes 1-3 days for basic implementation.
Yes. Most reporting tools integrate with 30-80+ marketing platforms including Google Ads, Facebook, LinkedIn, Analytics, and CRM systems. You can also import data from tools without direct integrations using CSV uploads or API connections.
The best tool depends on your needs. Swydo offers the best balance of features and ease-of-use for most agencies. AgencyAnalytics works well for SEO-focused agencies. TapClicks suits large agencies with complex data needs. DashThis is good for simple reporting requirements.
Use specialized tools (Swydo, AgencyAnalytics) for standard marketing reporting. They’re easier to use and designed for agencies. Consider BI platforms (Tableau, Power BI) only if you need advanced analytics, predictive modeling, or complex data analysis beyond marketing metrics.
Most agencies need 10-20 core integrations. Focus on platforms you actively use: Google Ads, Facebook Ads, Google Analytics, LinkedIn, and industry-specific tools. Having 1000+ integrations doesn’t matter if the ones you need aren’t reliable or well-maintained.
Most tools allow custom data import via CSV upload, Google Sheets integration, or API connections. You can also request new integrations from the vendor. Choose tools with flexible data import options to future-proof your reporting capabilities.
Google Data Studio (now Looker Studio) works for basic needs but lacks automation, white-labeling, and agency-specific features. It requires technical skills and manual template creation. Paid tools save 10+ hours weekly and provide professional client experiences that justify higher pricing.
Essential features include automated data collection, scheduled report delivery, white-labeling, drag-and-drop report building, real-time dashboards, and mobile access. Advanced features like automated alerts, goal tracking, and client portals significantly improve efficiency.
Reputable reporting tools use enterprise-grade security including SSL encryption, SOC 2 compliance, and secure OAuth connections. Your data never passes through insecure channels. Always verify security certifications and read privacy policies before choosing a platform.
Yes, most tools offer client portals where clients can view real-time dashboards 24/7. This improves transparency and reduces “where’s my report?” emails. You control what data clients can see and can maintain your branding throughout their experience.
Quality tools like Swydo proactively alert you when integrations fail before reports go out. Look for platforms with automatic error detection, backup data sources, and quick support response. Always verify data accuracy during your first month of use.
Yes, you can create different templates for various client types (ecommerce, B2B, local businesses). Most tools offer drag-and-drop customization, custom metrics, and the ability to show/hide specific data based on client needs and sophistication levels.
Most modern reporting tools are mobile-responsive, allowing you and your clients to view reports on smartphones and tablets. Some offer dedicated mobile apps. Mobile access is crucial for busy executives who want to check performance on-the-go.
Basic tools start at $49/month (DashThis, Raven Tools). Swydo starts at $69/month. Mid-tier options cost $79-239/month (AgencyAnalytics). Enterprise solutions range $599-1,500+/month (TapClicks, NinjaCat). Calculate ROI by comparing monthly cost to time saved (typically 10-20 hours weekly).
Watch for charges per data source, per client, per user seat, premium integrations, white-labeling fees, and setup costs. Some tools charge $4.50-20+ monthly for each additional data source or client. Always clarify total costs for your specific needs before committing.
Calculate time saved (hours per week) × hourly rate × 4.3 weeks = monthly value. Example: 15 hours saved weekly × $50/hour × 4.3 = $3,225 monthly value. Compare this to software cost. Most agencies see 300-500% ROI within 6 months.
Basic setup takes 2-4 hours for connecting data sources and creating first reports. Full implementation with templates, automation, and team training typically requires 1-2 weeks. User-friendly tools like Swydo can have you productive within hours.
Specialized agency tools require minimal technical skills. Most use drag-and-drop interfaces and pre-built templates. General BI platforms (Tableau, Power BI) require more technical knowledge. Choose agency-specific tools if your team lacks technical expertise.
Most tools offer 14-30 day free trials. Use trials to test with real client data, evaluate ease of use, verify integrations work properly, and assess support quality. Always test with actual data rather than demo accounts for accurate evaluation.
Most tools allow data export via CSV or API. You’ll need to recreate templates and reconnect integrations. Migration typically takes 1-2 weeks depending on complexity. Choose tools with good export capabilities and avoid long-term contracts initially.
Upgrade your client reporting with Swydo’s comprehensive solution tailored for marketing agencies.
Start Your Free Trial