
Client reporting is how agencies document, analyze, and communicate marketing performance to clients through structured reports that tie campaign results to business outcomes. The agencies that treat reporting as a strategic tool instead of a chore retain more clients, charge higher retainers, and become harder to replace.
Most agencies get this wrong, though. They think reporting is about what they did. Your clients don’t care about that. They care about what it means for their business and what happens next.
Retainer-based agencies lose roughly 18% of their clients each year, according to a 2026 Focus Digital analysis. Project-based agencies lose closer to 42%. If your average client pays $5,000 a month, one lost client costs you $60,000 in annual revenue. And according to Harvard Business Review, acquiring a new customer is anywhere from five to 25 times more expensive than keeping an existing one.
The Real Cost of Client Churn
Adjust the sliders to see how churn impacts your agency’s annual revenue — and what better reporting retention could save you.
20
$5,000
25%
Annual Revenue Lost to Churn
$300,000
5 clients lost × $60,000/yr each
Saved With 5% Better Retention
$60,000
1 additional client retained per year
Replacement cost assumes acquiring a new client is 5× more expensive than retaining an existing one (Harvard Business Review). A 5% retention improvement can increase profits 25–95% (Bain & Company).
So the math is simple. Better reporting leads to better retention. Better retention leads to a more profitable agency.
This guide breaks down what actually works in client reporting right now. Not theory. Not what might work in a few years. What the best agencies are doing today to keep clients engaged, informed, and loyal.
What Your Clients Actually Expect From Reports Right Now
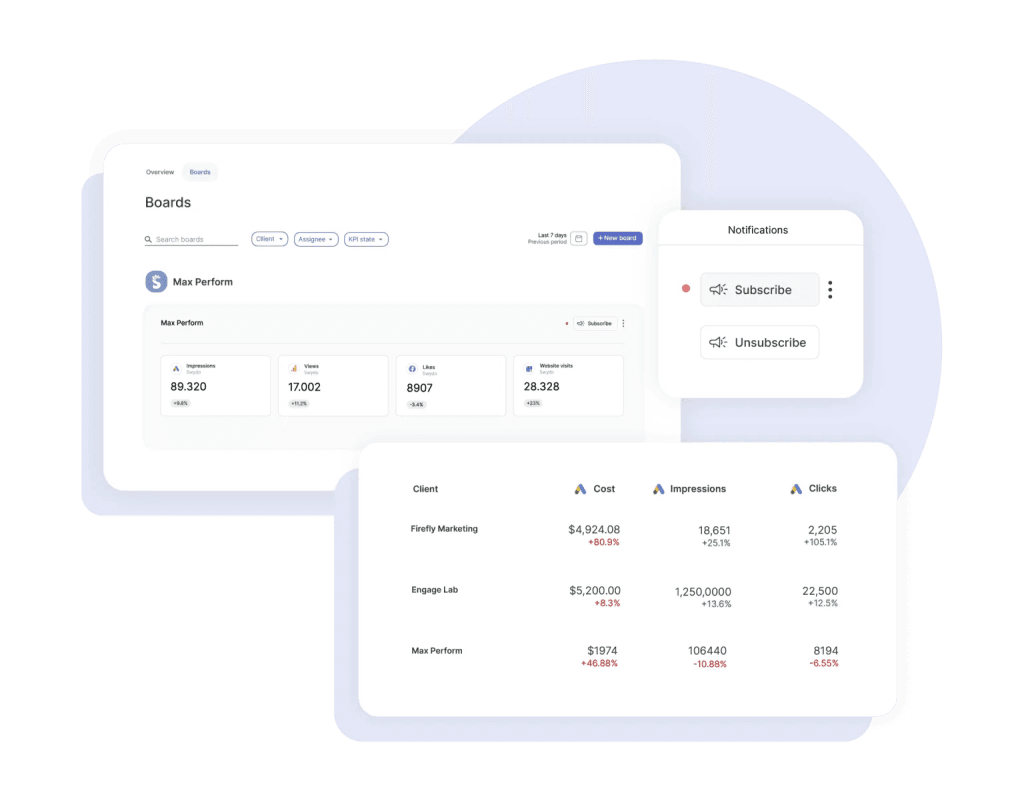
Your clients are more data-literate than they were even two years ago. Many of them log into Google Analytics 4, check their Meta Ads Manager, and glance at Looker Studio dashboards on their own. They can see raw data without you.
So what do they need from your report that they can’t get themselves?
Three things. Interpretation of what the data means in the context of their specific business. Strategic recommendations they wouldn’t arrive at alone. And honest assessment of what works and what doesn’t.
Think about how your clients react when they receive your report. Do they forward it to their leadership team? Do they come to your next call with questions and ideas based on what they read? Or does it sit unopened in their inbox?
If you’re not sure, that’s a problem worth solving before you worry about anything else.
The biggest shift in 2026 is that AI-powered tools have changed what “good” looks like. Agencies that use AI-assisted reporting deliver insights faster, catch anomalies before clients notice them, and spend less time on formatting so they can spend more time on strategy. If you still manually pull data from five platforms and build slides from scratch, you’re up against agencies that automated that work months ago.
Reporting Is Your Best Retention Tool
The Reporting Maturity Ladder
Where does your agency fall? Each stage builds on the last. The further you climb, the harder you are to replace — and the more you can charge.
Stage 1
Data Dump
Screenshots from ad platforms and analytics tools pasted into a doc. No context, no narrative, no recommendations. The client has to figure out what it means on their own.
Stage 2
Structured Reporting
Organized by channel with consistent formatting and some written commentary. Better, but still agency-centered — focuses on what you did, not what it means for their business.
Stage 3
Insight-Led Reporting
Every metric ties to a business objective. Reports open with an executive summary, include competitive context, and close with specific recommendations. AI handles data assembly so your team focuses on strategy.
Stage 4
Strategic Partnership
Reporting is continuous, not monthly. AI monitors performance in real-time and flags anomalies before the client sees them. Reports are customized per stakeholder. Clients treat you as part of their executive team.
Your report is probably the most tangible thing your client sees from you on a regular basis. Not the behind-the-scenes campaign work. Not the keyword research. Not the ad creative tests. The report.
That makes it your single biggest opportunity to reinforce why they hired you.
Agencies with 51 or more employees maintain churn rates around 12 to 15%, largely because they’ve built systematic reporting processes with dedicated account teams. Small agencies with fewer than 10 employees see churn above 30%. The difference almost always comes down to how consistently and clearly they communicate value.
And the financial impact compounds fast. According to research by Frederick Reichheld of Bain & Company, a 5% improvement in retention can boost profitability by 25 to 95%. Every client you keep is a client you don’t need to spend money to replace. Retained clients also tend to expand over time. They add channels. They increase budgets. They refer peers.
This table breaks down what effective reporting actually does for both sides of the relationship:
| What Reporting Does | Why It Matters to Your Client | Why It Matters to Your Agency |
|---|---|---|
| Documents ROI with real business metrics | Justifies their marketing spend to leadership | Protects the retainer from budget cuts |
| Provides strategic recommendations | Gives them a plan they can act on | Positions you as an advisor, not a vendor |
| Explains underperformance honestly | Builds trust through transparency | Prevents surprise cancellations |
| Educates on marketing complexity | Helps them make better internal decisions | Opens the door for expanded services |
| Shows competitive context | Reveals where they stand vs. their market | Differentiates you from generic agencies |
| Demonstrates agility | Proves you adapt based on data | Justifies premium rates |
Now ask yourself this: if your client compared your report to what a competitor agency would send them, would yours clearly stand out? If not, that’s your vulnerability.
What Happens When Reporting Falls Short
The Client Satisfaction Gap in Agency Reporting
Nearly half of digital marketing clients are unsatisfied with their agency reports. Understanding why is the first step to fixing it.
43%
Unsatisfied
Nearly half of all digital marketing clients report dissatisfaction with their agency’s reporting.
Dissatisfied clients rarely complain first — they quietly start taking calls from competing agencies. By the time you know, it’s often too late to save the relationship.
The four most common reasons reports fail
Too much data, not enough insight
Hundreds of metrics with no interpretation. The client has to figure out what matters and why — the exact job they hired you to do.
Fix → Limit to 5–7 metrics tied to their goalsWrong metrics for the audience
A CEO doesn’t need click-through rates. A marketing director doesn’t need a one-line summary. One-size-fits-all reports serve nobody well.
Fix → Executive summary + detailed appendixNo clear recommendations
Reports that describe what happened but never say what to do next. If a client finishes your report without an action item, you’ve missed the point.
Fix → End every section with a specific next stepBad results get buried
Vanity metrics front and center while underperformance hides in the appendix. Clients lose trust when they discover it themselves.
Fix → Address poor performance head-on with a recovery planAccording to a survey cited by Vendasta, 42.86% of clients in the digital marketing industry were unsatisfied with their agency’s reports. That’s almost half. And dissatisfied clients don’t usually complain first. They just start taking calls from other agencies.
Poor reporting sets off a chain reaction. When clients can’t clearly see their ROI, they won’t approve new initiatives or budget increases. Your upsell opportunities disappear. Your team starts to feel like their work isn’t appreciated because the client doesn’t engage with it. Morale drops. Quality drops. And eventually the client leaves, often citing “lack of results” when the real issue was lack of communication.
You might not even know your reporting is the problem. If you haven’t directly asked your clients whether your reports are useful, you’re guessing. And guessing is expensive.
How to Build a Custom Reporting Framework for Each Client
Generic reports are one of the fastest ways to lose a client’s attention. When your report looks like it could have been sent to any company in any industry, you’re telling them you don’t deeply understand their business.
The agencies with the strongest retention customize their approach for each client. That doesn’t mean you rebuild everything from scratch every month. It means you design a modular framework where the structure, metrics, and presentation adapt to each client’s situation.
Start with what actually drives their business decisions. Not their marketing goals. Their business goals. There’s a difference. “Increase organic traffic” is a marketing goal. “Reduce customer acquisition cost by 15% to improve unit economics before Series B fundraising” is a business goal. When you report against the business goal, you become part of their strategic conversation instead of just another vendor update.
Use this framework to match your metrics to what each client actually cares about:
| Client’s Business Priority | Lead With These Metrics | Support With These |
|---|---|---|
| Market share growth | Share of voice, new customer acquisition, brand awareness trends | Competitive benchmarks, social reach, category penetration |
| Profitability improvement | Customer acquisition cost, channel ROI, margin contribution | Conversion rate by segment, average order value, cost trends |
| Customer retention | Churn rate, repeat purchase rate, customer lifetime value | Net promoter score, engagement metrics, post-purchase interactions |
| New product launch | New product revenue, market adoption rate, launch campaign performance | Product-specific conversion, customer feedback, competitive displacement |
| Brand authority | Thought leadership engagement, industry citations, backlink growth | Content engagement depth, PR placement quality, speaking opportunities |
The second layer of customization is how you present the information. Who actually reads your report?
If it’s a CEO, they need a one-page summary with three to five key metrics and a clear recommendation. They don’t have time for 20 pages. A marketing director wants the balance of strategy and tactical detail. A technical team wants platform-specific data and granular performance breakdowns.
Some agencies create a single report that tries to serve all audiences. That usually means it serves none of them well. Build a brief executive summary that stands on its own, and pair it with a detailed appendix for the people who want to dig deeper. Your CEO audience gets what they need in 90 seconds. Your marketing team gets the detail they need to execute.
Pay attention to how your client processes information too. Some people are visual, so give them charts and dashboards. Some are analytical, so give them data tables and trend analysis. Others are narrative thinkers who want a written story with clear cause and effect. You can usually figure this out within the first two reporting cycles just by watching which parts of your report they ask questions about.
How to Set Reporting Up for Success From Day One
Choosing the Right Reporting Cadence
The right frequency depends on campaign type, client maturity, and how fast results shift. Use this guide to match cadence to context.
Weekly
When performance shifts fast
PPC & paid social campaigns. New client relationships (first 60–90 days). Product launches with active ad spend. Any campaign with daily budget decisions.
Monthly
When results compound over time
SEO & content marketing. Email / CRM programs. Established client relationships. Brand awareness campaigns. Social media organic.
Quarterly
When strategy needs a wider lens
Executive strategic reviews. Annual planning alignment. Market & competitive analysis. Budget reallocation decisions. Multi-channel attribution.
Pro tip: Start every new client at weekly cadence for the first 60–90 days regardless of campaign type. This builds the reporting rhythm, calibrates expectations, and catches misalignment early — before it becomes a retention problem. Then shift to the cadence that fits their campaign mix.
The first two weeks of a client relationship determine the trajectory of your reporting. If you skip this step and jump straight into campaign work, you’ll spend months trying to retroactively align on expectations.
Nail down three things with your client during onboarding.
First, scope and cadence. What metrics will you track? How often will you report? What format do they prefer? Monthly reporting works well for established campaigns like SEO and content programs where results compound gradually. Weekly reporting makes more sense for paid media campaigns where performance shifts fast. New client relationships benefit from weekly check-ins for the first 60 to 90 days, and then you shift to a sustainable rhythm once both sides have calibrated expectations.
This table shows how reporting cadence maps to different campaign types:
| Campaign Type | Recommended Cadence | Why This Works |
|---|---|---|
| SEO and content marketing | Monthly | Results compound slowly, so monthly gives enough data to spot real trends |
| PPC and paid social | Weekly or bi-weekly | Performance shifts fast with budget and targeting changes |
| Email and CRM programs | Monthly with campaign-specific updates | Steady cadence with extra reports when major sends go out |
| New client (any type) | Weekly for first 60-90 days | Both sides calibrate expectations and build a reporting rhythm |
| Executive strategic reviews | Quarterly | Longer time horizon for big-picture business impact |
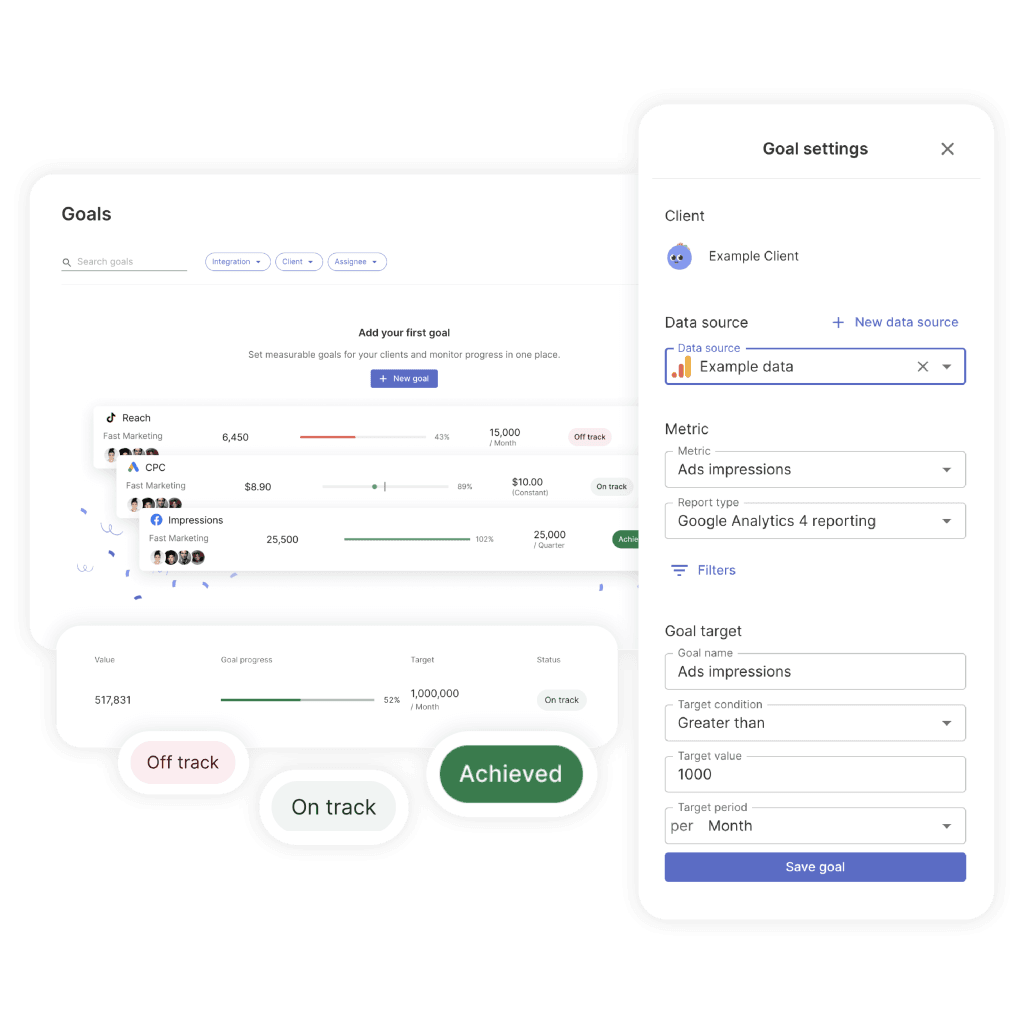
Second, objectives and KPIs. Develop specific, measurable goals together. Not “grow organic traffic” but “increase organic sessions by 25% in six months, specifically to product pages.” Industry data suggests that the most successful agency-client relationships focus on one to three primary numeric goals at a time. More than that and you’re spread too thin to show meaningful progress on any of them.
Third, methodology. Walk your client through where the data comes from, how you verify its accuracy, and how they should interpret the insights you deliver. This upfront education prevents the confused emails and skeptical questions that drain time later. It also establishes your credibility as someone who takes data seriously.
Think of onboarding as the rules of the game before you start playing. Without it, you and your client end up with different scorecards, and nobody feels like they’re winning.
How AI Has Changed the Reporting Game
Where AI Fits in Your Reporting Workflow
AI handles the repetitive, time-consuming work. Your team handles the parts that actually retain clients. Here’s how the split looks for each reporting task.
Data collection & aggregation
Report formatting & layout
Anomaly & trend detection
Written narrative drafts
Competitive context
Strategic recommendations
Client relationship & trust
6–10 hrs
Saved per client per month
70%
Less time on data assembly
3×
More time on strategy
AI-powered reporting tools moved from experimental to essential between 2024 and 2026. They haven’t replaced the strategic thinking agencies provide, but they’ve dramatically reduced the time spent on data collection, formatting, and initial analysis.
This is what that looks like in practice right now.
Tools like Swydo AI, Whatagraph IQ, and DashThis AI Insights Pro analyze your client’s campaign data and produce written narrative summaries that highlight key trends and anomalies. Instead of you or your account manager spending an hour writing commentary for each client, AI generates a draft, and your team reviews and refines it in minutes. The time savings add up fast when you have 15 or 20 clients.
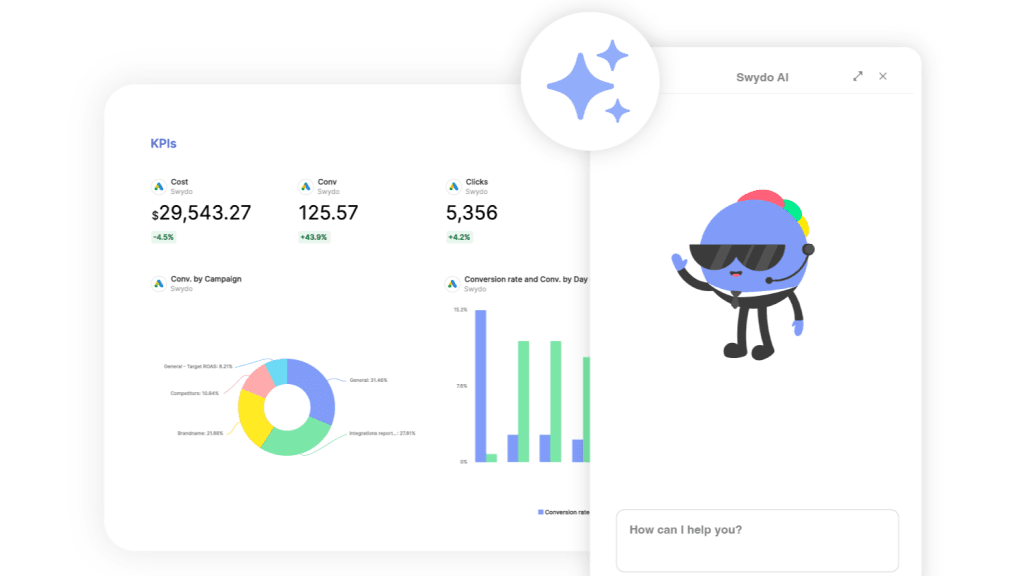
Several platforms also let both agency teams and clients ask questions about data in plain language. Your client types “Which campaign drove the most conversions last month?” and gets an immediate answer pulled from their connected sources. That turns the report from a static monthly document into something much closer to an ongoing conversation.
AI also monitors performance continuously and flags unusual patterns. A sudden drop in conversion rate. An unexpected spike in cost per click. A channel that significantly outperforms its historical average. You hear about problems before your client does, which lets you show up with a plan instead of an excuse.
Some platforms now generate complete report structures from a text prompt and apply brand colors automatically. That has cut initial report setup from hours to minutes for agencies with large client rosters.
But the critical thing to understand is this: AI handles the data assembly and pattern recognition, while your team provides the strategic interpretation, the client-specific context, and the recommendations that actually move the business forward. The agencies that get this right use AI to amplify their expertise. They don’t replace human judgment with automated summaries.
When you evaluate AI tools, focus on five criteria:
- Reliable integrations across your client’s platforms, because the tool is only useful if it connects to the data you need
- Clean data foundations, since AI output is only as good as the data underneath it
- Insights that are actually actionable and not just generic “traffic went up” summaries
- White-label capabilities so reports carry your brand, not the tool’s brand
- True end-to-end automation from data collection through report delivery
How to Make Your Visualizations Communicate Faster
Chart Selection Cheat Sheet
One chart, one insight. Pick the format that communicates your point in under 5 seconds. When in doubt, simplify.
Bar / Column
Compare across categories
Channel performance, campaign spend, A/B test results
Line Chart
Show trends over time
Traffic growth, cost per lead trends, MoM revenue
Pie / Donut
Simple composition (2–3 parts)
Traffic source split, budget allocation, lead source mix
Scatter Plot
Show relationships
Spend vs. conversions, effort vs. ROI, CPC vs. quality
Funnel / Stacked Bar
Show drop-off stages
Conversion funnels, lead qualification stages, checkout flow
Heat Map
Show density & patterns
Geographic performance, time-of-day engagement, page clicks
Chart title rule: Write titles that state the finding, not the metric. “Organic Traffic Up 23% After Content Refresh” tells your client what happened. “Website Sessions” tells them nothing. This one change dramatically improves comprehension speed.
A chart should communicate its key takeaway within five seconds. If your client has to study it, ask questions about it, or squint at a legend to understand what’s going on, the visualization isn’t doing its job.
The most common mistake is trying to fit too much into one chart. Research on working memory shows people process five to seven items at once. That’s your limit. One chart, one insight.
Use this reference to match your data to the right visual format:
| What You’re Showing | Best Visualization | Why It Works |
|---|---|---|
| Comparison across categories (channels, campaigns) | Bar or column chart | Easy side-by-side comparison |
| Trends over time (traffic, cost per lead) | Line chart or area chart | Shows direction and momentum clearly |
| Simple composition (two to three segments) | Pie chart | Shows parts of a whole at a glance |
| Relationships between variables (spend vs. conversions) | Scatter plot | Reveals correlations and outliers |
| Geographic performance | Heat map | Shows regional patterns instantly |
| Funnel drop-off points | Stacked bar chart | Highlights where you lose people |
Beyond chart selection, a few principles make the difference between visualizations that inform and visualizations that confuse.
Always include context. A line chart that shows traffic growth means nothing without a benchmark, a goal line, or a comparison period. Add year-over-year trends. Mark when campaigns launched or when algorithm updates hit. Your client shouldn’t have to wonder why a spike or dip happened.
Use descriptive titles that state the finding. “Organic Traffic Up 23% After Content Refresh” tells your client what happened. “Website Sessions” tells them nothing. That one small change dramatically improves how fast your client can absorb the report.
Keep consistent colors across all reports for a given client. When blue always means organic search and green always means paid social, your client develops visual fluency with your reports. They read faster. They understand faster. They engage more.
And check your color choices for accessibility. Roughly 8% of men and 0.5% of women have some form of color vision deficiency. Run your palette against a colorblind simulator before you commit to it.
How to Turn Data Into a Story That Drives Decisions
Anatomy of a High-Retention Client Report
The ideal structure — from a 90-second executive scan to deep tactical detail. Design your report so every stakeholder finds what they need fast.
90 sec
TLDR + Executive Summary
3–5 sentences at the very top. A busy CEO reads this and nothing else — they should walk away knowing how things went and what’s next. Include one clear recommendation.
→ CEO / C-Suite reads this
3 min
Goals Recap & KPI Scorecard
Restate the 1–3 business goals you agreed on during onboarding. Show a simple scorecard: target vs. actual with trend arrows. Green, yellow, red status at a glance.
→ Marketing Director reads from here
5 min
Channel Performance & Analysis
Break down results by channel. For each one: what happened, why it happened, and what you’re doing about it. Use descriptive chart titles that state the finding, not just the metric name.
3 min
Insights & Competitive Context
What did you learn this period? Include market shifts, competitive moves, or anomalies your AI tools flagged. This is where you prove you’re watching their industry, not just their dashboards.
2 min
Recommendations & Next Steps
Specific, actionable recommendations with expected outcomes and timelines. Your client should be able to approve these in the meeting and hand them off for execution the same day.
→ Everyone acts on this
What does your client actually do after they read your report? Do they take action? Do they share it with their team? Or does nothing happen?
If nothing happens, you have a narrative problem. Not a data problem.
Your client can access raw data in platform dashboards without you. The value you provide is the story around that data. What happened. Why it happened. What to do about it. That’s what they’re paying for.
Open every report with an executive summary that condenses the period into three to five key findings. A busy executive who reads nothing else should walk away knowing how things went and what the next move is. Keep this to one page. Some agencies also include a three to four sentence TLDR at the very top of the report or in the delivery email, and that works especially well for stakeholders who scan on mobile between meetings.
Then structure the rest with a clear arc. Recap the goals and strategy. Present the results with analysis. Close with specific recommendations.
When you explain results, go deeper than the what. Don’t just report that website traffic increased by 20%. Explain that the increase came from refreshed content on the top 15 landing pages and a link campaign that earned 23 new referring domains. This level of specificity proves you understand cause and effect, and it teaches your client how marketing actually works.
Translate every metric into business language too. Instead of a 15% conversion rate improvement, calculate the additional revenue it generated. Instead of a lower cost per lead, quantify how much more efficient their budget became. Your clients think in dollars and customers. Meet them there.
End every section with recommendations that are specific enough to act on. Not “improve social media engagement.” Instead, say “Post five Instagram Reels per week with behind-the-scenes content. Our data shows this format outperforms product posts by 50%. Start next week. Expect measurable engagement improvement within 30 days.”
When you pair an observation with a recommendation, an expected outcome, and a timeline, you’ve given your client something they can approve in the meeting and hand to someone for execution that afternoon. That’s the gap between a report that informs and a report that moves a business forward.
The Reporting Problems You’re Probably Already Dealing With
Agencies that understand best practices still hit the same recurring obstacles. These are the ones that come up most often, along with how to handle them.
Your reports have too much data. You have access to hundreds of metrics, and the temptation is to include everything that looks impressive. But more data doesn’t mean more value. For each client, identify the five to seven metrics that connect directly to their stated goals. Everything else goes into an appendix or a drill-down dashboard. If a metric doesn’t help your client make a decision, cut it.
Your data doesn’t match across platforms. Meta says you got 200 conversions. Google Analytics says 140. Your client is confused and starts to question your credibility. This happens because different platforms use different attribution models and tracking methods. Don’t ignore the discrepancy. Acknowledge it. Explain why attribution models differ. Then pick one source of truth for each key metric and use it consistently. Your client needs consistency more than they need precision down to the last click.
Your clients don’t read the reports. This is more common than most agencies want to admit. The usual causes are that reports are too long, they lack clear insights, they focus on metrics the client doesn’t care about, or they arrive without context. Keep the core report under 10 pages. Lead with the executive summary. Schedule a brief walkthrough when reports go out. Some clients would honestly prefer a five-minute video that walks through key findings over a 15-page PDF. Have you asked yours what they prefer?
You have to report bad results. This is where you earn trust or lose it. Be direct. Explain what happened and why. Present a specific recovery plan with timelines. Clients respect honesty far more than spin. The agencies that address poor performance head-on in their reports build stronger relationships than the ones that bury it under vanity metrics.
You have 20 clients who all want different things and you need to scale. You can’t build every report from scratch. The solution is modular design. Build standardized components: an executive summary module, a channel performance module, a competitive analysis module, a recommendations module. Assemble the right combination for each client. Customize the content, not the architecture.
The Right Reporting Tools Make All the Difference
The tools you use affect both the quality of your output and how many hours your team spends each month on reporting. Agencies that use dedicated reporting platforms save an estimated six to ten hours per client per month compared to manual processes. When you have 15 or more clients, that adds up to a full-time employee’s worth of time.
This is how the major platforms compare right now:
| Tool | Best For | Standout Feature | How They Charge |
|---|---|---|---|
| AgencyAnalytics | Full-service agencies that need broad coverage | 80+ native integrations with deep white-label options | Per user |
| Whatagraph | Agencies where visual impact matters | AI report creation from text prompts with automatic brand styles | Per client tier |
| Benly | Agencies that want AI-generated narrative insights | Written analysis that explains performance, not just charts | Per client |
| DashThis | Agencies that want conversational AI data exploration | AI Insights Pro with chat mode | Per dashboard |
| Swydo | Cost-conscious agencies that need solid automation | Automated multi-channel report delivery at accessible pricing | Per client |
| Looker Studio | Agencies on a budget in the Google ecosystem | Free with strong Google integrations | Free |
The key distinction in 2026 is between tools that display data and tools that interpret it. Platforms with AI-generated insights and anomaly detection reduce the analytical burden on your team and deliver richer reports. Evaluate based on how much strategic time a tool frees up, not just how many integrations it lists.
Whatever you choose, automation handles the data collection, formatting, and initial pattern recognition. The strategic layer, the part where you tell your client “this is what it means for your business,” should always come from your team. An automated report without human insight is just a dashboard with a send button.
How to Keep Your Reporting Sharp Over Time
Your reporting framework should grow and change just like your campaigns do. Client needs shift. Markets change. What worked six months ago might not land today.
Build a feedback loop. Every quarter, ask your clients specific questions. Is this format working for how you take in information? Are we covering what matters most to you right now? What do you consistently skip? Their answers tell you exactly where to improve.
Track your own efficiency too. How long does each report take to produce? How many revision cycles does it go through? Where do bottlenecks show up? Set internal benchmarks and work toward improving them without sacrificing quality.
And test new approaches. Try a video walkthrough alongside a written report. Test an interactive dashboard with a client who currently gets a static PDF. Add AI-generated summaries and ask if your clients find them useful. The agencies that keep refining their approach pull ahead of the ones that send the same template they built three years ago.
What This All Comes Down To
Client reporting is where your agency’s value becomes visible. It’s where trust gets built or eroded. It’s where relationships either deepen into partnerships or slide toward cancellation.
The agencies that do this well right now share a few common habits. They align every metric to business objectives. They use AI to handle data assembly while their teams focus on strategic interpretation. They customize for different stakeholders. They lead with insights instead of raw data. They’re honest about underperformance. And they treat reporting as something that gets better over time, not something they set up once and leave alone.
With retainers that range from $2,500 to $7,500 a month and churn rates between 18% and 42% depending on your model, the gap between strong reporting and weak reporting is worth hundreds of thousands of dollars in retained revenue each year.
Your report isn’t a record of what you did. It’s proof of what you understand about your client’s business. Make it count.
Client Reporting Best Practices FAQ
Proven reporting practices that retain clients, prove ROI, and turn agencies into irreplaceable partners
The best practices that separate high-retention agencies from replaceable ones come down to five habits: align every metric to business objectives (not marketing vanity metrics), customize reports for different stakeholders, lead with insights and recommendations instead of raw data, be honest about underperformance with a recovery plan, and treat reporting as something that improves over time through client feedback. Agencies that follow these practices see churn rates below 15%, while those sending generic data dumps lose 30% or more of their clients each year.
Lock down three things in the first two weeks. First, scope and cadence — what metrics you’ll track, how often you’ll report, and what format they prefer. Second, objectives and KPIs — develop specific, measurable goals together (not “grow organic traffic” but “increase organic sessions by 25% in six months to product pages”). Stick to one to three primary numeric goals. Third, methodology — walk your client through where data comes from, how you verify accuracy, and how to interpret insights. This upfront alignment prevents the confused emails, skeptical questions, and mismatched expectations that erode trust later.
Match cadence to how fast results change. PPC and paid social need weekly or bi-weekly reporting because performance shifts fast with budget and targeting changes. SEO and content marketing work best monthly since results compound slowly. Email and CRM programs suit monthly cadence with extra reports for major sends. Executive strategic reviews are best quarterly for big-picture business impact.
One best practice that applies across all campaign types: start every new client at weekly cadence for the first 60 to 90 days regardless of what you’re running. This builds the reporting rhythm, calibrates expectations, and catches misalignment early — before it becomes a retention problem.
Five to seven metrics tied directly to the client’s business goals. That’s it. Everything else goes into an appendix or drill-down dashboard. Research on working memory shows people process five to seven items at once — so more data doesn’t mean more value. The best practice is to ask yourself one question before including any metric: does this help my client make a decision? If not, cut it. Keep the core report under 10 pages and lead with the executive summary.
Start with the client’s business goal — not their marketing goal. There’s a crucial difference. “Increase organic traffic” is a marketing goal. “Reduce customer acquisition cost by 15% to improve unit economics” is a business goal. When you report against business goals, you become part of their strategic conversation.
| Client’s Business Priority | Lead With These Metrics |
|---|---|
| Market share growth | Share of voice, new customer acquisition, brand awareness trends |
| Profitability improvement | Customer acquisition cost, channel ROI, margin contribution |
| Customer retention | Churn rate, repeat purchase rate, customer lifetime value |
| New product launch | New product revenue, market adoption rate, launch campaign performance |
| Brand authority | Thought leadership engagement, industry citations, backlink growth |
Follow this five-part structure designed so every stakeholder finds what they need fast. Start with a TLDR or executive summary — three to five sentences a CEO can read in 90 seconds and walk away knowing how things went. Then a goals recap with a KPI scorecard showing target vs. actual with trend arrows. Next, channel performance with analysis explaining what happened and why. Then insights and competitive context proving you’re watching their industry, not just their dashboards. Close with specific, actionable recommendations with expected outcomes and timelines your client can approve in the meeting and hand off for execution that same day.
Different audiences need different depths, and a single report trying to serve everyone usually serves no one well. A CEO needs a one-page summary with three to five key metrics and one clear recommendation. A marketing director wants the balance of strategy and tactical detail. A technical team wants platform-specific data and granular breakdowns. Build a brief executive summary that stands on its own and pair it with a detailed appendix. Also pay attention to how each client processes information — visual thinkers need charts, analytical thinkers want data tables, and narrative thinkers want a written story with cause and effect.
Go deeper than “what happened.” Don’t just report that traffic increased by 20% — explain that the increase came from refreshed content on 15 landing pages and a link campaign that earned 23 new referring domains. Translate every metric into business language: instead of a 15% conversion rate improvement, calculate the additional revenue it generated. End every section with a recommendation specific enough to act on — the format, the timeline, the expected outcome. If your client finishes a section without a clear takeaway, you have a narrative problem, not a data problem.
A chart should communicate its key takeaway within five seconds. The most common mistake is fitting too much into one chart — the best practice is one chart, one insight. Use bar charts for comparing across categories (channels, campaigns), line charts for trends over time (traffic, cost per lead), pie charts for simple composition with two to three segments, scatter plots for relationships (spend vs. conversions), and heat maps for geographic performance.
Three more practices that make a significant difference: write chart titles that state the finding (“Organic Traffic Up 23% After Content Refresh” instead of “Website Sessions”), keep consistent colors across all reports for a given client so they develop visual fluency, and check your palette for accessibility since roughly 8% of men have some form of color vision deficiency.
Use AI to handle the repetitive work so your team can focus on what retains clients. AI excels at data collection and aggregation (roughly 95% automated), report formatting (about 85%), and anomaly detection (around 75%). But strategic recommendations remain about 85% human work, and client trust-building is almost entirely human. The best practice is to let AI generate the first draft — pulling data, formatting charts, flagging anomalies, writing initial narrative summaries — then have your team review, add strategic context, and write the recommendations. This saves an estimated six to ten hours per client per month without sacrificing the strategic layer clients pay for.
Evaluate reporting tools on five criteria: reliable integrations across your client’s platforms (useless if it can’t connect to the data you need), clean data foundations (AI output is only as good as the data underneath), insights that are actually actionable rather than generic summaries, white-label capabilities so reports carry your brand, and end-to-end automation from data collection through delivery. The key distinction is between tools that display data and tools that interpret it. Evaluate based on how much strategic time a tool frees up, not how many integrations it lists.
Best practice is both, serving different purposes. Live dashboards let clients check performance on their own schedule and reduce ad-hoc data requests. Periodic reports provide the interpretation, context, and strategic recommendations that raw dashboards can’t deliver. Some platforms also let clients ask questions about their data in plain language, turning reporting into an ongoing conversation. The dashboard satisfies curiosity; the report satisfies the need for strategic direction. Neither replaces the other — an automated dashboard without human insight is just a collection of numbers, and a monthly report without real-time access leaves clients feeling in the dark between updates.
Use modular design — build standardized components (executive summary module, channel performance module, competitive analysis module, recommendations module) and assemble the right combination per client. Customize the content, not the architecture. Pair this with AI-powered tools that handle data collection, formatting, and initial analysis so your team spends time writing the strategic insights that actually retain clients. Agencies using dedicated reporting platforms save an estimated six to ten hours per client per month compared to manual processes. With 15 or more clients, that’s a full-time employee’s worth of time redirected toward strategy.
Research shows roughly 43% of digital marketing clients are unsatisfied with their agency’s reports. It comes down to four failures: too much data with no interpretation (the client has to figure out what matters — the exact job they hired you to do), wrong metrics for the audience (a CEO doesn’t need click-through rates), no clear recommendations (describing what happened without saying what to do next), and bad results buried under vanity metrics. Dissatisfied clients rarely complain first — they quietly start taking calls from competing agencies. If you haven’t directly asked your clients whether your reports are useful, you’re guessing.
This is more common than most agencies admit. The usual causes: reports are too long, lack clear insights, focus on metrics the client doesn’t care about, or arrive without context. Best practices to fix it: keep the core report under 10 pages, lead with the executive summary, and schedule a brief 15-to-20-minute walkthrough when reports go out — this turns a passive document into an active conversation. Some clients would honestly prefer a five-minute video walkthrough over a 15-page PDF. Ask yours what format they actually prefer. If they’re not engaging, the report format is the problem — not the client.
Meta says 200 conversions. Google Analytics says 140. Your client is confused and starts questioning your credibility. This happens because different platforms use different attribution models and tracking methods. The best practice: don’t ignore it. Acknowledge the discrepancy directly, explain why attribution models differ, then pick one source of truth for each key metric and use it consistently across every report. Your client needs consistency more than precision down to the last click. Walk them through this during onboarding and you’ll prevent the confused emails that drain time later.
Be direct. This is where agencies earn trust or lose it. Explain what happened, why it happened, and present a specific recovery plan with timelines. Clients respect honesty far more than spin. Never lead with positive vanity metrics while hiding underperformance in the appendix — clients lose trust the moment they discover the problem themselves, and by then it’s usually too late. Frame issues with context (market changes, algorithm updates, seasonal factors) and close with concrete next steps. Agencies that address poor performance head-on build stronger relationships than those that bury it.
Build a quarterly feedback loop. Ask clients specific questions: Is this format working for how you take in information? Are we covering what matters most right now? What do you consistently skip? Track internal efficiency too — how long each report takes, revision cycles, where bottlenecks appear. Test new approaches: try video walkthroughs alongside written reports, test interactive dashboards for clients currently getting static PDFs, add AI-generated summaries and ask if they find them useful. The agencies that keep refining their approach pull ahead of those sending the same template they built years ago.
The numbers are stark. Retainer-based agencies lose roughly 18% of clients annually; project-based agencies lose closer to 42%. If your average client pays $5,000 a month, one lost client costs $60,000 in annual revenue — and acquiring a replacement is five to 25 times more expensive. A 5% improvement in retention can boost profitability by 25 to 95%. Reporting is the mechanism that makes retention happen: it documents ROI so clients justify spend to leadership, provides strategic direction that positions you as an advisor, and builds trust through transparency. Retained clients also expand over time — they add channels, increase budgets, and refer peers.
There are four maturity stages, and the difference is measured in churn. A data dump — screenshots pasted into a doc with no context — carries 30 to 42% churn risk. Structured reporting with consistent formatting and some commentary drops churn to 20 to 30%. Insight-led reporting that ties every metric to business objectives with AI-assisted analysis brings churn to 12 to 18%. Strategic partnership reporting — continuous, real-time monitoring with stakeholder-specific reports and proactive strategy — pushes churn below 12%. Most agencies are stuck at stage one or two. Moving up even one stage can save hundreds of thousands in retained revenue annually.
Reports that educate clients on marketing complexity naturally open the door for expanded services. When you include competitive context showing where they stand against their market, you create demand for new work. When you recommend specific next steps with projected outcomes, you’re essentially proposing new scope. The best practice is to use quarterly business reviews to document measurable results, explore evolving business challenges, and present logical service expansions with projected ROI. Clients who deeply understand your reports are far more likely to approve new initiatives and budget increases than those who can’t see their ROI clearly.
Agencies with 51 or more employees maintain churn rates around 12 to 15%, while small agencies with fewer than 10 employees often see churn above 30%. The difference almost always comes down to reporting consistency. Larger agencies have systematic processes with dedicated account teams. But small agencies can close this gap by adopting three best practices: use modular report templates so every client gets consistent quality without rebuilding from scratch, automate data collection with reporting tools to free up time for strategy, and schedule structured reporting walkthroughs rather than just emailing a PDF. These systems-level changes don’t require headcount — they require process discipline.
Build client reports that prove ROI, retain clients, and free up hours every month.
Start Your Free Trial Today