
Most businesses track 50+ metrics but can’t answer one simple question: “Which number, if improved by 10%, would have the biggest impact on revenue?”
The answer isn’t traffic, social media followers, or email open rates. It’s one of four core conversion metrics that directly connect marketing spend to business growth. Everything else is noise.
In 2025, with iOS restrictions eliminating 90% of Facebook’s tracking capabilities and privacy laws covering half the US, you can’t afford to optimize the wrong numbers. The businesses winning right now focus on metrics that work even when tracking breaks.
What Are Conversion Metrics and Why They Matter for Your Business
A conversion metric measures any desired action a visitor takes on your website or digital platform. But here’s where most people get it wrong – they think all conversions are equal. They’re not.
Think of conversion metrics like a pyramid. At the top, you have micro-conversions such as email signups, content downloads, and social media follows. These feel good and inflate your numbers, but they’re often just vanity metrics. At the bottom, you have macro-conversions such as actual sales, qualified leads, and recurring subscriptions. These directly impact your revenue.
The key insight? Focus 80% of your attention on macro-conversions and use micro-conversions only as support evidence for your optimization strategies.
10 Most Important Conversion Metrics to Track
Why It’s Important: Your primary business performance indicator that shows how effectively your website turns visitors into customers.
What Does It Measure: The percentage of visitors who complete your desired action (purchase, signup, lead form).
How to Calculate: Conversion Rate = (Conversions / Total Visitors) × 100.
Benchmark: Overall average is 2.9%, but varies by industry. E-commerce: 2.8%, SaaS: 2-5%, Professional Services often higher.
Best For: Evaluating how well your website, message, and offer match audience needs.
Related Metrics: CAC, Revenue per Visitor.
Common Pitfalls: Comparing yourself to generic averages instead of industry benchmarks and your own baseline.
Why It’s Important: Reveals which marketing channels are profitable and which are money pits.
What Does It Measure: How much you spend to acquire one paying customer.
How to Calculate: CAC = Total Marketing Spend / Number of New Customers Acquired.
Benchmark: Varies by channel. Email: often most cost-effective, Paid Social: $100-200+, PPC: $200-1200+, Trade Shows: $500-1000+.
Best For: Determining which channels deserve more budget and which should be eliminated.
Related Metrics: CLV, ROAS.
Common Pitfalls: Not tracking CAC by individual channel, leading to wasteful spending on unprofitable sources.
Why It’s Important: Shows the total revenue expected from a customer throughout their entire relationship with your business.
What Does It Measure: Long-term customer value, not just first purchase.
How to Calculate: CLV = Average Order Value × Purchase Frequency × Customer Lifespan. For subscriptions: Monthly Recurring Revenue / Monthly Churn Rate.
Benchmark: CLV should be at least 3x your CAC for sustainable growth.
Best For: Identifying which customer segments are most valuable and preventing short-sighted acquisition decisions.
Related Metrics: CAC, Churn Rate.
Common Pitfalls: Focusing only on acquisition cost without considering lifetime revenue potential.
Why It’s Important: Directly connects advertising spend to business outcomes and revenue generation.
What Does It Measure: Revenue generated for every dollar spent on advertising.
How to Calculate: ROAS = Revenue from Ad Campaign / Ad Campaign Cost.
Benchmark: 2025 average is around 2.87:1. E-commerce targets 3-4:1, SaaS often operates profitably at lower ratios.
Best For: Identifying which campaigns, ad sets, and keywords generate profitable returns.
Related Metrics: CAC, Conversion Rate.
Common Pitfalls: Not accounting for customer lifetime value in ROAS calculations for subscription businesses.
Why It’s Important: Captures total website monetization effectiveness better than conversion rate or AOV alone.
What Does It Measure: The average revenue generated from each website visitor.
How to Calculate: RPV = Conversion Rate × Average Order Value.
Benchmark: Varies widely by business model and industry. Track your own baseline and optimize for improvement.
Best For: Understanding which optimization strategy (higher conversion vs higher order value) actually generates more money.
Related Metrics: Conversion Rate, AOV.
Common Pitfalls: Optimizing conversion rate or AOV in isolation without considering combined revenue impact.
Why It’s Important: Two identical conversion rates can produce completely different profits based on order size.
What Does It Measure: The average dollar amount spent per transaction.
How to Calculate: AOV = Total Revenue / Number of Orders.
Benchmark: Varies significantly by industry and business model. Desktop users typically have higher AOV than mobile.
Best For: Evaluating e-commerce performance and finding upsell/cross-sell opportunities.
Related Metrics: Revenue per Visitor, Conversion Rate.
Common Pitfalls: Boosting AOV through friction that reduces conversion rate, resulting in lower total revenue.
Why It’s Important: Every abandoned cart represents a customer who wanted to buy but encountered friction.
What Does It Measure: The percentage of shoppers who add items to cart but don’t complete purchase.
How to Calculate: Cart Abandonment Rate = (1 – Completed Purchases / Shopping Carts Created) × 100.
Benchmark: Average is 69.8%. Main causes: unexpected shipping costs (48%) and complex checkout (23%).
Best For: Identifying friction points in the checkout process.
Related Metrics: Conversion Rate, AOV.
Common Pitfalls: Not investigating why abandonment happens or where in the checkout process customers drop off.
Why It’s Important: Reveals product-market fit better than signup rates alone.
What Does It Measure: The percentage of trial users who become paying customers.
How to Calculate: Trial-to-Paid Rate = (Paid Conversions / Trial Signups) × 100.
Benchmark: Varies by software type. CRM software leads at 29%, other categories differ based on complexity and commitment.
Best For: Assessing onboarding effectiveness and product value delivery.
Related Metrics: Churn Rate, MRR Growth.
Common Pitfalls: High trial signups with low conversion indicate wrong audience targeting or product doesn’t deliver on promises.
Why It’s Important: Prevents marketing teams from optimizing for quantity over business impact.
What Does It Measure: Conversion rates from Marketing Qualified Leads (MQL) to Sales Qualified Leads (SQL) to closed deals.
How to Calculate: Track separately: MQL-to-SQL Rate = (SQLs / MQLs) × 100, and SQL-to-Close Rate = (Closed Deals / SQLs) × 100.
Benchmark: A lead source with 50% MQL-to-SQL conversion is more valuable than one with 10%, even if the second generates more total MQLs.
Best For: B2B service businesses with complex, relationship-based sales.
Related Metrics: Pipeline Velocity, Sales Cycle Length.
Common Pitfalls: Generating 1,000 unqualified leads wastes more resources than generating 100 qualified leads.
Why It’s Important: High churn forces you onto a “leaky bucket” treadmill where you constantly need new customers just to maintain revenue.
What Does It Measure: The percentage of customers or revenue lost over a time period.
How to Calculate: Churn Rate = (Customers Lost During Period / Customers at Start of Period) × 100.
Benchmark: Annual churn: 3.5-5% for healthy SaaS. Monthly: below 0.7% for sustainable growth.
Best For: Subscription and SaaS businesses measuring retention and customer satisfaction.
Related Metrics: CLV, MRR Growth.
Common Pitfalls: Small improvements create massive impact—reducing annual churn from 10% to 5% can double customer lifetime value.
Four Revenue-Connected Metrics That Drive Business Growth
While hundreds of metrics exist in digital marketing, only a handful directly connect to business success. These four foundational metrics form the backbone of profitable marketing measurement. Master these first before exploring industry-specific variations, and you’ll have the clarity needed to make confident optimization decisions.
Conversion Rate – Your Primary Business Performance Indicator
Your conversion rate is the percentage of visitors who complete your desired action. But here’s what most articles won’t tell you – the average conversion rate of 2.9% across all industries is meaningless for your business.
According to Ruler Analytics’ 2025 industry report, conversion rates vary dramatically by industry. The overall average sits at 2.9%, but individual industries show significant variation such as
- E-commerce at 2.8% (confirmed by multiple sources)
- SaaS/Software generally ranges from 2-5% based on the specific software category
- Professional Services often higher than average due to relationship-based sales
- Retail varies widely from 1-4% based on product category and price point
The real value isn’t in your comparison to generic averages – it’s in your grasp of industry benchmarks and consistent improvement against your own baseline.
Why It Matters – Conversion rate directly reflects how well your website, message, and offer match your audience’s needs. A decline in conversion rate signals problems with your value proposition, user experience, or traffic quality. More importantly, you can double your profitability by improving your conversion rate just 1% without spending more on advertising.
Customer Acquisition Cost – How Much You Pay for Each New Customer
CAC measures how much you spend to acquire one paying customer. This metric separates successful businesses from those burning through investor money.
The formula is straightforward:
But here’s the insight most miss – CAC varies wildly by channel. Industry research shows significant differences across acquisition methods such as
- Email Marketing – Often among the most cost-effective channels for existing audiences
- SEO/Organic – Low ongoing costs once established, but high initial investment
- Paid Social – Typically ranges from $100-200+ per customer in competitive markets
- PPC/Google Ads – Can reach $200-1200+ per customer in competitive industries
- Trade Shows – All-in costs often exceed $500-1000+ per customer
Why It Matters – CAC tells you which marketing channels are profitable and which are money pits. If you spend $200 to acquire customers who only spend $150, you’re literally paying people to buy from you. Your grasp of CAC by channel allows you to shift budget toward profitable acquisition sources and eliminate wasteful spending.
Customer Lifetime Value – How Much Revenue Each Customer Generates Over Time
CLV represents the total revenue you can expect from a customer throughout their entire relationship with your business. This metric transforms how you think about acquisition costs.
The basic CLV formula is
For subscription businesses, it’s Monthly Recurring Revenue per Customer ÷ Monthly Churn Rate
Here’s the golden rule – Your CLV should be at least 3 times your CAC for sustainable growth. If you acquire customers for $100, they should generate at least $300 in lifetime value.
Why It Matters – CLV prevents short-sighted decision making. You might think spending $200 to acquire a customer is too expensive until you realize that customer will spend $2,000 over their lifetime. CLV also reveals which customer segments are most valuable, so you can focus acquisition efforts on high-value prospects rather than just any warm body.
Return on Ad Spend – How Much Revenue Your Advertising Generates
ROAS measures revenue generated for every dollar spent on advertising.
The formula is
Industry benchmarks for ROAS vary significantly. The 2025 average sits around 2.87:1, with many successful e-commerce businesses targeting 3-4:1 for sustainable growth. SaaS companies often operate profitably at lower ratios due to higher customer lifetime values, while competitive industries may require higher returns.
ROAS immediately tells you which campaigns, ad sets, and keywords generate profitable returns. Unlike clicks or impressions, ROAS directly connects advertising spend to business outcomes. A campaign with a 1.5:1 ROAS might be breaking even, while a 4:1 ROAS campaign deserves more budget allocation.
How Different Business Models Need Different Conversion Approaches
Generic conversion tracking fails because different business models work on completely different principles. An e-commerce store that optimizes for immediate purchases needs different metrics than a SaaS company that builds long-term recurring revenue. These distinctions prevent you from chasing the wrong numbers and help you focus on metrics that actually drive growth in your specific industry.
E-commerce Stores Need Order Value and Cart Recovery Metrics
E-commerce businesses need to track metrics that reflect the entire customer journey such as
Average Order Value (AOV) – This measures the average dollar amount spent per transaction. Research shows that desktop users typically have higher AOV than mobile users, though the exact amounts vary significantly by industry and business model.
Why AOV Matters – Two identical conversion rates can produce completely different profits. A 2% rate with $50 orders generates $1.00 per visitor, while 2% with $200 orders generates $4.00 per visitor. Boosting order size often proves easier than boosting conversion rates.
Cart Abandonment Rate – The average is 69.8%, but the key is to understand why. Unexpected shipping costs account for 48% of cart abandonment, while complex checkout processes cause another 23%.
Why Cart Abandonment Matters – Every abandoned cart represents a customer who wanted to buy but encountered friction. You can effectively increase your conversion rate by 33% when you reduce cart abandonment from 70% to 60% without driving additional traffic.
Revenue per Visitor (RPV) – This metric combines conversion rate and average order value such as RPV = Conversion Rate × Average Order Value.
Why RPV Matters – RPV is more valuable than tracking conversion rate or AOV alone because it captures total website monetization effectiveness. You can optimize for higher conversion rates with lower-value products, or lower conversion rates with higher-value products – RPV shows you which strategy actually generates more money.
SaaS Companies Must Track Subscription and Churn Performance
SaaS businesses work on subscription models that demand specialized metrics such as
Trial-to-Paid Conversion Rate – According to First Page Sage’s 2025 SaaS report, trial conversion rates vary by software type, with CRM software leading at 29% conversion rates. Other categories show different patterns based on complexity and user commitment levels.
Why Trial Conversion Matters – This metric reveals product-market fit better than signup rates. High trial signup rates with low conversion rates indicate your marketing attracts the wrong audience or your product doesn’t deliver on its promise. Low trial conversion rates often point to onboarding problems or feature gaps.
Monthly Recurring Revenue (MRR) Growth – Track new MRR, expansion MRR, and churned MRR separately. Healthy SaaS companies typically aim for 20-35% annual growth, with top performers reaching 50%+ annually.
Why MRR Growth Matters – MRR growth shows business momentum and sustainability. Flat growth despite increased marketing spend indicates efficiency problems. Negative net MRR (when churn exceeds new revenue) signals fundamental business model issues.
Churn Rate – Both customer churn and revenue churn matter. Annual churn rates typically range from 3.5-5% for healthy SaaS businesses, while monthly rates should stay below 0.7% for sustainable growth.
Why Churn Rate Matters – High churn rates force you onto a “leaky bucket” treadmill where you constantly need new customers just to maintain revenue. Small churn improvements create massive impact – reducing annual churn from 10% to 5% can double customer lifetime value.
B2B Service Businesses Need Pipeline and Sales Cycle Metrics
B2B service businesses need metrics that reflect longer, more complex sales cycles such as
Lead Quality Score – Not all leads are equal. Track conversion rates from Marketing Qualified Leads (MQL) to Sales Qualified Leads (SQL) to closed deals.
Why Lead Quality Matters – You waste more resources when you generate 1,000 unqualified leads than when you generate 100 qualified leads. Lead quality metrics prevent marketing teams from optimization for quantity over business impact. A lead source with 50% MQL-to-SQL conversion is more valuable than one with 10% conversion, even if the second source generates more total MQLs.
Pipeline Velocity – The formula is
Why Pipeline Velocity Matters – Pipeline velocity reveals how efficiently your business converts prospects into revenue. Two companies with identical win rates can have completely different growth rates based on sales cycle length. You boost pipeline velocity by 50% when you shorten your sales cycle from 90 to 60 days.
Sales Cycle Length – Track how long it takes from first contact to closed deal. First Page Sage data shows industries vary significantly, with software/tech averaging 67 days, while manufacturing can extend to 124+ days.
Why Sales Cycle Length Matters – Longer sales cycles tie up resources and create cash flow challenges. More importantly, prospects can lose interest or find alternatives during extended sales processes. Your grasp of cycle length helps you identify bottlenecks and set realistic revenue forecasts.
Local Businesses Must Connect Online Marketing to Physical Visits
Local businesses need metrics that connect digital marketing to physical visits such as
Store Visit Conversion Rate – Mobile advertising can drive significant in-store traffic for local businesses, with rates that vary by industry and location targeting effectiveness.
Why Store Visits Matter – For local businesses, website conversions often represent just the tip of the iceberg. A restaurant might get few online orders but generate significant in-person traffic from digital advertising. You can track store visits to reveal the true impact of digital marketing on local business revenue.
Call Conversion Rate – Track not just calls, but qualified calls. A 6-second pocket dial isn’t the same as a 28-minute consultation.
Why Call Quality Matters – Many local businesses optimize for total calls, which leads to campaigns that generate high call volume but low revenue. You can track call duration, appointment bookings, and call-to-sale conversion rates to reveal which campaigns drive actual business value versus just phone activity.
Local Search Visibility – Track rankings for “near me” searches and local pack appearances.
Why Local Visibility Matters – Local search behavior is fundamentally different from general search. People who search “restaurants near me” have immediate purchase intent, which makes local search rankings directly connected to foot traffic and revenue.
Revenue-Connected Metrics vs Vanity Numbers That Look Good but Mean Nothing
The most successful businesses distinguish between metrics that drive action and those that merely look impressive in reports. This distinction becomes critical when resources are limited and every optimization effort must count. Here’s how to separate the signal from the noise in your measurement strategy.
Metrics That Drive Business Decisions (Focus Here)
Revenue per Visitor – Combines traffic quality and conversion optimization effectiveness. If your RPV increases, your business grows regardless of visitor volume.
Customer Acquisition Cost by Channel – Enables intelligent budget allocation decisions. When you know email marketing costs $53 per customer while trade shows cost $811, you can prioritize spending.
Lifetime Value to Acquisition Cost Ratio – Predicts long-term profitability and sustainable growth rates. This ratio determines how aggressively you can scale marketing spend.
Conversion Rate by Traffic Source – Identifies your most effective marketing channels. A traffic source with 2x higher conversion rates deserves 2x more investment.
Vanity Metrics to Monitor (Not Optimize For)
Website Visitors – High visitor counts mean nothing if those people don’t buy. Quality beats quantity every time.
Social Media Followers – Follower count has zero business value unless those people become paying customers.
Email Open Rates – Opens alone tell you nothing about business impact. Focus on what happens after the click.
Page Views – Someone can view 50 pages and still leave without buying anything. Engagement doesn’t guarantee sales.
Four Critical Mistakes That Destroy Your Conversion Data Quality
Even experienced marketers fall into predictable traps when they measure conversions. These mistakes don’t just waste time – they actively mislead optimization efforts and can destroy profitability. You need to understand these pitfalls to build measurement systems that actually improve business performance rather than just generate impressive-looking dashboards.
Mistake #1 – Treat All Conversions Equally
A $10 product purchase and a $10,000 software demo request both count as “1 conversion” in most tracking setups. This creates misleading optimization signals that can destroy profitability.
The Fix – Weight conversions by their actual business value, not just their quantity. A single high-value conversion might be worth 100 low-value conversions.
Mistake #2 – Ignore Attribution Windows
Different products have different consideration periods. A software purchase might take 3-6 months of research, while an impulse purchase happens immediately.
The Problem – Businesses often miss conversions when their attribution windows don’t match actual customer behavior patterns. Using 28-day attribution for a 6-month sales cycle misses most conversions, while using 6-month attribution for impulse purchases may over-attribute to unrelated touchpoints.
Mistake #3 – Focus on Averages Instead of Segments
Industry average conversion rates are meaningless for your specific business. A luxury car dealership and a fast-food restaurant both serve “consumers” but have completely different conversion patterns.
The Solution – Break down your data by customer type, traffic source, device, and geographic location. Your mobile traffic might convert at 1% while desktop converts at 4% – when you treat them as one audience, you miss optimization opportunities.
Mistake #4 – Optimize for Single Metrics Instead of Business Outcomes
You can hurt total revenue when you optimize purely for conversion rate if you attract customers with lower average order values. You can hurt total revenue when you optimize purely for average order value if conversion rates drop.
The Solution – Zero in on metrics that connect directly to business outcomes – revenue per visitor, customer lifetime value, and profitable growth rates.
Why These Conversion Metrics Matter More in 2025 Than Ever Before
The digital marketing field has fundamentally shifted, which makes smart metric selection more critical than ever before. Privacy regulations, increased competition, and higher customer expectations have created an environment where measurement precision directly determines business survival. These changes help you prioritize the right metrics for long-term success.
Attribution Is Getting Harder – iOS updates, cookie restrictions, and privacy regulations have made it more difficult to track customer journeys accurately. This means the metrics you choose to focus on must be robust enough to provide insights even with incomplete data.
Competition Is Intensifying – As more businesses compete for digital attention, customer acquisition costs are rising across all channels. Your grasp of true CAC and CLV becomes essential for maintaining profitability.
Customer Expectations Are Rising – Modern customers research extensively before purchasing and expect seamless experiences across devices and channels. Metrics that capture the full customer journey provide competitive advantages.
Key Takeaways
Check your conversion rate by traffic source. If Google Ads converts at 2% but Facebook converts at 0.5%, shift 70% of your Facebook budget to Google. Most businesses miss this and waste thousands monthly.
Calculate your CAC for each channel. If email costs you $30 per customer while PPC costs $300, you need 10x higher lifetime value from PPC customers to justify the spend.
Set up revenue-weighted conversion tracking. A $500 purchase should count 10x more than a $50 purchase in your optimization. Google Ads and Facebook both support this but most accounts don’t use it.
For SaaS companies – if your trial-to-paid rate is below 15%, fix your onboarding before spending more on ads. For e-commerce – if cart abandonment is above 75%, fix checkout before increasing traffic.
The biggest conversion killer in 2025? Treating mobile and desktop traffic the same. Desktop converts 3-4x better in most industries, so optimize landing pages by device, not as one-size-fits-all.
Conversion Metrics FAQ
Clear answers to your most important measurement questions
A conversion metric measures when visitors take a desired action on your website—like making a purchase, signing up for a trial, or submitting a lead form. The key is focusing on actions that directly generate revenue (macro-conversions) rather than vanity metrics like page views or social follows (micro-conversions).
The average conversion rate is 2.9%, but this varies dramatically by industry. E-commerce averages 2.8%, SaaS ranges from 2-5%, and professional services typically see higher rates. Don’t compare yourself to generic averages—track your own baseline and focus on consistent improvement. A 1% increase in your conversion rate can double profitability without additional ad spend.
Conversion rate measures the percentage of visitors who complete an action. Conversion value measures the revenue generated from those conversions. A 2% conversion rate with $50 orders generates $1 per visitor, while 2% with $200 orders generates $4 per visitor. Always track both—high conversion rates mean nothing if the transactions are low-value.
Vanity metrics look impressive but don’t drive business decisions. Examples include website visitors without conversion context, social media followers who never buy, email open rates without click or purchase data, and page views without engagement. Focus instead on revenue per visitor, customer acquisition cost by channel, lifetime value to acquisition cost ratio, and conversion rate by traffic source.
Customer Lifetime Value (CLV) is the total revenue a customer generates throughout their entire relationship with your business. It matters because it prevents short-sighted decisions. Spending $200 to acquire a customer seems expensive until you realize they’ll spend $2,000 over their lifetime. Your CLV should be at least 3x your acquisition cost for sustainable growth.
Conversion Rate = (Number of Conversions ÷ Total Visitors) × 100. For example, if 100 people visit your website and 3 make a purchase, your conversion rate is 3%. Calculate this separately for each traffic source and device type to identify your best-performing channels.
CAC = Total Marketing Spend ÷ Number of New Customers Acquired. If you spend $10,000 on marketing and acquire 50 customers, your CAC is $200. Always calculate this separately for each channel (email, PPC, social) because costs vary wildly—email might cost $30 per customer while trade shows cost $800+.
ROAS (Return on Ad Spend) = Revenue from Ad Campaign ÷ Ad Campaign Cost. If you spend $1,000 on ads and generate $4,000 in revenue, your ROAS is 4:1. Most e-commerce businesses target 3-4:1 for profitability, while SaaS companies can operate at lower ratios due to higher customer lifetime values.
Cart Abandonment Rate = (1 – Completed Purchases ÷ Shopping Carts Created) × 100. The average is 69.8%. If 100 people add items to their cart but only 30 complete checkout, your abandonment rate is 70%. The main causes are unexpected shipping costs (48%) and complex checkout processes (23%).
Revenue per Visitor (RPV) = Conversion Rate × Average Order Value. This metric is more valuable than tracking conversion rate or average order value alone because it shows total website monetization effectiveness. You can optimize for higher conversions with lower values, or lower conversions with higher values—RPV reveals which strategy actually makes more money.
Churn Rate = (Customers Lost During Period ÷ Customers at Start of Period) × 100. If you start the month with 100 customers and lose 5, your monthly churn is 5%. For healthy SaaS businesses, annual churn should stay between 3.5-5%, with monthly churn below 0.7%. Reducing churn from 10% to 5% annually can double customer lifetime value.
First, segment your data by traffic source, device, and customer type to find what’s actually underperforming. Desktop typically converts 3-4x better than mobile, so optimize landing pages by device. Remove friction from your checkout process, be transparent about all costs upfront, add trust signals like reviews and guarantees, and use A/B testing to validate changes before full rollout.
Calculate CAC for each marketing channel separately. If Google Ads converts at 2% but Facebook converts at 0.5%, shift budget from Facebook to Google. Focus on channels with proven performance rather than spreading budget thinly. Improve conversion rates on existing traffic (doubling conversion rate cuts CAC in half), and build organic channels like SEO and email that have lower ongoing costs.
Unexpected shipping costs cause 48% of cart abandonment, and complex checkout processes cause 23%. Fix this by showing all costs upfront, offering free shipping thresholds, simplifying checkout to minimum required fields, enabling guest checkout, adding multiple payment options, displaying security badges, and sending cart abandonment emails. Reducing abandonment from 70% to 60% effectively increases conversion by 33%.
Fix conversion rate first. If your site converts at 1%, doubling traffic gets you 2x sales. But improving conversion to 2% also gets 2x sales without paying for more traffic. Most businesses have major conversion leaks—fix those before spending more on acquisition. Once you’re converting well, then scale traffic through proven channels.
Look for your biggest bottleneck. If cart abandonment is above 75%, fix checkout before increasing traffic. If CAC is higher than one-third of customer lifetime value, your acquisition is unprofitable—improve unit economics before scaling. If trial-to-paid conversion is below 15% for SaaS, fix onboarding before spending more on ads. Always optimize the constraint that’s limiting your growth most severely.
Optimize revenue per visitor (RPV) by testing both conversion rate improvements and average order value increases. Add upsells at checkout, implement product bundles, introduce quantity discounts, create urgency with limited-time offers, and improve product recommendations. Even a 10% improvement in average order value combined with small conversion gains can increase revenue 20-30% from the same traffic.
Start with Google Analytics 4 for website conversions and traffic analysis. Add platform-specific tracking (Facebook Pixel, Google Ads conversion tracking) for paid advertising. Use your e-commerce platform’s built-in analytics (Shopify, WooCommerce) for transaction data. For phone calls, implement call tracking numbers. Most importantly, ensure all tools share the same conversion definitions and attribution windows.
Focus on first-party data you control directly: on-site actions tracked through your own analytics, email signups captured through your forms, server-side tracking that doesn’t rely on browser cookies, and conversion APIs that send data directly from your server to ad platforms. Use Google Analytics 4’s modeling to fill data gaps, and prioritize measuring outcomes you can track regardless of third-party cookies.
Conversion tracking monitors when visitors complete desired actions on your website. It works by placing tracking code (pixels or tags) on your site that fires when someone completes a conversion event—like reaching a thank you page after purchase. This data connects back to the traffic source, showing which marketing channels drive actual results versus just clicks.
Focus 80% of your attention on macro-conversions (actual sales, qualified leads, paid subscriptions) because they directly impact revenue. Track micro-conversions (email signups, content downloads, social follows) only as support evidence for optimization strategies. Many businesses waste resources optimizing micro-conversions that never lead to actual revenue.
In Google Analytics 4, go to Admin → Events → Create Event to set up conversion events. Mark important events (like purchases, form submissions, sign-ups) as conversions. Ensure your website has the GA4 tracking code installed. For e-commerce, enable enhanced measurement and set up e-commerce tracking with transaction values. Test conversions fire correctly before relying on the data for decisions.
Attribution determines which marketing touchpoints get credit for a conversion. If someone clicks your Facebook ad, later visits from Google search, then converts, which channel gets credit? Last-click attribution credits Google, first-click credits Facebook, and multi-touch splits credit. Choose attribution models that match your actual sales cycle—impulse purchases work with short windows (7-30 days), while B2B needs longer windows (90-180 days).
Review key metrics weekly to spot trends early, but make optimization decisions based on monthly data to avoid reacting to normal fluctuations. Monitor daily only if running active campaigns or tests. Always wait for statistical significance before making changes—typically 2-4 weeks of data. Quarterly, do deep analysis of customer lifetime value, churn rates, and long-term channel performance.
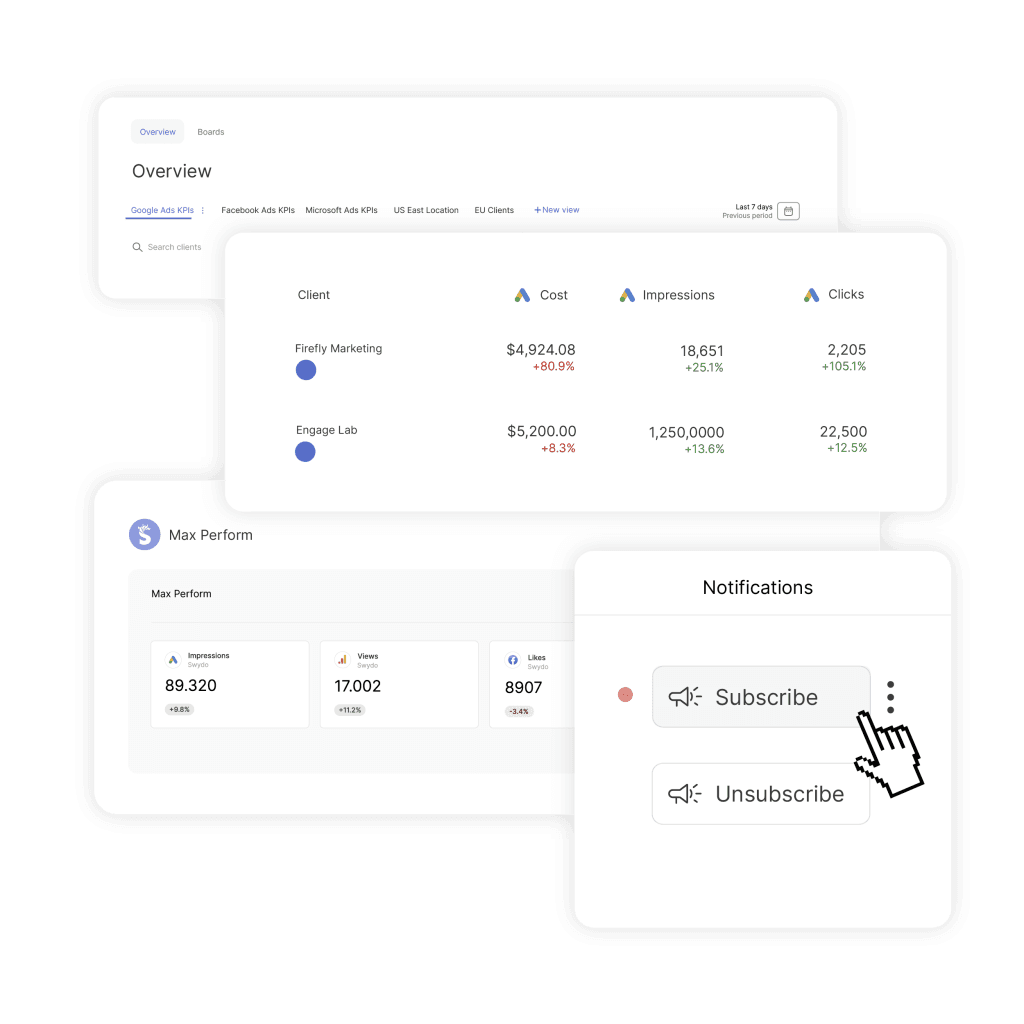
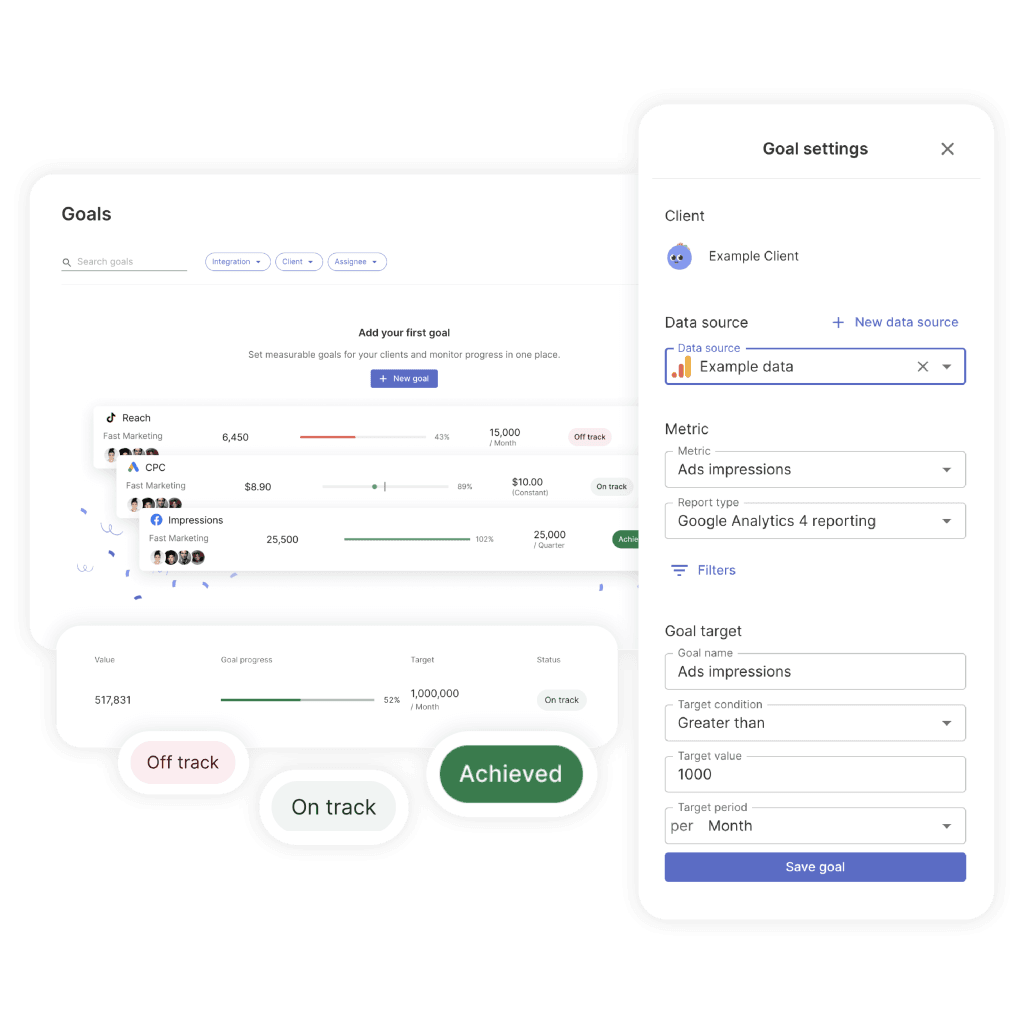
Pulling conversion data from multiple platforms takes hours. Swydo does it automatically so you can focus on optimization.
Start Your Free Trial Today