
Your agency manages campaigns across dozens of platforms. Your clients demand unified reporting that connects impressions to revenue. Your analysts spend 70% of their time just combining data rather than extracting insights. Not exactly a one-off situation.
Marketing agency leaders in 2025 face challenges from exponentially growing data sources and clients who expect increasingly sophisticated cross-channel insights. The solution isn’t another dashboard tool or hiring more analysts—master the art and science of data blending instead.
What Data Blending Really Means for Your Agency
Data blending creates a unified analytical foundation that reveals the complete story behind marketing campaigns. This approach makes the difference between showing clients platform-specific metrics and demonstrating exactly how your work drives their business outcomes.
Done right, data blending transforms an agency from a collection of channel specialists into an insights powerhouse that speaks the language clients care about most: revenue and growth.
Most agency leaders face a dilemma—drowning in platform data while starving for insights. Clients struggle to connect the dots between campaign metrics and business results. Effective data blending transforms client relationships from tactical to strategic through comprehensive views of performance.
The Strategic Value of Data Blending for Agencies:
- Win larger clients with sophisticated cross-channel analytics capabilities
- Retain clients longer by demonstrating clear business impact, not just activity metrics
- Command premium rates for truly integrated services backed by unified data
- Differentiate your agency in pitches with insights competitors can’t deliver
- Scale your analytics without proportionally scaling your team
Forward-thinking agencies use this approach to transform service offerings and client relationships.
Why Traditional Data Integration Methods Are Failing Your Agency
Operations directors have likely tried solving this problem before. Many agencies attempt these approaches, only to get stuck:
| Approach | What It Looks Like | Why It Fails |
|---|---|---|
| The Export-Import Nightmare | Your team manually downloads reports from Google Ads, Meta Business Suite, TikTok Ads, LinkedIn Campaign Manager, and client CRMs, then cobbles them together in spreadsheets. | • Scales poorly with client growth • Introduces human error • Consumes valuable strategic time • Breaks when platforms change |
| The Custom Development Trap | You invest in developers to build custom APIs and data pipelines. | • Requires ongoing maintenance • Breaks when APIs update • Expensive to scale across clients • Creates technical debt |
| The Enterprise Platform Mismatch | Enterprise marketing platforms promise unified analytics but deliver inflexible systems. | • Designed for in-house teams, not agencies • Struggles with multiple client tech stacks • Requires standardization across diverse clients • Expensive per-seat licensing models |
Modern data blending takes a fundamentally different approach—specifically suited to agency workflows and the need to adapt quickly to new platforms, changing client requirements, and emerging channels.
Data Blending vs. Other Approaches: What Makes It Different
To understand why data blending is transforming agency analytics, let’s compare it to alternatives:
Data Blending vs. Data Integration
Data blending uses analyst-driven, flexible combinations for specific analytical needs rather than creating permanent infrastructure connections between systems. It requires your existing strategy team rather than an engineering team and significant IT investment.
The time to value is days to initial insights (versus months to implement), and it’s highly adaptable to new requirements and data sources rather than being rigid and requiring significant rework for changes. It’s ideal for agencies managing multiple client tech stacks rather than being excellent only for single enterprise clients.
Data Blending vs. Marketing Attribution Platforms
Data blending offers comprehensive analysis across any metrics and dimensions rather than a narrow focus on assigning conversion credit. It works with whatever tracking clients already have rather than requiring clients to implement specific tracking.
It provides full adaptability to each client’s attribution preferences rather than limited flexibility for custom business logic. It extends to any cross-platform analysis clients need rather than being limited to attribution modeling, and offers scalable costs based on your implementation approach rather than typically high recurring license fees.
Data Blending vs. Reporting Automation
Data blending creates new cross-platform metrics and insights rather than surface-level metrics within each platform. It enables diagnostic, predictive, and prescriptive analysis rather than just descriptive analysis (what happened).
It delivers strategic insights that drive optimization rather than operational efficiency in reporting. It puts your team in control of the client story rather than being constrained by platform limitations, and offers significant competitive advantage rather than being a widely available commodity.
The key difference? Data blending puts your strategic team in control of the narrative instead of being constrained by platform limitations or engineering dependencies.
This table below visually compares different data approaches, highlighting the advantages of data blending over traditional methods.
Data Approaches for Marketing Agencies
Compare key differences between common approaches for handling cross-platform marketing data
| Approach | Implementation | Resources Required | Time to Value | Adaptability | Strategic Value |
|---|---|---|---|---|---|
| Data Blending BEST | Analyst-driven, flexible combinations for analytical needs | ||||
| Data Integration | Permanent infrastructure connections between systems | ||||
| Export-Import Manual | Manual downloads combined in spreadsheets | ||||
| Custom Development | Custom APIs and data pipelines built in-house | ||||
| Enterprise Platforms | Off-the-shelf marketing platforms with unified analytics |
* Rating system: More filled dots indicate better performance in that category. Data Blending stands out with the highest overall performance across key metrics that matter most to marketing agencies serving multiple clients.
Five Types of Data Blending Approaches for Marketing Agencies
Select the optimal data blending approach that aligns with your technical capabilities, client demands, Pick the right data blending approach based on your tech skills, client needs, and data structure. These five methods work well at top agencies:
1. Join-Based Blending
Connect datasets through common identifiers like time periods, campaign IDs, geographic regions, or customer segments. Use this with structured data that has clear relationships.
- Works best for: Agencies with structured data that has defined hierarchical relationships
- How to set up: Create a dimensional model with consistent join keys across platforms
- Real example: Combine campaign metrics from different ad platforms using standard naming
Join-based blending forms the foundation for most data strategies and offers the simplest path to implementation.
2. Virtualization Blending
Handle data sources separately and combine results during analysis without physically merging data. Create dynamic views that update automatically when source data changes.
- Works best for: Projects that need real-time insights with frequently changing data
- How to set up: Use business intelligence tools that support virtualization (Tableau, Power BI)
- Real example: Create live marketing dashboards without nightly data processing
Virtualization stands out as the most responsive method, allowing quick reporting updates without complete ETL cycles.
3. Primary/Secondary Source Blending
Set one data source as primary (ad platform metrics) and add details from secondary sources (CRM data). This connects datasets with different detail levels.
- Works best for: Agencies combining data sources with various detail levels
- How to set up: Keep primary dataset details while adding enhancement data from secondary sources
- Real example: Add customer value data (secondary) to campaign metrics (primary)
This method solves the basic challenge of connecting detailed marketing data with broader business performance metrics.
4. Tool-Specific Blending
Use dedicated marketing platforms that come with built-in connections to standard data sources. Make technical aspects simpler while keeping user-friendly interfaces for marketers.
- Works best for: Agencies that want quick implementation with minimal tech investment
- How to set up: Choose platforms like Swydo, Supermetrics, or Datorama with ready-made marketing data connectors
- Real example: Build client dashboards that combine Google, Meta, and LinkedIn data
Tool-specific approaches give immediate results for agencies without large technical teams.
5. Custom Development Blending
Build your own solutions using Python, R, SQL, or custom data pipelines. Get maximum flexibility but need substantial technical expertise.
- Works best for: Agencies with enterprise clients or unique data requirements
- How to set up: Write code with specialized programming languages and orchestration tools
- Real example: Build custom attribution models that include offline conversion data
Custom development gives unlimited possibilities but requires significant technical talent investment.
Use multiple blending approaches based on specific project needs. Start with simpler techniques and move toward more advanced methods as your team skills grow.
What Clients Want from Data Blending
Research reveals four key client demands that data blending uniquely addresses:
Business Outcome Focus: Clients want business results, not platform metrics.
PLATFORM METRICS              BUSINESS OUTCOMES
Impressions, CTR         →    Revenue attribution, Customer LTV
Engagement, Mentions     →    Acquisition costs, Market share
Actionable Insights: Effective blending delivers clear action plans with specific recommendations, anomaly detection, and cross-channel opportunity alerts. One retail client increased ROAS 32% using a blended alert system that identified underperforming categories across platforms.
Contextual Understanding: Provide competitive benchmarking, trend analysis, and business implications—not just raw numbers.
Strategic Partnership: Agencies using data blending as a strategic tool command 30% higher fees and maintain 2.3x longer client relationships by delivering proactive insights that connect marketing to broader business goals.
How Leading Agencies Are Using Data Blending Today
Move beyond theory to examine exactly how successful agencies apply data blending to solve real client challenges. The most effective agencies implement a progressive approach that begins with foundational integration and builds toward sophisticated analysis:
1. Cross-Platform PPC Integration for Complete Budget Visibility
Modern marketing agencies manage campaigns across multiple ad platforms (Google Ads, Facebook, LinkedIn, TikTok, etc.), creating data silos that obscure the full picture of marketing performance.
Data Sources to Blend:
- Campaign data from all paid media platforms (Google, Meta, LinkedIn, TikTok, etc.)
- Cost, impression, and click data from each platform
- Conversion tracking from platforms and website analytics
- UTM parameter data for consistent tracking
- CRM data for post-click customer journey analysis
The Process:
- Standardize naming conventions and metrics across all platforms
- Normalize time periods to ensure consistent reporting windows
- Create unified client IDs and campaign hierarchies
- Develop cross-platform attribution logic
- Build automated data pipelines for daily refreshes
The Results:
- Complete visibility into total marketing spend across all platforms
- Accurate cross-platform ROAS and CPL/CPA metrics
- Identification of audience overlap across platforms
- Platform-agnostic budget optimization opportunities
- Enhanced ability to shift budget to highest-performing channels
- Streamlined reporting that connects investments to outcomes
This fundamental blending creates the foundation for more advanced analyses by establishing a unified data layer with consistent metrics across platforms.
2. Cross-Platform Creative Performance Analysis
With the unified platform data in place, agencies can now address a more complex challenge: modern campaigns deploy variations of creative assets across dozens of platforms, making it nearly impossible to determine which creative approaches truly resonate.
Implementation Approach:
┌─────────────────────┐           ┌──────────────────────┐           ┌─────────────────────┐
│  DATA COLLECTION    │           │  STANDARDIZATION     │           │  ANALYSIS           │
│                     │           │                      │           │                     │
│ • Creative assets   │    →      │ • Unified taxonomy   │     →     │ • Performance       │
│   from all platforms│           │   across platforms   │           │   by element        │
│ • Performance data  │           │ • Normalized         │           │ • Cross-platform    │
│   by platform       │           │   engagement scores  │           │   effectiveness     │
│ • Client conversion │           │ • Time-normalized    │           │ • Regression        │
│   metrics           │           │   measurements       │           │   analysis          │
└─────────────────────┘           └──────────────────────┘           └─────────────────────┘
This approach builds upon the cross-platform PPC data integration by adding creative asset analysis to reveal which creative elements dramatically outperform others regardless of platform—insights that remain invisible when viewing platform-specific reports.
By blending the unified platform performance data with creative asset information, agencies can make data-driven decisions not just about where to allocate budget, but also which creative approaches deserve more investment.
3. Connecting Online Advertising to Offline Conversions
With cross-platform visibility and creative analysis in place, agencies can tackle even more complex challenges like connecting digital efforts to physical world outcomes.
Retail clients often struggle to connect digital marketing efforts to in-store purchases. Building on the integrated data foundation, agencies can solve this challenge by further blending:
Additional Data Sources:
- Geographic ad impression data (already collected in step 1)
- Store location databases
- Point-of-sale transaction records
- Local weather and event data
The Process:
- Establish clean geographic identifiers across all datasets
- Create normalized time windows for analysis
- Develop custom visit attribution logic based on typical customer journey timing
- Model the relationship between digital exposure and in-store activity
The Results:
- Precise measurement of how digital campaigns drive foot traffic
- Geographic optimization that improves ROAS by 30-40%
- Ability to demonstrate true omnichannel ROI to clients
- Justification for increased media budgets based on full-funnel impact
This approach extends the value of your cross-platform integration by connecting digital activities to real-world outcomes.
4. Multi-Touch Attribution Without Platform Dependencies
With a comprehensive data foundation now in place, agencies can achieve the “holy grail” of marketing analytics: attribution that remains effective despite platform changes and privacy regulations.
This most advanced application of data blending builds upon all previous layers by adding:
Additional Data Sources to Blend:
- Ad platform click and impression logs (already available from step 1)
- Website analytics data (already available from step 1)
- CRM touchpoint records (already available from step 1)
- Post-purchase survey responses
- Industry benchmarks for typical conversion paths
Key Benefits of This Approach:
- Privacy Compliance: Works within 2025’s restrictive privacy landscape
- Client Customization: Adapts to each client’s business model and sales cycle
- Platform Independence: Not vulnerable to third-party cookie deprecation
- Business Relevance: Connects to actual business outcomes, not proxy metrics
- Flexibility: Evolves as client needs and regulatory landscape change
Stop forcing clients into standardized attribution models. This comprehensive approach to data blending creates bespoke attribution frameworks that reflect each client’s unique customer journey while respecting current privacy constraints.
The Data Blending Process: A Visual Guide
To better understand how data blending transforms agency operations, let’s visualize the complete process. The following interactive flowchart illustrates the four key stages of effective data blending that leading agencies implement. Each stage builds upon the previous one to create a comprehensive analytics capability that delivers measurable client value.
Click on each stage to explore the specific tasks, considerations, and strategic insights that make data blending such a powerful approach for marketing agencies. Note how specialized tools like Swydo can simplify this process with built-in connectors to popular marketing platforms.
The Data Blending Process for Marketing Agencies
How successful agencies transform fragmented platform data into unified client insights
Data Collection Methods
- API connections for automated refreshes
- Database connections for CRMs
- Manual uploads for client spreadsheets
- Web scraping for competitive data
Key Considerations
- Authentication management
- API rate limits and quotas
- Data collection frequency
- Raw data storage solutions
Swydo Solution:
Automatically connects with 30+ marketing platforms, handling authentication and rate limits with built-in connectors.
Strategic Insight:
The average marketing agency manages data from 7-12 platforms per client. Automating collection across these sources saves 15-20 hours of analyst time per week.
Standardization Tasks
- Normalizing naming conventions
- Creating consistent date formats
- Establishing unified hierarchies
- Aligning metrics definitions
Data Cleaning Tasks
- Removing duplicate records
- Handling missing values
- Correcting formatting issues
- Validating data ranges
Quality Control Checkpoints:
- Schema validation
- Expected value ranges
- Completeness checks
- Format standardization
Strategic Insight:
Agencies report that 73% of data errors occur due to inconsistent naming conventions and metric definitions across platforms. Thorough standardization eliminates most of these issues.
Join Strategy
- Identify common dimensions
- Create reliable join keys
- Determine appropriate join types
- Validate relationships
Calculated Metrics
- Cross-platform KPIs
- Custom attribution models
- Business impact calculations
- Trend and anomaly indicators
Common Join Dimensions:
- Time periods
- Campaign IDs
- Geographic units
- Customer segments
- Product categories
Strategic Insight:
Agency leaders report that creating a well-designed dimensional model for blending can reduce analysis time by 40% while increasing insight accuracy by 35%.
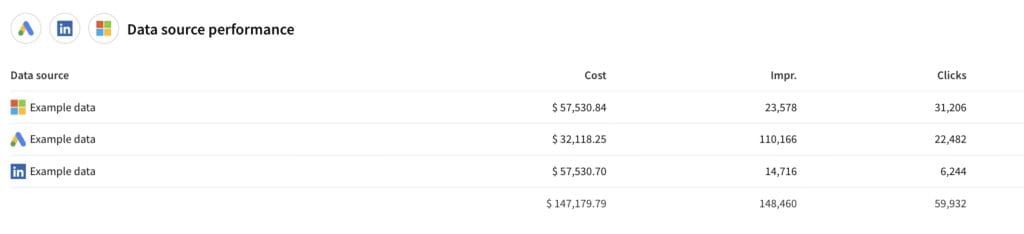
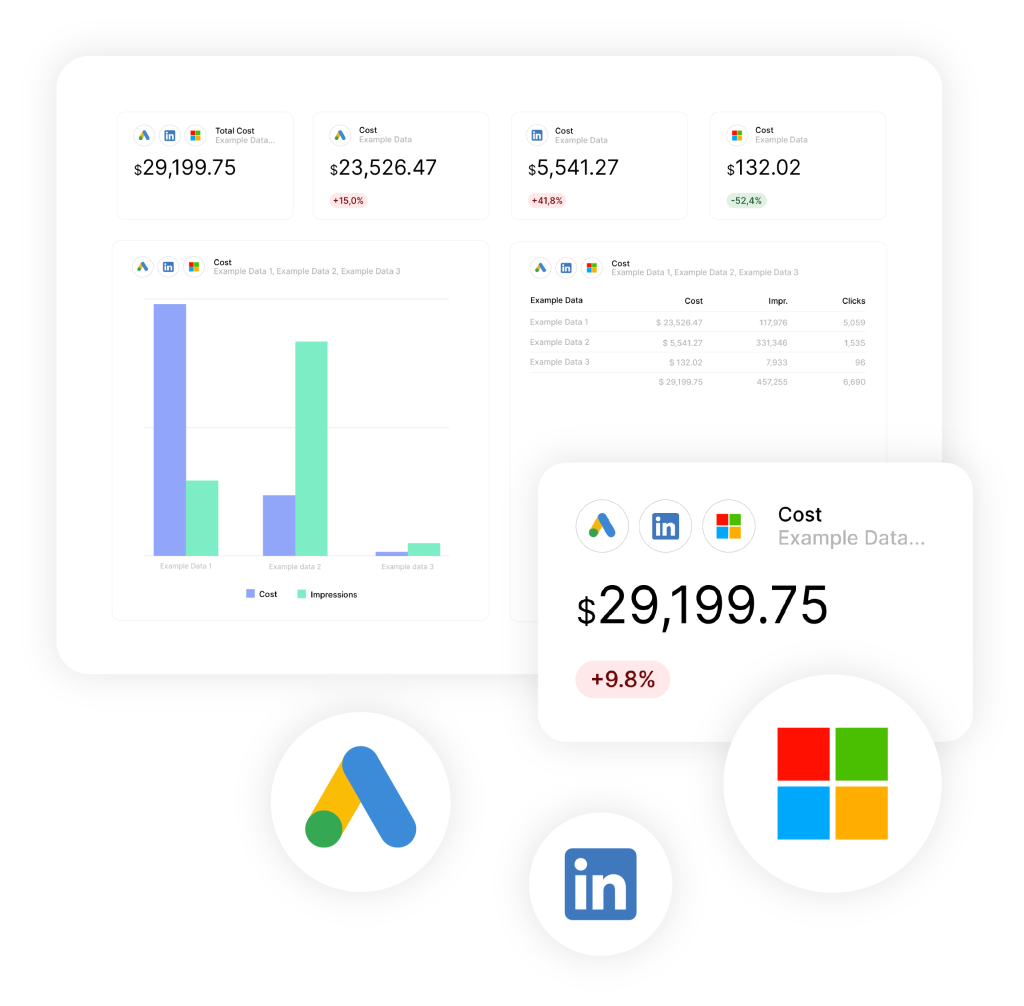
Unified Dashboard Example:
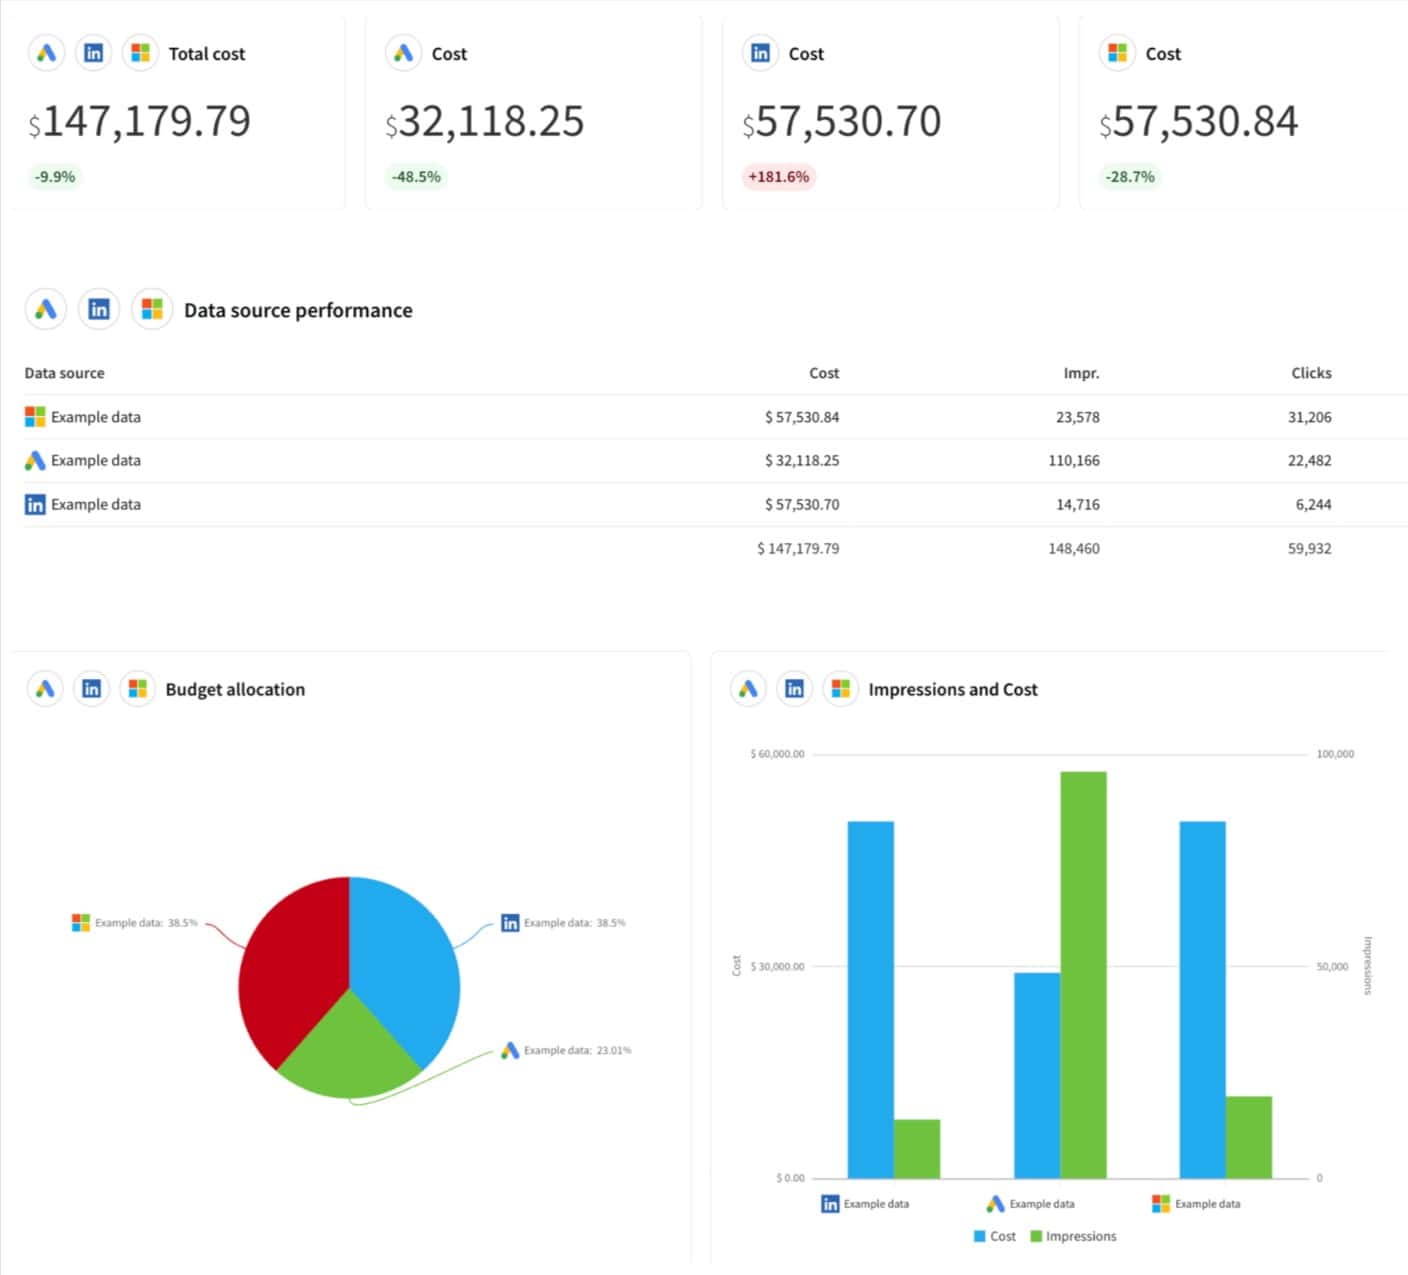
Refer to the Swydo dashboard screenshot above for an authentic example of unified reporting that combines data from multiple platforms (Google Ads, LinkedIn, Microsoft Ads) into a single view, showing:
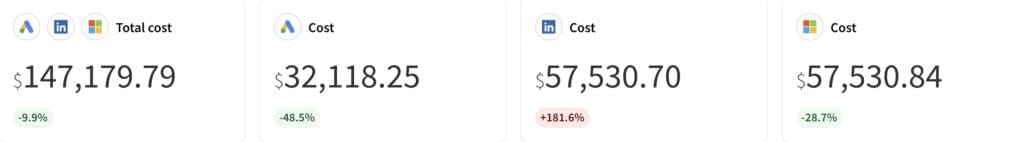
- → Total campaign costs across all platforms ($147,179.79)
- → Platform-specific costs with performance indicators
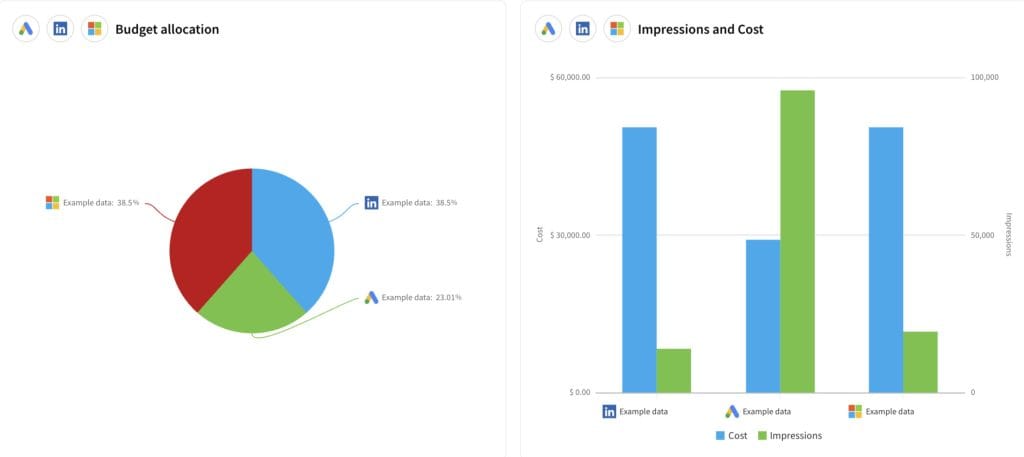
- → Visual budget allocation across platforms (pie chart)
- → Comparative analysis of impressions and costs (bar chart)
- → Data source performance with click and impression metrics
This type of unified dashboard provides clients with a comprehensive view of marketing performance across all channels in one consistent interface.
Strategic Value
- Demonstrate clear business impact
- Connect marketing to revenue
- Enable cross-channel optimization
- Identify new growth opportunities
Agency Benefits
- Win larger clients (27% higher win rates)
- Retain clients longer (43% longer relationships)
- Command premium rates (15-30% higher fees)
- Scale analytics without scaling team
Key Output Types:
- Executive summaries
- Strategic recommendations
- Cross-platform dashboards
- Anomaly alerts
- ROI forecasts
Strategic Insight:
Agencies implementing comprehensive data blending report ROI exceeding 300% in the first year through new business wins, expanded scopes, and operational efficiency gains.
Pro Tip: Start your data blending journey with a single high-value use case that demonstrates clear ROI. Most agencies begin with cross-platform PPC integration before expanding to more complex blends like multi-touch attribution and offline conversion analysis.
Tool Selection: Agencies can either build custom data blending solutions using tools like Tableau and Alteryx, or use specialized marketing platforms like Swydo that have built-in data blending capabilities with 30+ marketing platform integrations and white-label reporting.
Now that you understand the data blending process from end to end, let’s explore the essential tools that make this approach possible.
The Essential Data Blending Toolkit for Agencies
Select from these essential tools for agency-specific data blending needs:
Data Blending Tools for Agencies in 2025
Tableau
For Teams Starting Their Journey
- Visual interface accessible to non-technical users
- AI-powered join recommendations
- Strong visualization capabilities
- Extensive connector library
Ideal For: Agencies with strong visual reporting needs and limited coding resources
Microsoft Fabric
For Teams Starting Their Journey
- Integration with Office 365 ecosystem
- Automated data cleaning
- Built-in AI capabilities
- Familiar interface for Excel power users
Ideal For: Agencies already operating in the Microsoft ecosystem
Swydo
For Teams Starting Their Journey
- 30+ marketing platform integrations
- White-label reporting capabilities
- Automated reporting schedules
- Built-in client approval workflows
Ideal For: Agencies seeking streamlined marketing reporting with client-friendly dashboards
Alteryx
Advanced Capabilities
- No-code environment for complex workflows
- Comprehensive data preparation capabilities
- Robust spatial analytics
- Strong automation features
Ideal For: Agencies with sophisticated data needs but limited coding resources
Datorama by Salesforce
Advanced Capabilities
- AI-driven marketing intelligence
- Advanced data harmonization
- Native integration with Salesforce
- Marketing-specific data models
Ideal For: Agencies with Salesforce-centric clients or ecosystems
Snowflake + dbt
Advanced Capabilities
- Enterprise-grade infrastructure
- Scalable for any data volume
- Complete customization control
- Data sharing capabilities
Ideal For: Agencies with technical resources and enterprise clients
The Open-Source Alternative
Airbyte + Python/R: For agencies with technical talent but budget constraints, this combination provides incredible flexibility.
Implementation Requirements:
- Data engineers or analysts with coding experience
- Infrastructure for hosting and scheduling
- Knowledge of data modeling principles
- Commitment to maintaining custom solutions
Advantages:
- Zero licensing costs (beyond infrastructure)
- Maximum customization potential
- No artificial limitations on data sources
- Complete ownership of your solution
The right choice depends on your team’s technical capabilities, client portfolio, and reporting complexity. Most successful agencies maintain capabilities in at least two tools—one accessible to all strategists and another for complex analytical requirements.
How to Build Your Agency’s Data Blending Process
Implement effective data blending with both a structured technical process and the right organizational framework.
Technical Implementation Process
Start with a thorough data audit. Document all data sources across clients and platforms, mapping structures and identifying critical metrics. Most agencies discover they’re tracking over 100 metrics across clients, yet only 20-25 are truly essential for demonstrating value. This insight alone can dramatically streamline your initiative.
Data Audit Checklist
- [ ] Document all data sources across clients and platforms
- [ ] Map data structures (fields, metrics, dimensions) in each source
- [ ] Assess data quality issues in each source
- [ ] Identify refresh frequencies and update dependencies
- [ ] Document current data combination processes
- [ ] Catalog reporting requirements from all stakeholders
- [ ] Identify critical vs. nice-to-have metrics
- [ ] Note current pain points in data processing workflow
Develop a flexible connection strategy that accommodates different data types. Consider how API connections to major platforms differ from database integrations or manual uploads. Each approach has distinct advantages and maintenance requirements, so design a system that maintains consistency across these different methods.
Connection Method Comparison:
| Method | Best For | Considerations | Maintenance Needs |
|---|---|---|---|
| API Connections | Major platforms (Google, Meta, LinkedIn, TikTok) | • Most reliable data pipeline • Automated refreshes • Complete datasets | • API changes require updates • Rate limits for large accounts • Authentication management |
| Database Connections | Client CRMs, internal databases | • Direct access to structured data • Potentially real-time access | • Security requirements • Data residency restrictions • Connection credentials management |
| Manual Upload Integration | Client-provided spreadsheets, reports without APIs | • Access to otherwise unavailable data • Client-specific calculations | • Error-prone • Labor intensive • Template standardization needed |
| Web Scraping | Competitive intelligence, public data | • Access to unstructured public data • Competitive insights | • Frequent breakage • Legal/TOS compliance • Unstructured data challenges |
Create a well-designed data model that connects disparate sources logically. Your model should establish clear dimensions for joining data (like time periods and campaign identifiers), standardize naming conventions, and calculate meaningful cross-platform KPIs. Remember that your model should reflect how clients think about their business, not how platforms organize data.
Core Components of Your Data Model:
┌───────────────────────────┐
│ DIMENSIONS (Join Keys)    │
│                           │
│ • Dates/Time Periods      │
│ • Campaign/Ad Identifiers │
│ • Geographic Units        │
│ • Customer Segments       │
│ • Product Categories      │
└───────────┬───────────────┘
            │
            ▼
┌───────────────────────────┐
│ STANDARDIZATION LAYER     │
│                           │
│ • Consistent Naming       │
│ • Normalized Hierarchies  │
│ • Unified Classifications │
│ • Common Time Granularity │
└───────────┬───────────────┘
            │
            ▼
┌───────────────────────────┐
│ CALCULATED METRICS        │
│                           │
│ • Cross-Platform KPIs     │
│ • Derived Measures        │
│ • Blended Performance     │
│   Indicators              │
└───────────────────────────┘
Implement comprehensive quality control at multiple stages of the process. Quality checks should occur before blending (validating incoming data), during the blending process (verifying joins and relationships), after blending (reconciling with source systems), and on an ongoing basis (monitoring for anomalies). This layered approach prevents small errors from becoming major discrepancies.
Data Blending Quality Control Framework
Data blending magnifies quality issues—small problems in individual sources become major discrepancies in blended outputs. Implement this comprehensive framework to ensure reliable insights.
PRE-BLEND
- Schema validation ensures consistent data structures
- Expected value ranges prevent outlier contamination
- Completeness checks identify missing data points
- Format standardization ensures consistent handling
DURING BLEND
- Join key validation ensures proper relationships
- Relationship verification confirms data linkages
- Duplicate detection prevents inflated metrics
- Transformation logging maintains audit trail
POST-BLEND
- Total reconciliation against source systems
- Sample verification against manual calculations
- Trend consistency checks across time periods
- Business logic validation by subject experts
ONGOING
- Anomaly detection identifies unexpected changes
- Change monitoring tracks platform updates
- Version control maintains calculation history
- Regular audits ensure continued accuracy
Design a multi-layered output strategy that matches stakeholder needs. Create executive summaries for leadership, optimization recommendations for tactical teams, real-time dashboards for operations, and exploratory tools for analysts. The most sophisticated agencies create multiple views from the same blended dataset.
Organizational Framework
Choose the right team structure for your agency. Successful models include centralized analytics teams that ensure consistency, embedded analysts who develop deep client knowledge, hub-and-spoke models that balance standardization with customization, or hybrid approaches with outsourced technical foundations.
Agency Output Framework
Strategic Layer
- Executive summaries highlighting cross-channel insights
- Strategic recommendations based on blended analysis
- Business impact assessments connecting marketing to outcomes
Tactical Layer
- Campaign optimization recommendations
- Channel allocation guidance
- Creative performance analysis
Operational Layer
- Automated cross-platform reporting
- Real-time performance dashboards
- Anomaly alerts and notifications
Foundation Layer
- Self-service data exploration tools
- Data dictionaries and documentation
- Scheduled raw data exports
The most sophisticated agencies create multiple outputs from the same blended dataset, serving different stakeholders with customized views of the same underlying data.
Develop a balanced skill portfolio across your team. Technical foundations in data modeling and API integration must be complemented by strategic capabilities in marketing measurement and data storytelling. Process skills like governance and requirement gathering keep projects on track.
Many agencies partner with specialized training platforms to develop these capabilities systematically. While the first cross-platform dashboard typically takes 4-6 weeks to develop, each subsequent implementation becomes significantly faster as team capabilities mature.
Overcome Common Data Blending Challenges in Agency Settings
Even well-planned data blending initiatives encounter obstacles. Overcome the most common challenges with these strategies:
Platform Data Discrepancies
The Problem: Different platforms report seemingly identical metrics (impressions, clicks, conversions) with wildly different methodologies and numbers.
The Solution:
- Create platform-specific normalization factors based on historical data
- Develop blended metrics that use consistent definitions across platforms
- Maintain separate “raw” and “normalized” versions of key metrics
- Document methodology differences for client transparency
One effective approach: develop index-based metrics that show relative performance rather than combining raw numbers that aren’t truly comparable.
Client Data Access Limitations
The Problem: Clients restrict access to critical data sources, limiting your ability to create comprehensive blends.
The Solution:
- Develop a tiered blending approach that adds value even with limited data
- Create client-specific data sharing agreements with clear security provisions
- Demonstrate the value of complete data sharing through limited pilots
- Offer on-premise or client-controlled processing options for sensitive data
Progressive agencies develop “zero knowledge” blending approaches where sensitive client data never leaves their environment while still enabling cross-platform analysis.
Scale and Performance Issues
The Problem: As your agency grows, data volumes explode, and blending processes become unsustainably slow.
The Solution:
- Implement incremental processing that only handles new or changed data
- Create optimized aggregation tables for frequently used metrics
- Separate historical analysis (processed less frequently) from current reporting
- Consider distributed processing platforms for extremely large datasets
Resolve performance challenges with a tiered data architecture: refresh daily tactical data continuously, while processing deeper historical blends weekly with more comprehensive transformation.
Maintaining Flexibility Across Clients
The Problem: Each client has unique definitions, metrics, and analysis requirements that resist standardization.
The Solution:
- Build a modular blending framework with customizable components
- Create client-specific configuration layers on top of standardized processes
- Develop a core set of universal metrics supplemented by client-specific extensions
- Implement template-based approaches that allow rapid customization
The most successful approach combines a standardized core (80% consistent across clients) with a customization layer that adapts to each client’s unique requirements.
Measure the ROI of Your Data Blending Investment
Data blending demands significant investment in tools, talent, and processes. Track these metrics to quantify your returns and justify continued investment:
Direct Revenue Impact
| Metric | Industry Benchmark | How to Measure |
|---|---|---|
| New Business Win Rate | +27% for agencies with advanced blending | Track win percentage for pitches using blended data vs. standard analytics |
| Expanded Client Scope | 3.2 additional services per client annually | Document new services sold based on cross-platform insights |
| Client Retention | 43% longer average relationship duration | Compare client retention rates pre- and post-blending implementation |
| Premium Pricing | 15-30% higher fees | Measure rate differences between blended vs. standard reporting services |
Operational Efficiency
Analyst Productivity: Measure time savings (typically 15-20 hours weekly per analyst) using before/after time tracking on reporting tasks
Error Reduction: Track reporting corrections and revisions (expect 70%+ reduction in error rates)
Delivery Speed: Measure turnaround time for cross-platform analysis requests (4x faster with mature blending)
Strategic Value Metrics
Campaign Performance: Compare mid-campaign optimizations driven by blended data against historical benchmarks (18-22% improvement)
Budget Reallocation: Quantify spend shifted between channels based on cross-platform insights (typically 15-30% of budget)
Client Relationship Level: Track meeting participation by client executives before and after implementing blended reporting
Most agencies see ROI exceeding 300% within the first year through this combination of revenue growth and operational efficiency.
Conclusion
The most successful marketing firms now connect fragmented platform data into clear business insights that clients actually value.
Marketing agencies face a new reality. Clients no longer accept separate reports from each platform that don’t connect to their business goals. They want to see exactly how marketing activities drive revenue and growth.
Take These Steps Now
- Pick One Valuable Project First: Start with combining data from major ad platforms for an important client. This often shows budget opportunities you can’t see when looking at each platform separately.
- Focus on Your Team’s Skills: Good tools help, but your people make the difference. Train your analysts to find meaningful patterns in combined data and explain what those patterns mean for clients.
- Make Combined Analytics Central: Build your client relationships around insights from unified data. Show how you see patterns across platforms that other agencies miss.
What This Means For Your Agency
Agencies have a choice: keep showing clients disconnected data they find less valuable each year, or provide the comprehensive view that connects marketing directly to business results.
The agencies that excel at data blending win bigger clients, charge higher rates, and build deeper client relationships based on strategic value rather than just tactical execution.
Data blending has moved beyond a technical nice-to-have. It now forms the foundation for how leading agencies prove their worth, make strategic recommendations, and grow their business.
Turn fragmented data into powerful insights your clients will love.
Start Your Free Trial Today