
Google Ads best practices are the strategies, settings, and workflows that consistently lower your costs, increase conversions, and deliver stronger returns across every campaign type. Think of Google Ads like a high-performance engine: it can take you anywhere, but without the right fuel, tuning, and a driver who actually knows the road, you’re just burning money in the driveway.
Right now, the average cost per click sits at $5.26—up almost 13% year over year, according to WordStream’s 2025 Google Ads Benchmarks Report. Meanwhile, conversion rates only improved about 7%. That gap means your optimization has to be sharper than ever just to keep results steady. And with Google’s AI now making more decisions about where your client’s budget goes, the agencies that win are the ones who know how to guide that AI—not the ones who hand over the keys and hope for the best.
This guide is built for you—the person managing multiple accounts, explaining reports to clients who don’t know what a CPC is, and trying to figure out what actually works right now. Every recommendation is backed by current data, and we cite our sources so you can verify anything yourself.
The Benchmarks Your Campaigns Should Be Measured Against
Before we talk strategy, let’s get grounded. These are the numbers that define “normal” on the platform right now. If your campaigns are significantly above or below these, you know where to dig.
2025–2026 Industry Snapshot
The Numbers Your Campaigns Are Being Measured Against
Five metrics every agency should have memorized
Avg. Cost Per Click
$5.26
▲ 12.88% YoYClick-Through Rate
6.66%
▲ 3.74% YoYConversion Rate
7.52%
▲ 6.84% YoYCost Per Lead
$70.11
▲ ~5% YoYGoogle Ad Revenue
$264.6B
▲ 11.2% YoYSource: WordStream/LocaliQ 2025 Benchmarks (16,446 US search campaigns, April 2024 – March 2025); Alphabet SEC Filing Q4 2024.
Source: WordStream/LocaliQ 2025 Benchmarks — 16,446 US search campaigns, April 2024–March 2025
The pattern here matters. Costs are climbing faster than performance is improving. That’s not a death sentence—it’s a signal. If you’re not actively optimizing, the platform is getting more expensive for your clients without them getting more from it. But if you are optimizing, there’s a real opportunity to outperform competitors who are just letting campaigns run on autopilot.
Knowing the benchmarks is step one. Watching your clients’ accounts against them week over week is where the real work happens — and doing that across 20, 50, or 100 accounts in the Google Ads UI isn’t realistic. This is exactly what cross-client monitoring tools are built for.
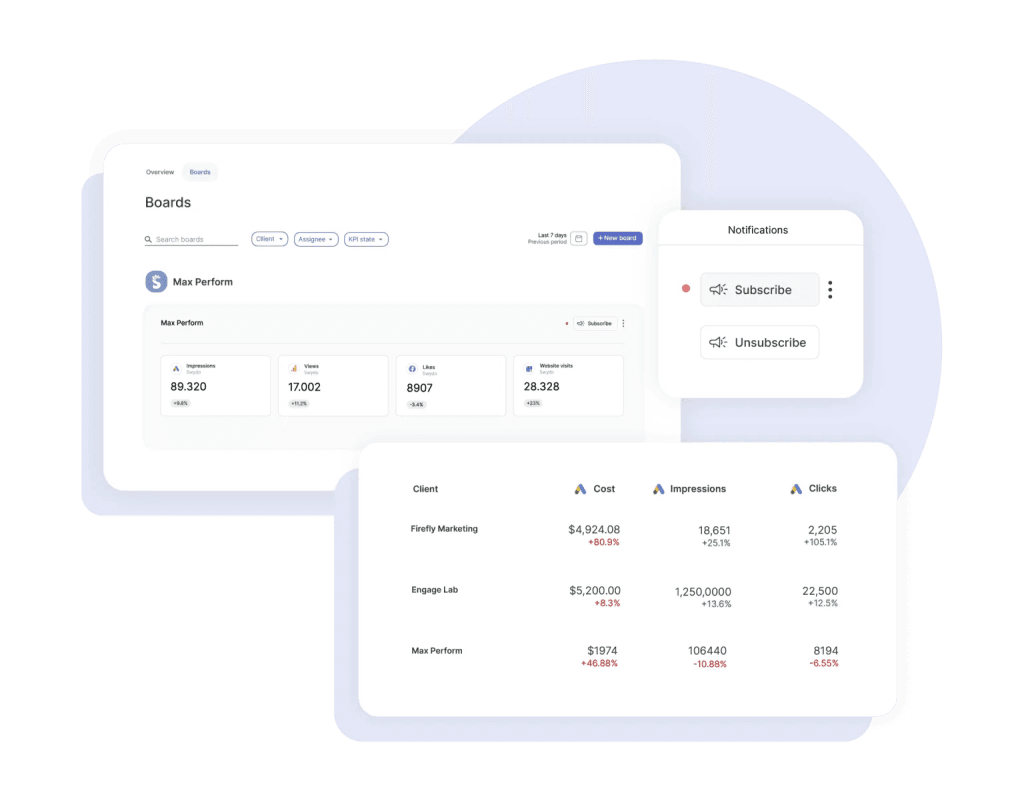
In Swydo, for example, a Monitoring Overview surfaces up to six KPIs across every client in a single view, so you can spot the account whose CPC jumped 20% this week before the client notices it on their invoice. Pair that with Monitoring Boards that trigger alerts when a KPI crosses a threshold, and the “am I actually keeping up?” question answers itself.
Not All Campaign Types Are Created Equal
When a client asks you “where should we spend our money,” this table is your answer. The return differences between campaign types are significant—and most clients have no idea.
Campaign Performance Benchmarks
Where Your Ad Dollar Actually Works Hardest
Median ROAS by campaign type — based on analysis of 5,000+ Google Ads accounts
Search returns 43x more than Display per dollar spent. If a client asks you to “just run PMax for everything,” this is your evidence. Display still earns its place — but only as retargeting support, not as a primary driver.
Source: Focus Digital analysis of 5,000+ Google Ads accounts. Figures represent median ROAS across accounts.
Source: Focus Digital’s 2025 ROAS analysis of 5,000+ accounts.
Search delivers nearly double the return of PMax and five times what Shopping does. So when a client asks to “just run PMax for everything,” this is your evidence for why that doesn’t make sense. Search captures people who are actively looking to buy. PMax spreads budget across channels where intent is much lower.
Now, Display at 0.12:1 looks terrible in isolation. And for direct response, it is. But if you’re using it strictly for retargeting people who already visited a product page, it supports your Search and Shopping campaigns in ways that don’t show up cleanly in one metric. Context matters.
If you’re presenting these tradeoffs to clients, side-by-side ROAS by campaign type is one of the single most persuasive visuals you can show — a Google Ads report template with ROAS broken out by campaign type saves you from rebuilding that view every month.
Search Campaigns: Where the Highest Returns Come From
Search is your highest-intent channel. It’s where someone types “brake repair near me” and means it. Getting Search right is the foundation everything else builds on.
The Keyword Strategy That Works Right Now
The old approach—massive exact match lists, single-keyword ad groups, obsessively granular structures—is dead. It starves your ad groups of data, which means Smart Bidding can’t learn fast enough to optimize effectively.
What works instead is the barbell strategy: exact match for your brand terms and high-value bottom-funnel keywords where you need tight control, and broad match paired with Smart Bidding for discovery and scaling. According to Google’s broad match guide, advertisers switching from phrase to broad match see roughly 25% more conversions on target CPA. But the critical caveat is “with Smart Bidding.” Broad match without automated bidding is still a budget black hole.
Users are also searching more conversationally now—typing full questions instead of two-word phrases—which means your keyword strategy has to account for natural language queries, not just traditional short-tail terms.
Your weekly keyword routine should include:
- Mining search terms at least weekly. Compare the last 7 days against the previous 7. During the first week of any new campaign, check daily.
- Maintaining a master negative keyword list applied across all campaigns in your MCC. One bad match in one campaign will appear in others.
- Watching for AI Max queries if you’re testing that feature. AI Max layers keywordless matching onto Search campaigns, which means queries can come in that have nothing to do with your keyword list. Google now allows up to 25 term exclusions per campaign to manage this—use every one of them.
RSA Optimization: Ad Strength Is Not What You Think It Is
Fill all 15 headlines and 4 descriptions. That’s non-negotiable—it gives Google the maximum combinations to test. But the metric Google pushes you toward can actually mislead you.
Google wants you to achieve “Excellent” Ad Strength. And you should aim for at least “Good.” But here’s what matters: as Brad Geddes of Adalysis writes in Search Engine Land, their research consistently finds that lower Ad Strength ads sometimes deliver higher conversion rates. Why? Because Ad Strength measures Google’s ability to remix your messaging. The higher your score, the more control Google has over what appears. That’s not the same thing as better performance.
Since June 2025, Google shows per-asset performance data—individual click and conversion metrics for each headline and description. Use that data instead of chasing a vanity score. If a headline with “Average” Ad Strength is converting better than a “Best” one, keep it.
A few rules that consistently hold up:
- Put your target keyword in at least 30% of headlines.
- Pin only what’s truly critical—your brand name in Headline 1, required legal disclaimers. Over-pinning kills the testing process.
- Write each headline to work independently. They can appear in any position, so sequences that only make sense together will fall apart.
Account Structure: Why Simpler Performs Better
The more data you funnel into fewer campaigns and ad groups, the faster Smart Bidding learns. Group keywords by intent theme into broader ad groups. Separate brand, non-brand, and competitor campaigns with dedicated budgets.
And on day one of every new account, do two things: turn off auto-apply recommendations, and disable Search Partners. Both are defaulted on, and both will eat budget before you’ve had a chance to evaluate whether they add value.
Performance Max: Powerful When You Lead, Wasteful When You Don’t
PMax runs your ads across Search, Shopping, Display, YouTube, Gmail, Discover, and Maps—all from one campaign. That’s both its strength and its risk. Without guardrails, it’ll happily dump your B2B client’s budget into Display ads on mobile games.
The good news is you have significantly more control now than you did a year ago. Campaign-level negative keywords are available for all advertisers—and adding them made an immediate difference. One agency reported a 15% cost reduction on the day they implemented their negative list. You can also now see channel performance across Search, Shopping, Display, YouTube, and Maps, according to Google’s PMax reporting update. That means you can finally answer the question: “where is my money actually going?”
What separates agencies that succeed with PMax from those that don’t:
- Create separate asset groups by product or intent. Don’t dump everything into one group. Each needs at least 7 images across landscape, square, and vertical formats.
- Make your own videos. Google’s auto-generated ones underperform custom videos by 25–40%. Even a 15-second clip shot on a phone beats the AI slideshow.
- Budget matters for learning. Below $30–50 per day, the algorithm can’t collect enough data to optimize. Give it 2–3 weeks or 50–100 conversions before making major changes.
- Audience signals are hints, not targeting. Upload Customer Match lists, GA4 segments, and in-market audiences. PMax uses them as starting points, then expands beyond them.
One thing to monitor closely: Smarter Ecommerce’s analysis of 4,000+ PMax campaigns shows that overall PMax cost share has been declining—dropping about 6% from its 2024 peak—and some practitioners are shifting budget back to Standard Shopping and Search for better transparency. If your PMax campaigns aren’t performing, don’t assume the problem is your settings. It might be the campaign type itself for that particular client.
Shopping Campaigns: Your Feed Matters More Than Your Bidding
Here’s a truth most agencies learn the hard way: in Shopping campaigns, your product feed is the single most important factor. A mediocre feed with a great bidding strategy will always lose to a great feed with average bidding.
What does a strong feed look like?
- Product titles front-load brand, product type, and key attributes within 150–160 characters. Don’t start with your brand name unless it’s a major purchase driver—start with what the customer is actually searching for.
- Every attribute is filled, including optional ones. Color, size, material, GTIN, MPN—all of it. Google uses these for matching. Missing attributes mean missed impressions.
- Custom labels segment products by margin, best-seller status, and seasonality. This lets you bid differently on high-margin products versus clearance items—a distinction the algorithm can’t make on its own.
Shopping ads still deliver CPCs about 43% lower than Search and CPAs about 14% lower. For e-commerce clients, this channel is a no-brainer—but only if the feed is right.
Demand Gen: The Campaign Type Most Agencies Are Underusing
If your clients already run Meta campaigns, Demand Gen is the Google equivalent you should be testing right now. It places your ads across YouTube, Discover, Gmail, and the Google Display Network—reaching over 3 billion monthly active users, according to Google’s official Demand Gen documentation.
Two stats stand out. First, advertisers using both video and image assets in Demand Gen saw 20% more conversions at the same CPA. Second, 68% of Demand Gen conversions come from users who never interacted with any other Google campaign. That’s not recycled traffic. That’s genuinely new customers.
If you’re transitioning from the old Video Action Campaigns (which are now fully deprecated), don’t move all your budget at once. Start at about 10%, scale to 50% after a couple weeks of stable performance, then go to 100%. The algorithm needs time to learn the new format.
How to Choose the Right Bidding Strategy
This is where Google reps and your actual experience often disagree. They’ll push Smart Bidding on day one. But Smart Bidding needs conversion data to work, and a new account with 5 conversions last month doesn’t have enough.
Decision Tree · Interactive
Which Bidding Strategy Should You Actually Use?
Google reps push Smart Bidding from day one. That’s often wrong. Answer two questions to find your fit.
Question 1
How many conversions does this account generate per month?
Question 2
What’s the primary goal?
Recommended Strategy
Manual CPC
Data Required
None
Best For
New accounts, market testing, tiny budgets
Recommended Strategy
Max Conversions
Data Required
~15 conv/month
Best For
Data collection phase before tCPA/tROAS
Recommended Strategy
Target CPA
Data Required
15–30 conv/month
Best For
Lead gen with a known target cost per acquisition
Recommended Strategy
Target ROAS
Data Required
30+ conv/month
Best For
E-commerce with clear product margins
Framework based on Google’s Smart Bidding guide.
A detail that trips up even experienced managers: when you’re on Smart Bidding, your manual bid adjustments for device, location, schedule, and demographics don’t actually do anything. The algorithm handles those signals automatically. The only manual adjustment that still works is setting mobile to -100% to exclude it entirely.
Advertisers who switch from target CPA to target ROAS typically see about 14% more conversion value. If your client has solid conversion value data, that switch is worth testing—just make sure the values feeding into the system are accurate first.
Conversion Tracking: Fix This Before You Touch Anything Else
If you take one thing from this entire article, let it be this: bad conversion tracking makes every other optimization worthless. Your bidding strategy, keyword research, and ad copy don’t matter if the data feeding those decisions is wrong. And this isn’t a theoretical risk—it’s the number one mistake across every expert analysis we reviewed.
Here’s what a solid tracking setup looks like:
- Use the Google Ads Conversion Pixel as your primary tag—not GA4. The Google Ads tag captures more conversions, handles cross-device attribution, and feeds Smart Bidding directly. GA4 imports are delayed, which means the bidding algorithm is working with stale data.
- Turn on Enhanced Conversions. According to Google’s Enhanced Conversions documentation, they deliver an average 10% uplift in measured conversions by supplementing your tags with hashed first-party data like email addresses. Google started auto-enabling this across accounts—but verify it’s actually active on yours.
- Set up server-side tracking. Ad blockers and browser restrictions prevent your client-side tags from firing more often than you think. Server-side implementations report 10–30% more conversions than client-side alone. For any account spending over $10K/month, this is no longer optional.
- Implement Consent Mode V2. It’s mandatory for EEA/UK advertisers and recommended for everyone else. As Dataslayer’s Consent Mode guide details, Advanced mode recovers 15–25% of conversions that would otherwise disappear when users decline cookies.
The Foundation
The Modern Conversion Tracking Stack
Each layer recovers conversions the previous one misses. Stack them all — bad tracking makes every other optimization worthless.
Google Ads Conversion Pixel
Your primary tag — not GA4. Captures cross-device and view-through attribution, integrates natively with Smart Bidding.
Baseline
Primary tag
Enhanced Conversions
Supplements tags with hashed first-party data like email and phone. No longer optional if you care about reporting accuracy.
+10%
Avg. uplift
Server-Side Tracking
Bypasses ad blockers and cookie restrictions that kill client-side tags. Becoming essential, not optional.
+10–30%
Recovered
Consent Mode V2 (Advanced)
Mandatory for EEA/UK. Recovers conversions that would otherwise be lost when users decline cookies.
+15–25%
Recovered
Tracking Misses 20%
Underbidding
Smart Bidding Targets Off By
20%
If your tracking underreports by 20%, your Smart Bidding targets are set 20% too high — meaning you systematically underbid on profitable traffic. Fixing tracking is often the single highest-ROI change you can make.
Think about what happens when tracking underreports by 20%. Your Smart Bidding targets get set 20% too high, which means you’re systematically underbidding on profitable traffic. Fixing tracking is almost always the highest-ROI change you can make—and it costs nothing but time.
Once your tracking stack is clean, your reporting has to pull from the right source too. If your Google Ads reports are importing conversions from GA4 instead of directly from Google Ads, your clients are seeing the same stale data the bidding algorithm was working with. Any decent reporting tool — Swydo included — lets you connect directly to the Google Ads API so the numbers in your client reports match what Smart Bidding is actually optimizing against.
Quality Score: The Hidden Lever That Controls What You Pay
If your client’s CPCs feel higher than they should be, Quality Score is probably the reason. Most agencies check it once during setup and forget about it. That’s a mistake, because the math is dramatic.
A Quality Score of 10 gives you a 50% CPC discount compared to the baseline of 5. A Quality Score of 1 inflicts a 400% penalty. Just moving from a 5 to a 7 cuts your CPC by about 28%. On a $50,000 monthly spend, that’s $14,000 in savings—or the same results at a lower budget.
Interactive · Try It
What Your Quality Score Is Actually Costing You
Drag the slider. Watch the math. A QS of 10 earns a 50% CPC discount — a QS of 1 inflicts a 400% penalty.
Baseline CPC ($)
Your Effective CPC
$5.26
No change vs. baselineA Quality Score of 5 is the baseline — you pay full CPC. Move to 7 and you save 28% on every click.
What Drives Your Quality Score
The three components aren’t weighted equally, and knowing which one to fix first saves you a lot of time:
- Expected CTR (~80% of the weight) — this is the big one. It’s driven by your ad copy’s relevance and appeal. Write ads people actually want to click.
- Landing Page Experience (~15%) — fast load times, mobile-friendly design, and content that delivers on the ad’s promise. A 1-second delay in mobile load time reduces conversions by up to 20%.
- Ad Relevance (~5%) — how closely your ad copy matches the keyword’s intent. This is the easiest to fix but the lowest impact.
Ads rated “above average” for both landing page experience and ad relevance showed CPCs 36% below the average. That discount compounds across every click, every day. If you’re not actively monitoring Quality Score, you’re leaving real money on the table.
First-Party Data: The Competitive Advantage Most Agencies Ignore
Safari and Firefox already block third-party cookies entirely. Chrome reversed its deprecation plan, but the trajectory is clear. The agencies that thrive are the ones building campaigns around first-party data, not the ones hoping cookies stick around.
The impact is measurable. Organizations using value-based bidding powered by first-party data report up to 50% improvements in ROAS. Customer Match lists using two identifiers (email + phone) are roughly 28% larger than single-identifier lists. Adding a third identifier bumps that another 35%.
Practically, this means three things for your accounts:
- Connect your client’s CRM to Google Ads through Data Manager. It’s the primary hub for feeding first-party data into campaigns, and it’s now fully available for all advertisers.
- Use Customer Match lists as audience signals in PMax, Search, and Demand Gen. These tell the algorithm what a valuable customer looks like—which is far more useful than Google’s generic in-market segments alone.
- Build custom segments from website visitors, app users, and offline customer lists. Similar Audiences are gone. Optimized Targeting powered by your first-party data is what replaced them.
Ask yourself: how many of your client accounts have CRM data connected to Google Ads? If it’s less than half, that’s probably your biggest untapped opportunity right now.
Why a Lower Optimization Score Might Mean Better Performance
This section is specifically for the conversation you’re inevitably going to have with a client who says: “Google says our score is only 68%. Why aren’t you following their recommendations?”
Here’s the truth, confirmed by Search Engine Land’s investigation into Google’s auto-apply system: the Optimization Score does not measure how well your account is performing. It measures whether you’re reviewing Google’s recommendations. Dismissing a recommendation gives you the exact same score increase as applying it. Just clicking “dismiss” counts.
A real example: one advertiser had a 97% score with declining ROI. After a strategic audit that rejected several Google recommendations, the score dropped to 68%—but conversion rate jumped 43% and CPA fell 31% within 60 days.
Google Partner status requires a 70% Optimization Score, which creates a tension every agency needs to manage. The solution: dismiss recommendations you disagree with rather than ignoring them. Dismissals still count toward your score without forcing you to make changes that hurt performance.
This is also why client reports shouldn’t lead with Google’s Optimization Score. Lead with CPA, ROAS, and lead volume — the things that pay the bills — and keep Optimization Score as a footnote if you mention it at all.
And on every single account, turn off auto-apply recommendations. They can change budgets, rewrite ad copy, and adjust bids without your approval. Multiple agencies have lost clients because auto-applied recommendations drove costs through the roof with no improvement in results.
The 8 Most Expensive Mistakes You Can Make Right Now
Every mistake on this list is something we see across real accounts. Not hypothetical risks—actual patterns that drain budgets.
Self-Audit · Tap to Check
The 8 Most Expensive Mistakes
Every mistake below is something we see across real accounts — not hypothetical risks, actual patterns that drain budgets. How many are active in yours right now?
Clean
0/8
Inconsistent conversion tracking
FoundationWhen campaigns use different attribution windows, count types, or conversion actions, the data feeding your decisions is unreliable. Fix this first.
Neglecting negative keywords
CriticalWith broad match, you’re paying for irrelevant traffic every day you don’t review search terms. Weekly mining is the minimum.
Trusting automation blindly
HighSmart Bidding is a tool, not a strategist. It optimizes for volume by default — you have to tell it what quality looks like.
Running broad match without Smart Bidding
HighBroad match works with target bidding. It bleeds money with maximize bidding. The combination matters.
Sending traffic to homepages
HighYour client’s homepage is designed for navigation. Dedicated landing pages consistently convert better because they deliver on the ad’s specific promise.
Chasing Ad Strength instead of results
MediumAd Strength measures Google’s messaging flexibility, not your actual conversion performance. They’re different things.
Letting Google auto-apply recommendations
CriticalThese change bids, add keywords, and adjust budgets without asking you. Review every recommendation manually.
Optimizing for CPA without tracking customer value
HighA $30 lead and a $3,000 lead both look the same to CPA bidding. Value-based bidding with CRM data solves this, but only if you set it up.
How many of these are active in your accounts right now? Even one can undermine months of optimization work.
Automation That Actually Helps: Scripts Every Agency Needs
Manual monitoring doesn’t scale. If you’re managing 20+ accounts, you can’t check budget pacing, disapproved ads, and broken URLs across all of them every day. Scripts solve this.
Any account spending over $5,000/month should have at least these four:
- A budget pacing script that tracks daily spend against monthly targets and alerts you before overspending hits.
- A disapproved ad alert that notifies you within hours—not days—when Google rejects an ad.
- A broken URL checker that catches 404 errors before ad spend gets wasted on dead pages.
- A search query mining script that flags new terms above a spend threshold for human review.
One important detail: as Search Engine Land reported, Google now paces budgets against the full 30.4x monthly limit even for campaigns with ad scheduling. That means if your client only runs ads Monday through Friday, Google might still allocate budget as if ads run all seven days. A pacing script catches this before it becomes a client conversation you don’t want to have.
Scripts cover the Google Ads side. For anything that crosses platforms — pacing Google Ads spend alongside Meta and LinkedIn, or flagging when a client’s total blended CPA spikes — you’ll want a monitoring layer on top.
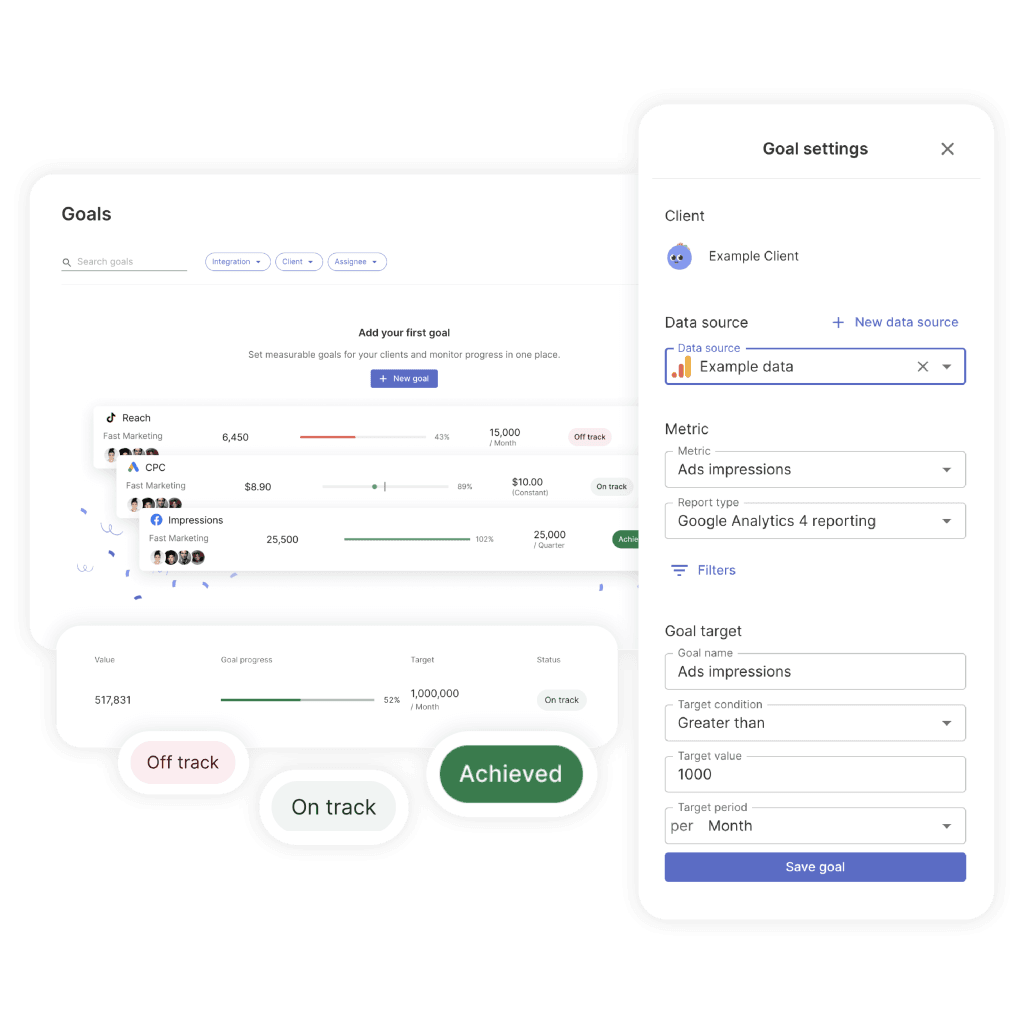
Swydo’s Goals track pacing against a target (daily budget, monthly lead target, ROAS floor) and flag “Off Track” before the month is lost, and Alerts fire when a KPI tips red. Between scripts in-platform and alerts across platforms, you stop finding out about problems from clients.
How to Report Results So Clients Actually Understand and Trust Them
You can run the best campaigns in the world. But if your client can’t see the value in your reports, none of it matters. This is where agencies win or lose relationships.
A three-tier framework keeps your reporting focused:
| Tier | What to Report | Who This Is For |
|---|---|---|
| Tier 1: Results | CPA, ROAS, conversions, revenue, customer LTV | Your client — the decision-maker |
| Tier 2: Efficiency | CTR, CPC, Quality Score, impression share, budget pacing | Marketing managers and your team |
| Tier 3: Diagnostics | Search terms, device splits, geo performance, day-parting | Your PPC specialists only |
The biggest reporting mistake is showing a business owner Tier 2 and Tier 3 data. They don’t want to know CTR went from 6.2% to 7.1%. They want to know they got 40 more leads this month at $12 less per lead. Lead with results. Go deeper only if they ask.
Set a clear cadence: weekly check-ins for budget pacing, monthly reports focused on ROI, and quarterly business reviews where you show before-and-after comparisons and lay out strategy for the next quarter.
Industry Benchmarks: How Do Your Clients Stack Up?
One of the most useful things you can show a client is where they stand relative to their industry. It sets expectations, explains costs, and gives you a credible baseline for performance conversations.
Industry Benchmarks · Interactive
How Do Your Clients Stack Up?
Switch metrics to see where each industry sits relative to the platform-wide average. Context sets honest expectations.
Low CPCs don’t equal high value. Arts & Entertainment has the cheapest clicks — but Automotive Repair converts at nearly 3× that rate because intent is immediate. Always read CPC alongside conversion rate.
Source: WordStream/LocaliQ 2025 Google Ads Benchmarks.
Source: WordStream/LocaliQ 2025 Google Ads Benchmarks (linked above)
Automotive Repair’s 14.67% conversion rate at a $3.06 CPC tells you something about intent: when someone searches “brake repair near me,” they need it done today. Compare that with Real Estate at 4.58%—where the buying decision takes months, not minutes. Use these benchmarks to set honest expectations from day one and to identify where a client’s performance genuinely needs attention versus where it’s simply how the industry works.
Your Priority Checklist: What to Do This Week, This Month, and This Quarter
That was a lot. Here’s how to turn it into action.
This Week
- Audit conversion tracking on every account. Is the Google Ads pixel primary? Are Enhanced Conversions active?
- Turn off auto-apply recommendations wherever they’re still enabled.
- Add campaign-level negative keywords to every PMax campaign that doesn’t have them.
- Audit how you’re reporting to clients. If you’re rebuilding the same report in Google Sheets every month, a templated tool (Swydo, Looker Studio, or similar) will pay back its cost in the first week.
This Month
- Set up or verify server-side tracking on your top-spending accounts.
- Connect CRM data to Google Ads via Data Manager for any client where it’s available.
- Pull PMax channel performance reports and evaluate where budget is actually going.
This Quarter
- Test Demand Gen on at least one client who’s already running Meta campaigns.
- Build a first-party data strategy for every client account that doesn’t have one.
- Roll out budget pacing and disapproved ad scripts across all accounts over $5K/month.
Google Ads is more complex than it’s ever been. CPCs keep climbing. AI controls more of the process. And the gap between profitable and wasteful campaigns is thinner than ever. But that complexity is your advantage—clients need someone who understands all of this, who can guide the automation instead of being guided by it, and who makes strategic decisions the algorithm simply can’t.
That’s you. That’s the value you bring.
Google Ads Best Practices: Common Questions
Direct answers to what agencies and advertisers are asking right now
The average cost per click across Google Ads is about $5.26, though this varies widely by industry. High-intent service categories like Automotive Repair can see CPCs around $3, while competitive sectors like Legal Services, Finance, and Insurance regularly exceed $8–$10 per click.
A “good” CPC is one that still produces a profitable cost per lead or cost per acquisition for your business. Rather than benchmarking against the average, calculate the maximum CPC you can afford based on your conversion rate, customer lifetime value, and margin — then optimize to stay below it.
The overall average Google Ads conversion rate is 7.52%, but industry matters enormously. Automotive Repair averages 14.67% because searchers need service immediately. Real Estate averages just 4.58% because the buying decision takes months. Legal, Home Services, and Dental Care typically fall between 8% and 13%.
Compare your conversion rate to your specific industry benchmark, not the overall average. If you’re materially below your industry norm, the issue is usually landing page experience, offer strength, or tracking setup — not ad copy.
The average cost per lead across Google Ads is approximately $70.11, up about 5% year over year. Lead generation costs are rising faster than conversion rates are improving, which means optimization now has to do more work just to keep results steady.
To reduce CPL, focus on three levers: improve Quality Score (moving from a 5 to a 7 cuts CPC by about 28%), tighten conversion tracking so Smart Bidding has clean data, and use negative keywords aggressively to eliminate wasted clicks on irrelevant searches.
There’s no universal answer, but there are practical floors. For Smart Bidding to work, your campaigns need roughly 15–30 conversions per month — so your minimum monthly spend should be at least 15 times your expected CPA. For Performance Max specifically, daily budgets below $30–50 prevent the algorithm from collecting enough data to optimize.
Start with a budget that lets you generate meaningful conversion data within 30 days, then scale based on actual ROAS rather than arbitrary spend targets. Accounts under $3,000 per month are usually better off with Manual CPC until they build conversion volume.
Yes, if you can commit to optimization and have a clear offer. Search campaigns deliver a median return on ad spend of 5.17:1, meaning $1 in ad spend returns roughly $5 in revenue for well-run accounts. Local service businesses like auto repair, legal, dental, and home services consistently see strong returns because searchers have immediate intent.
The accounts that fail are the ones that set campaigns up and leave them alone. CPCs are rising faster than conversion rates, so any account on autopilot is getting less efficient every month. If you can’t commit to weekly optimization, hire an agency or use Smart Bidding with tight Target CPA controls.
Search campaigns deliver the highest return on ad spend, with a median ROAS of 5.17:1 — nearly double Performance Max (2.57:1) and higher than Shopping (2.88:1). Search wins because it captures high-intent users who are actively looking to buy.
Video and Display campaigns have far lower direct ROAS (0.52:1 and 0.12:1 respectively), but this doesn’t mean they’re bad — they serve different purposes. Display works for retargeting, and YouTube builds awareness that later converts through Search. Judge each campaign type by its role in your funnel, not just last-click ROAS.
No — Search typically outperforms Performance Max on pure ROAS (5.17:1 vs 2.57:1). PMax is powerful for scale and reaching audiences across channels, but it spreads spend across Display, YouTube, and Gmail where user intent is much lower than Search.
The best approach is layered: use Search as your foundation for high-intent traffic, add PMax for scale after you have conversion data, and keep both running with separate budgets so you can compare performance cleanly. Don’t let a Google rep convince you to consolidate everything into one PMax campaign.
Add campaign-level negative keywords to block irrelevant traffic — this feature is now available for all advertisers, and agencies commonly report 10–15% cost reductions the day they implement a negative list. Use separate asset groups by product or intent rather than dumping everything into one group, and supply at least 7 images in landscape, square, and vertical formats.
Always upload your own videos. Google’s auto-generated videos underperform custom videos by 25–40%, and even a 15-second phone clip beats the AI slideshow. Keep daily budgets above $30–50 so the algorithm has enough data to learn, and give new campaigns 2–3 weeks or 50–100 conversions before making major changes.
Demand Gen is Google’s campaign type for visual, social-style advertising across YouTube, Discover, Gmail, and the Google Display Network, reaching over 3 billion monthly users. It replaced Video Action Campaigns, which are now fully deprecated. If your business already runs Meta ads successfully, Demand Gen is the closest Google equivalent.
Two numbers make the case: advertisers using both video and image assets see 20% more conversions at the same CPA, and 68% of Demand Gen conversions come from users who never interacted with any other Google campaign. That’s genuinely new traffic, not recycled attribution.
Migrate gradually, not all at once. Start by moving about 10% of your video budget to Demand Gen to let the algorithm collect initial learning data. After 2 weeks of stable performance, scale to 50%. After another 2 weeks, move to 100%.
Use this transition window to upload both video and image assets — the combined-format approach delivers 20% more conversions than video alone. Don’t reuse the exact same creative from your old campaigns; Demand Gen responds better to social-native formats like 9:16 vertical video and square thumbnails.
Your feed matters more than your bidding strategy in Shopping campaigns. Front-load product titles with product type and key attributes within 150–160 characters — don’t start with your brand name unless it’s a major purchase driver. Fill every available attribute, including optional ones like color, size, material, GTIN, and MPN, because Google uses them for matching.
Use custom labels to segment products by margin, best-seller status, and seasonality. This lets you bid differently on high-margin products versus clearance items, which the algorithm can’t figure out on its own. A strong feed with average bidding will always outperform a weak feed with great bidding.
Not as a primary driver. Display’s median ROAS is 0.12:1 — it returns less than 13 cents on every dollar spent when judged by direct conversions. But it has a legitimate supporting role when used narrowly for retargeting people who already visited specific product or service pages.
If you’re running Display as cold prospecting or for broad awareness, the results usually don’t justify the spend. Keep it tight: retargeting audiences only, exclude placements on mobile gaming apps and low-quality sites, and measure by view-through contribution to Search and Shopping conversions rather than direct last-click ROAS.
It depends on your conversion volume. Use Manual CPC for brand new accounts, testing phases, or accounts with fewer than 15 conversions per month. Use Max Conversions while building data (around 15 conversions monthly). Use Target CPA once you consistently hit 15–30 conversions and know your target acquisition cost. Use Target ROAS for e-commerce with 30+ conversions and accurate conversion value data.
Smart Bidding needs conversion signals to learn. Turning it on for a new account with 5 conversions a month means it’s optimizing on noise — which is why your Google rep’s “switch to Smart Bidding immediately” advice often hurts performance.
Yes, but only when paired with Smart Bidding. Advertisers switching from phrase match to broad match with Smart Bidding typically see about 25% more conversions at the same target CPA. Broad match without Smart Bidding is still a budget drain — the combination is what matters.
The most effective keyword strategy is a barbell approach: exact match for brand terms and high-value bottom-funnel keywords where you need control, plus broad match with Smart Bidding for discovery and scaling. Mine search terms at least weekly, daily during the first week of any new campaign, and maintain a master negative keyword list across your entire account.
Group keywords by intent theme into broader ad groups rather than creating single-keyword ad groups. The old approach of massive exact-match lists with obsessively granular structures starves Smart Bidding of data and slows learning. Separate brand, non-brand, and competitor campaigns with their own budgets so spend allocation stays predictable.
Users increasingly search conversationally — full questions instead of two-word phrases — so your keyword list needs to account for natural language queries. This is where broad match plus Smart Bidding outperforms rigid exact-match strategies.
Mostly no. When you’re using Smart Bidding strategies like Target CPA or Target ROAS, manual bid adjustments for device, location, schedule, and demographics are ignored — the algorithm handles those signals automatically. Many advertisers waste hours setting adjustments that have zero effect.
The one manual adjustment that still works under Smart Bidding is a -100% device exclusion (most commonly used to exclude mobile when you only want desktop traffic). Everything else is ornamental.
Fill all 15 headlines and all 4 descriptions. This gives Google the maximum combinations to test, which is how responsive search ads are designed to work. Put your target keyword in at least 30% of headlines, and write each headline so it works independently — they can appear in any position.
Pin only what’s truly critical, like your brand name in Headline 1 or required legal disclaimers. Over-pinning defeats the testing process by locking the algorithm into fewer combinations.
For e-commerce, usually yes. Advertisers who switch from Target CPA to Target ROAS typically see about 14% more conversion value, because Target ROAS optimizes for revenue while Target CPA only optimizes for conversion count.
The catch: Target ROAS only works if your conversion values are accurate. If you’re sending flat $1 values for every conversion, you’ll get worse results than Target CPA. Before switching, make sure your tracking passes real order values (or realistic lead values based on close rates and customer LTV).
Use the Google Ads Conversion Pixel as your primary tag, not GA4 imports. The Google Ads tag captures more conversions, handles cross-device attribution better, and feeds Smart Bidding directly with real-time data. GA4 imports are delayed, which means the bidding algorithm makes decisions based on stale information.
You can still run GA4 in parallel for analytics and audience building, but it shouldn’t be the conversion source your Smart Bidding strategy optimizes against.
Enhanced Conversions supplement your standard conversion tags with hashed first-party data like email addresses and phone numbers. They deliver an average 10% uplift in measured conversions by recovering data lost to cookie restrictions and ad blockers.
Yes, you need them. Google has started auto-enabling Enhanced Conversions on many accounts, but you should verify it’s actually active and properly configured. Without them, you’re systematically underreporting conversions, which causes Smart Bidding to set targets too conservatively and underbid on profitable traffic.
Server-side tracking sends conversion data from your server directly to Google, bypassing the browser-based tags that ad blockers and privacy features increasingly block. Server-side implementations typically report 10–30% more conversions than client-side tracking alone.
For any account spending over $10,000 per month, it’s no longer optional. The investment pays for itself through recovered conversion data alone, and it becomes more important every year as browsers tighten privacy defaults.
Consent Mode V2 adjusts how Google tags behave based on user cookie consent. It’s mandatory for advertisers targeting the EEA and UK, and strongly recommended everywhere else. When configured in Advanced mode, it recovers 15–25% of conversions that would otherwise be lost when users decline cookies.
Without Consent Mode V2, your EEA/UK campaigns will increasingly show degraded data and limited audience functionality. Implement it through Google Tag Manager or your CMP (consent management platform) rather than hand-coding the signals.
Quality Score has a dramatic impact on what you pay. A Quality Score of 10 earns a 50% CPC discount versus the baseline of 5. A Quality Score of 1 inflicts a 400% penalty. Moving from a 5 to a 7 cuts your CPC by about 28% — on a $50,000 monthly spend, that’s $14,000 in savings for the same results.
The three components aren’t weighted equally: Expected CTR carries about 80% of the weight, Landing Page Experience about 15%, and Ad Relevance about 5%. Focus on writing compelling ads that earn clicks — that’s where the biggest gains are.
Start with Expected CTR since it’s 80% of the score. Write ad copy that speaks to the specific searcher intent, include the target keyword in multiple headlines, and test emotional or benefit-driven language against feature-driven language. Ads rated “above average” for both landing page experience and ad relevance show CPCs 36% below average.
For Landing Page Experience, ensure fast mobile load times (every 1-second delay reduces conversions by up to 20%), mobile-responsive design, and content that directly delivers on the ad’s promise. For Ad Relevance, keep ad groups tightly themed so the ad copy mirrors the keyword’s intent.
Customer Match lets you upload customer email lists, phone numbers, and addresses to Google Ads to target existing customers, build lookalike audiences, and feed Smart Bidding with signals about what valuable customers look like. Lists using two identifiers (email + phone) are about 28% larger than single-identifier lists, and adding a third bumps that another 35%.
Organizations using value-based bidding powered by first-party data report up to 50% improvements in ROAS. As third-party cookies continue to disappear, Customer Match is becoming one of the most important competitive advantages in paid search.
Review every recommendation, but don’t blindly apply them. Google’s Optimization Score doesn’t measure account performance — it measures whether you’re reviewing recommendations. Dismissing a recommendation gives you the same score increase as applying it, so you can maintain a high score while rejecting suggestions that hurt your campaigns.
In one documented case, an account with a 97% Optimization Score had declining ROI. After a strategic audit that rejected several Google recommendations, the score dropped to 68% but conversion rate jumped 43% and CPA fell 31% within 60 days. Score high ≠ performing well.
Yes, on day one of every new account. Auto-apply recommendations can change budgets, add keywords, rewrite ad copy, and adjust bids without your approval. Multiple agencies have lost clients because auto-applied changes drove costs up with no corresponding performance improvement.
Keep the recommendations feature visible — it surfaces legitimately useful suggestions sometimes — but review each one manually before applying. Also disable Search Partners on new accounts, since that setting is defaulted on and rarely adds value for most advertisers.
Not really. Ad Strength measures Google’s ability to remix your messaging into different combinations — it doesn’t measure actual conversion performance. Industry research consistently finds that lower Ad Strength ads sometimes deliver higher conversion rates because tighter messaging constraints produce more focused ads.
Aim for “Good” as a baseline, but use per-asset performance data (available since mid-2025 within the Google Ads interface) to identify which specific headlines and descriptions convert. If an “Average” headline outperforms a “Best” one, keep the Average one.
Homepages are built for navigation, not conversion. They try to serve every visitor with every possible path, which means they don’t deliver on any specific ad’s promise. Dedicated landing pages consistently convert 2–5x better because they match the ad’s message, focus the visitor on one action, and eliminate navigation distractions.
Build a landing page per campaign theme or offer. Match the headline to the ad copy, keep the form visible without scrolling on mobile, and remove your global navigation menu. The conversion rate lift pays for the landing page investment within weeks on most accounts.
The eight most expensive mistakes are: inconsistent conversion tracking, neglecting negative keywords, trusting Smart Bidding without giving it guidance, running broad match without Smart Bidding, sending traffic to homepages instead of landing pages, chasing Ad Strength instead of conversion results, letting Google auto-apply recommendations, and optimizing for CPA without tracking actual customer value.
The biggest single mistake is bad conversion tracking. When tracking underreports by 20%, Smart Bidding sets your targets 20% too high, and you systematically underbid on profitable traffic. Fix tracking before you touch anything else — it’s usually the highest-ROI change you can make.
At minimum: daily during the first week of any new campaign, weekly for established accounts, and monthly for deep strategic reviews. Weekly tasks include mining search terms for negatives, reviewing disapproved ads, checking budget pacing, and scanning for broken landing page URLs.
For accounts spending over $5,000 per month, use scripts to automate monitoring — budget pacing alerts, disapproved ad notifications, broken URL checks, and search query flags for terms above a spend threshold. Manual monitoring doesn’t scale past 20 accounts.
Expect 2–4 weeks before Smart Bidding produces stable performance on a new campaign. The algorithm needs roughly 50–100 conversions of learning data before its targets stabilize. Making major changes during the learning phase (budget shifts over 20%, bid strategy swaps, significant creative changes) resets the learning period.
Search campaigns with Manual CPC can generate qualified leads within days because bidding behavior is predictable. Performance Max, Target CPA, and Target ROAS campaigns all need the full learning window — plan budgets accordingly and resist the urge to make changes in weeks 1 and 2.
Match the metric to the audience. For business decision-makers, report results: CPA, ROAS, conversions, revenue, and customer lifetime value. For marketing managers, add efficiency metrics: CTR, CPC, Quality Score, impression share, and budget pacing. For PPC specialists, include diagnostics: search terms, device splits, geo performance, and day-parting.
The biggest reporting mistake is showing business owners efficiency and diagnostic data. They don’t want to know CTR improved from 6.2% to 7.1% — they want to know they got 40 more leads this month at $12 less per lead. Lead with results, go deeper only if asked.
Build client-ready Google Ads reports that lead with results, not raw metrics.
Start Your Free Trial Today