
Managing client campaigns often feels like firefighting — too many moving parts, not enough time. Pulling reports by hand only adds to the chaos. By the time those spreadsheets reach your client’s inbox, the numbers are already stale.
Here’s the upside: since Google owns both Google Ads and Looker Studio (LS), you can skip the clunky workarounds. With the right setup, you’ll turn raw data into real-time dashboards that clients actually trust.
Here’s what you’ll learn in this guide:
- Use Google’s native connector for a quick setup
- Pick the best alternative connectors when you need more power
- Track the metrics that actually matter for agencies
- Automate your reporting so you can spend less time pulling data and more time on strategy
What You’ll Need to Integrate Google Ads to Looker Studio
Before you connect Google Ads to Looker Studio, make sure you have:
- Looker Studio account — free to create with any Google login
- Google Ads account access — at least Standard access for the accounts you want to report on
- Correct permissions — your Google login must be authorized in both Ads and Looker Studio
Check out our complete Looker Studio tutorial for beginners
How to Connect to Looker Studio
If you don’t have a Looker account yet, get one — it’s this easy:
- Go to the Looker Studio website and click Use it for free
- Sign in with your Google login using single sign-on (SSO)
- Complete the short setup process to unlock all Looker Studio features
Check Permissions on Your Google Ads Account
Make sure you have access to the features and Google Ads data you’ll need to build reports:
- Log in to your Google Ads account
- Click Settings in the upper right corner
- Select Access and security
- Review the access level listed for your email address.
Google Ads has a few permission levels assignable to different users:
- Admin access allows you to manage the account, handle billing, add or remove users, and control all campaigns.
- Standard access lets you create and edit campaigns, plus see how they’re performing — but you can’t edit billing or user settings.
- Read-only access means you can view campaign data and pull reports, but you can’t make any changes.
- Billing access gives you control over payment info and billing details for that specific ad account.
- Email-only access just sends basic performance updates to your inbox — no logging into reports or accessing editing features.
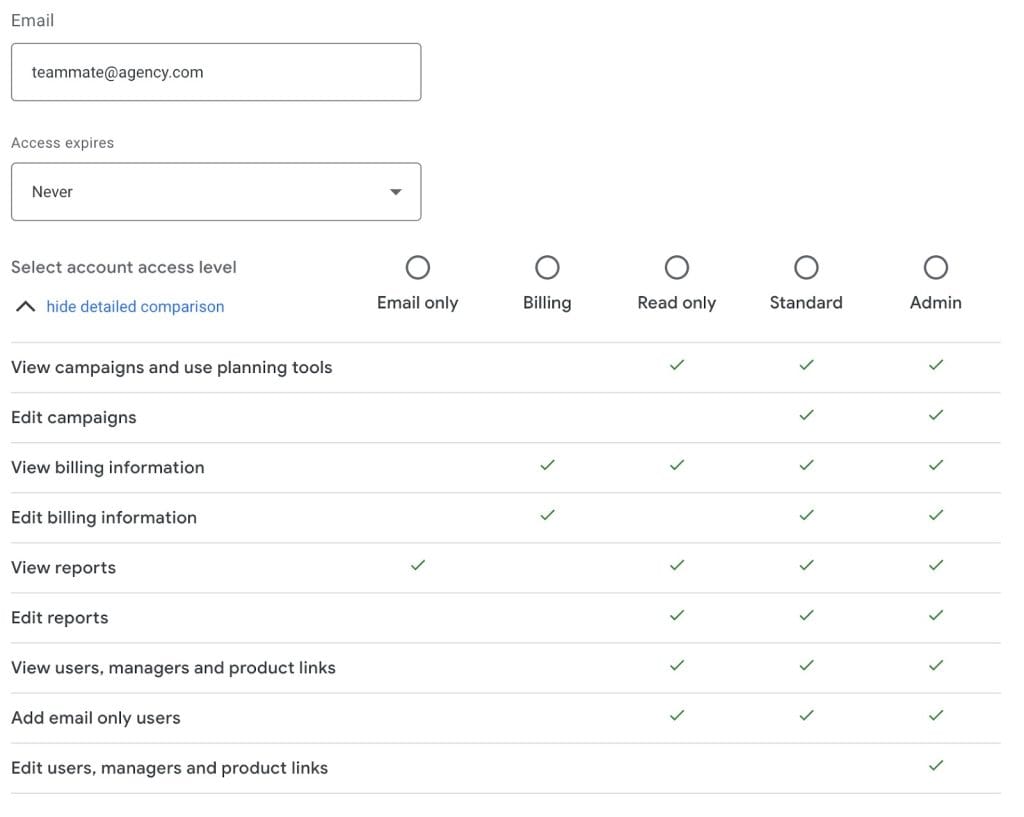
Google Ads also has a handy feature that lets you set expiring access for team members. Working with a client on a three-month contract? Give them access to their specific account for exactly three months — then their access automatically expires. When working with multiple clients and stakeholders, you won’t have to manually track and update everyone’s permissions across all your accounts.
How to Connect Google Ads Data to Looker Studio
How you connect Google Ads data to Looker Studio depends on your reporting preferences. You can go with Google’s built-in connector or use a third-party option.
Option 1: Native Google Ads Connector
As both platforms exist within Google’s ecosystem, you can use a native data connector available directly in Looker Studio:
- Open Looker Studio and select Create and then Report
- In the new report, click Add data
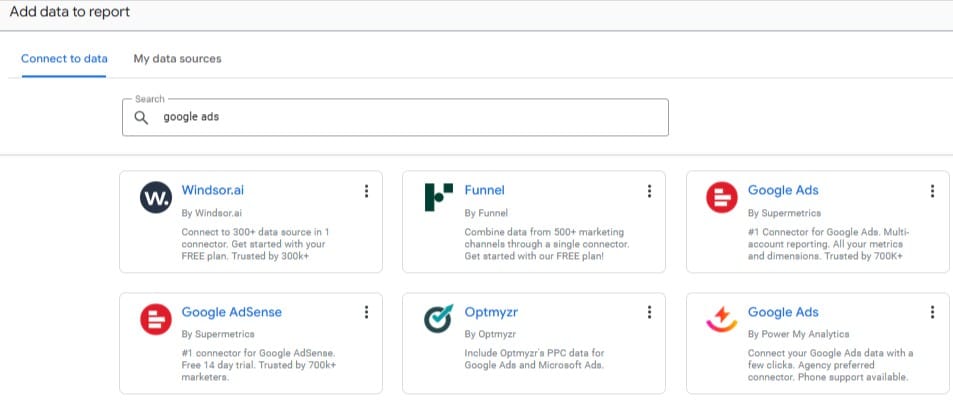
- The Add data window will open — choose Google Ads data connector from the list
- Choose the Google account linked to your Google Ads access
- Choose the specific Google Ads account you want to connect to
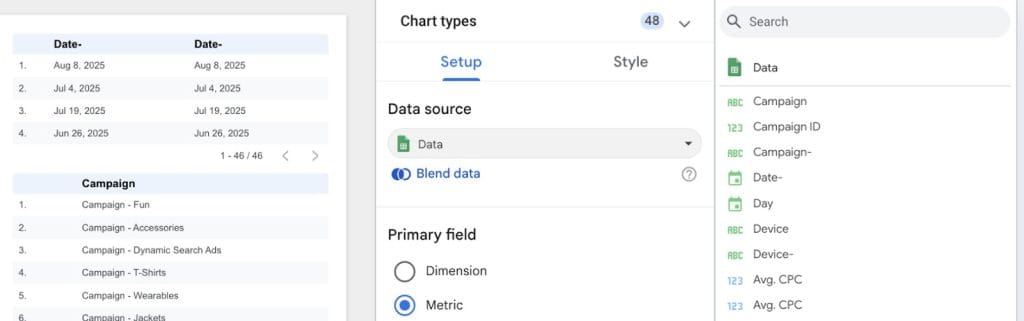
- Select relevant metrics from the list and click Add
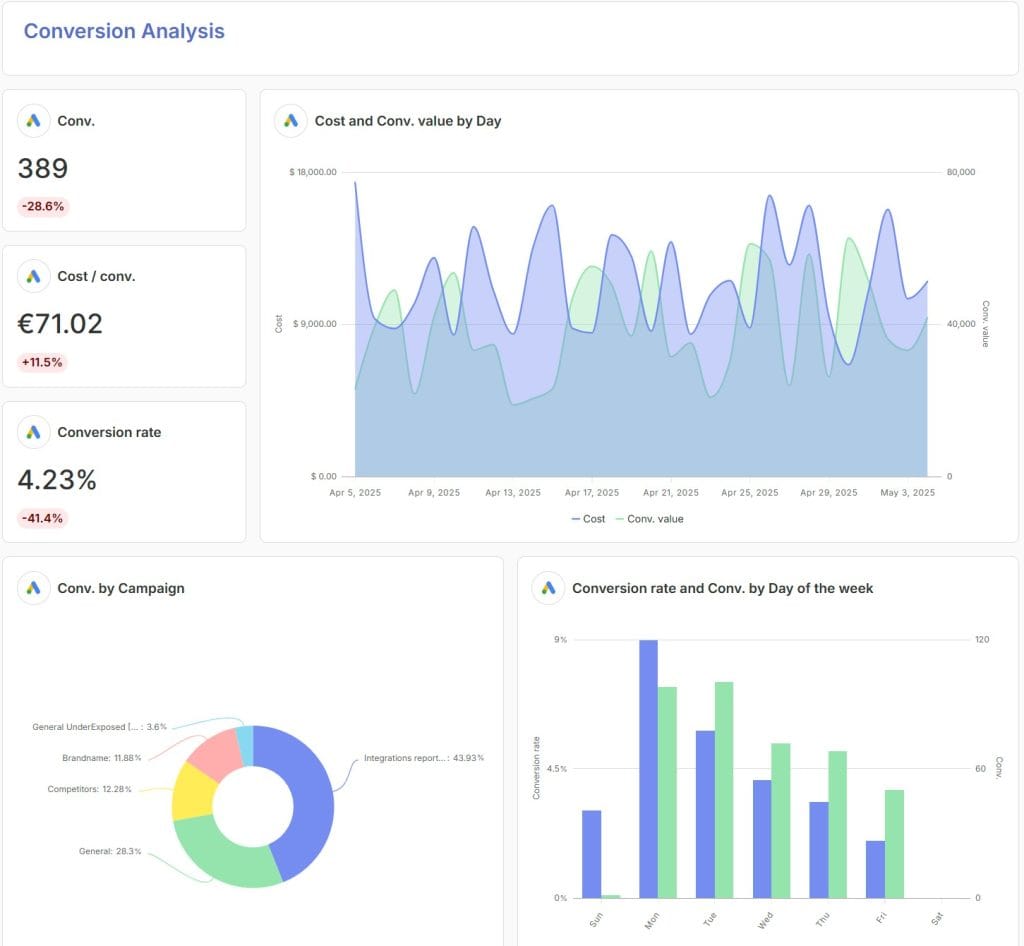
The report will reload, and return fresh Google Ads data ready for all sorts of widgets, pie charts, tables, and so on.

Option 2: Google Sheets Integration
Use the Google Sheets connector when you need custom data manipulation, historical storage, or a flexible reporting workflow. Think of it as a staging area where you can clean, slice, and dice data before it hits your dashboard.
- Decide which Google Ads data you want to export
- Click the Download icon in the Overview tab, or go to the Export menu
- Choose one of the export options: Export whole account, Export selected campaigns and ad groups, or Export current view in CSV format
- Open Google Sheets and import the downloaded CSV files
- Clean, format, and organize the data according to your reporting needs — remove clutter, rename columns, and add calculated metrics if needed
- In Looker Studio, select Google Sheets as your data connector
- Choose the spreadsheet and the specific worksheet with your Google Ads data
- Adjust visualization settings in Looker Studio for the data, like chart type, colors, and labels
- Click Add and your Google Ads data is ready for use in your report
Tip: Use Sheets as a sandbox to experiment with calculated fields or custom segments before pushing them live. This method lets you test ideas safely without breaking client-facing dashboards.
Option 3: Third-Party Connectors
Google’s built-in data connector and Google Sheets cover most marketing agency needs. However, third-party connectors have a few handy features that these native tools don’t offer. To connect a third-party connector:
- Open Looker Studio, then choose Create and Report
- Click Add data in the new report
- From the data connector list, choose a third-party connector
- Authorize access to Google Ads and the connector’s platform
- Configure data pull settings, metrics, dimensions, and refresh rate
- Save your data connector — click Add and refresh your report
Heads up: Most third-party data connectors charge monthly subscription fees for Looker and Google Ads integrations. If you’re considering third-party reporting platforms as a cost-cutting measure, keep in mind that these subscription costs could actually increase your overall performance reporting expenses.
Available Google Ads Connector Options
Getting to know connector options makes it easier to match a solution to your marketing agency’s needs. Different connectors have unique strengths and quirks, so picking wisely can spare you irksome surprises later on. Plus, understanding limits upfront means you won’t get stuck with something that doesn’t scale as you grow.
| Google Ads Connectors for Looker Studio | ||
|---|---|---|
| Data Connector | Key Features | Pricing |
| Google Ads (Native) | Built into LS, no setup beyond login, standard Ads metrics, auto-refresh | Free |
| Google Sheets (Semi-Native) | Manual or automated CSV exports, easy to add custom calcs, flexible but more work | Free |
| Windsor.ai (Third-Party) | Quick Ads → LS integration, auto-refresh, wide metric coverage | Free plan, from $23/month |
| Dataddo (Third-Party) | Custom pipelines, automated refresh, user-friendly | Free plan, from $129/month |
| Supermetrics (Third-Party) | Cross-channel data blending, calculated fields | From $47/month |
Just like clients do their research when choosing their marketing agency, so should you when choosing Google Ads data connectors. Here’s what’s worth checking:
- Put it through a real test — connect actual client accounts and see if it can handle the volume without dropping key metrics or slowing down.
- Look at cost in context — with dozens of client accounts, per-account or per-connection fees can pile up fast and eat into profit.
- Check the data refresh rate — clients want today’s numbers, not last week’s, so make sure the refresh rate is fast enough.
- Keep setup easy — a good connector shouldn’t need a developer just to get running.
- See how support works — when something breaks, you’ll want quick answers or at least detailed documentation that actually solves problems.
Most connector providers offer a free trial, so connect 2–3 options to real or high-volume demo accounts. Pick the one that keeps data accurate, reports clean, and doesn’t make the setup process an additional challenge to your existing routine.
Essential Google Ads Metrics for Every Agency
Looking at a screen full of Google Ads data can feel overwhelming. Don’t worry — we’ve narrowed it down to the must-have Google Ads metrics every agency should be tracking, whether you’re managing a handful of accounts or wrangling dozens of clients.
| Visibility & Reach Metrics | ||
|---|---|---|
| Metric | What it shows | How it helps |
| Impressions | Number of times ads appear | Gauge ad visibility |
| Search top IS | Share of impressions above organic results | Measure premium placement |
| Search absolute top IS | Share of impressions in the #1 spot | Track ad dominance |
| Search impression share | Portion of available ad opportunities won | Benchmark against competitors |
Example: A new app runs display ads and sees impressions skyrocket in New York but stay flat in Chicago. They double the New York budget, while testing fresh creatives in Chicago to lift reach.
| Engagement & Efficiency Metrics | ||
|---|---|---|
| Metric | What it shows | How it helps |
| Clicks | Number of ad clicks | Measure audience interest |
| CTR | % of impressions that became clicks | Judge ad/message effectiveness |
| CPC | Average cost per click | Assess cost-efficiency |
| CPM | Cost per 1,000 impressions | Compare brand exposure cost |
Example: A video campaign for a fitness brand gets a high view rate but a weak CTR. They refine the call-to-action and cut CPC in half, while keeping CPM stable for efficiency.
| Conversion & Profitability Metrics | ||
|---|---|---|
| Metric | What it shows | How it helps |
| Conversions | Number of desired actions completed | Track campaign outcomes |
| Conversion rate | % of clicks that became conversions | Evaluate offer/landing page |
| CPA | Cost per acquisition | Assess cost-effectiveness |
| Conversion value | Dollar value of all conversions | Track revenue impact |
| ROAS | Return on ad spend | Judge profitability |
| Value per click | Average revenue per click | Assess traffic quality |
| Quality score | Google’s relevance rating | Optimize ad costs/placements |
Example: An e-commerce client selling sneakers notices one ad set drives conversions at $15 CPA, well below their $25 target. They scale that set fast, while pausing the losers to protect ROAS.

Most data connectors, including the free versions, pull only basic metrics from Google Ads. They don’t automatically calculate CTR, CPA, ROAS, or Conversion Rate. Luckily, agencies can build these calculated values themselves for more insight into their Google Ads performance. Looker Studio makes it simple to create these advanced metrics with the following steps:
How to create calculated fields in Looker Studio
- Open your report and click Resource → Manage added data sources
- Select your Google Ads data source and click Edit
- Click + Add a field in the top right corner
- Enter a formula and name it clearly (e.g., CTR, CPA)
- Save the field, then add it to your charts

Common formulas to build in Looker Studio:
- CTR = (Clicks / Impressions) * 100
- CPA = Cost / Conversions
- ROAS = Conversion Value / Cost
- Conversion rate (CR) = (Conversions / Clicks) * 100
- Value per click = Conversion Value / Click
- CPM = (Cost / Impressions) * 1000
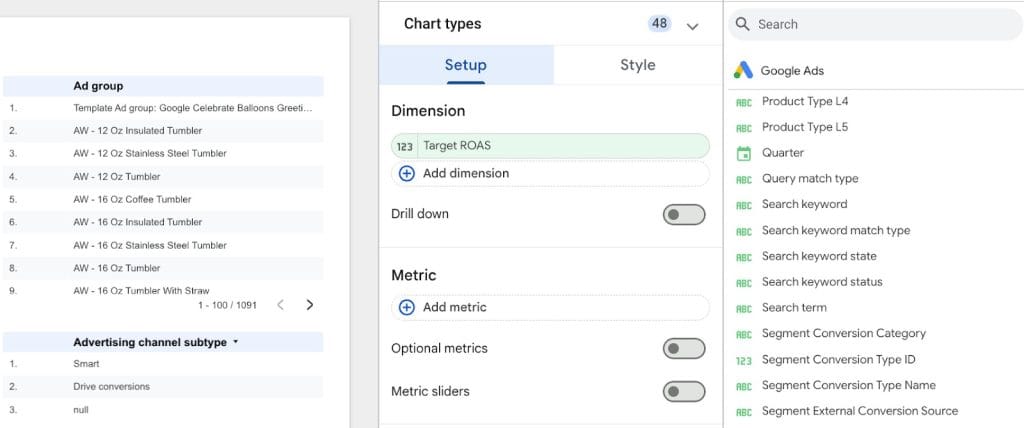
Must-Have Google Ads Dimensions for Analysis
Think of your Google Ads dimensions like lenses on a microscope — each one lets you zoom in on a different part of your campaigns. There are over 500 lenses, but using the wrong ones just blurs the picture. Smart choices reveal where campaigns thrive, where they falter, and give clients a crystal-clear view of results. Here’s your essential lens kit:
Core Campaign Dimensions
These are the basic building blocks of your Google Ads account structure. They help you understand which parts of your campaigns are working and which need attention.
| Core Google Ads Campaign Dimensions | ||
|---|---|---|
| Dimension | What It Shows | How It Helps |
| Campaign name | How different campaigns compare | Identifies top-performing campaigns |
| Ad group name | Which ad groups perform better or worse | Highlights where to focus optimization efforts |
| Keyword | How individual keywords perform | Reveals which search terms drive results and which waste spend |
| Ad text | Which ad copy gets clicks and conversions | Shows which messages resonate with customers |
| Match type | Performance of broad, phrase, and exact match keywords | Helps bid smarter and avoid irrelevant clicks |
Audience and Targeting Dimensions
These dimensions show you who’s clicking and converting, when they’re active, and where they’re located. After running your Google Ads campaigns for some time, you can come back to these dimensions and adjust the campaign to maximize the ad performance.
Example: Imagine your client sells outdoor gear. You notice conversions skyrocket on weekends in Colorado from tablet users aged 25–34. Targeting these users more aggressively boosts ROI without wasting ad spend elsewhere.
| Google Ads Audience & Targeting Dimensions | ||
|---|---|---|
| Dimension | What It Shows | How It Helps |
| Device | Whether people convert better on phones, computers, or tablets | Allocates budget to devices that drive conversions |
| Location | Which cities, states, or countries give the best results | Focuses spend on high-performing regions |
| Time segments | What days and times work best for your ads | Schedules ads when people are most likely to act |
| Demographics | How different age groups and genders respond | Refines targeting to reach the right audience |
Network and Placement Dimensions
These shows where your ads appear and how each Google network performs. Spot which networks drive clicks and conversions—and which waste your budget.
Example: Compare Search ads vs. Display ads. If your luxury watches appear on low-traffic gaming blogs, your ad spend evaporates. Reallocate to channels that deliver buyers.
| Google Ads Network & Placement Dimensions | ||
|---|---|---|
| Dimension | What It Shows | How It Helps Your Clients |
| Network | How Search, Display, or Shopping ads perform | Puts budget where it works and pulls back where it doesn’t |
| Search terms | The actual words people type that trigger your ads | Finds terms to block so irrelevant clicks don’t eat your budget |
| Placement | Which websites show your Display ads and how they perform | Focuses spend on sites that convert and avoids those that don’t |
How to Automate Google Ads to Looker Studio
Manual reporting eats up valuable time you could spend on strategy and campaign optimization. Automating your reporting workflow saves hours, reduces errors, and keeps your data up to date — here’s how to do it:
Step 1: Configure Automatic Data Refresh
Automatic refresh keeps your reports up-to-date with the most recent Google Ads data — no need for manual updates. To adjust data freshness in your Looker report:
- Open your Looker Studio report
- Go to Resource → Manage added data sources
- Click EDIT on your Google Ads source
- Adjust Data freshness to your preferred schedule
With auto-refresh, weekly reports can update overnight while you sleep — no more manual copy-paste.
Heads up: Automatic data refresh is available in Looker Studio Pro. Free users must manually refresh data by clicking the three dots in the upper right corner of their report.
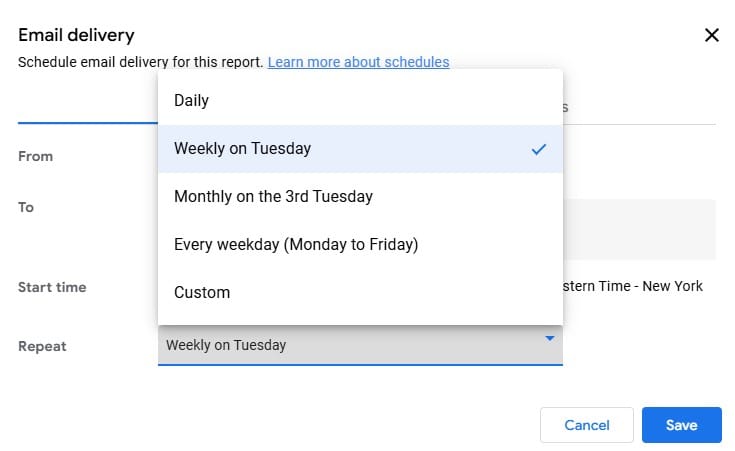
Step 2: Set Up Scheduled Report Delivery
Automated report delivery keeps clients informed — and also saves you time on those repetitive emails you’re sending every week.
Set up scheduled report delivery:
- Click the arrow next to Share
- Select Schedule delivery
- Choose weekly or custom schedule
- Add client emails
- Enable filters clients can access
- Click Save
Now your client gets reports every week like clockwork without you lifting a finger.
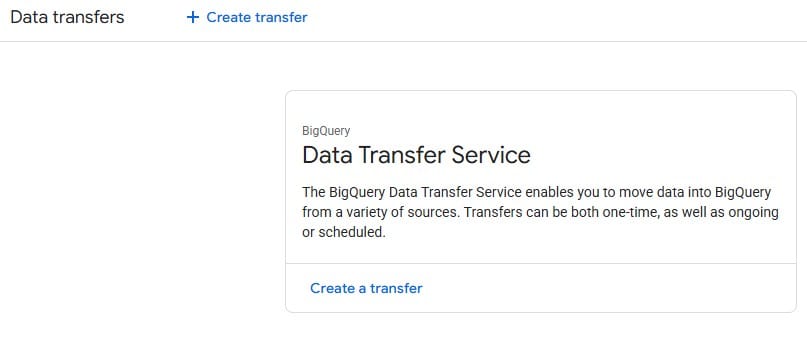
Step 3: BigQuery Integration for Large-Scale Data Imports
BigQuery integration handles massive Google Ads datasets that would slow down or crash regular connectors. This lets your agency work with enterprise-level accounts and historical data — without the usual Looker Studio performance issues.
BigQuery Setup
- Create or select a project in Google Cloud Console, enable billing, and check that the BigQuery API is activated
- Enable BigQuery Data Transfer Service via the API library
- In the BigQuery console, create a dataset for your project
Transfer Configuration
- In GCP console under BigQuery, go to Data transfers and click Create Transfer
- Set source to Google Ads, specify user or MCC IDs, choose Standard or Custom reports
- Select tables, for example Campaign or AdGroup
- Set a refresh window and schedule daily data extraction
Looker Studio Connection
- Create a new data source in Looker Studio using your BigQuery dataset and the tables generated by the transfer
- Open auto-refresh settings via the Resource tab
- Choose Manage auto refresh settings and select a preferred data refresh rat
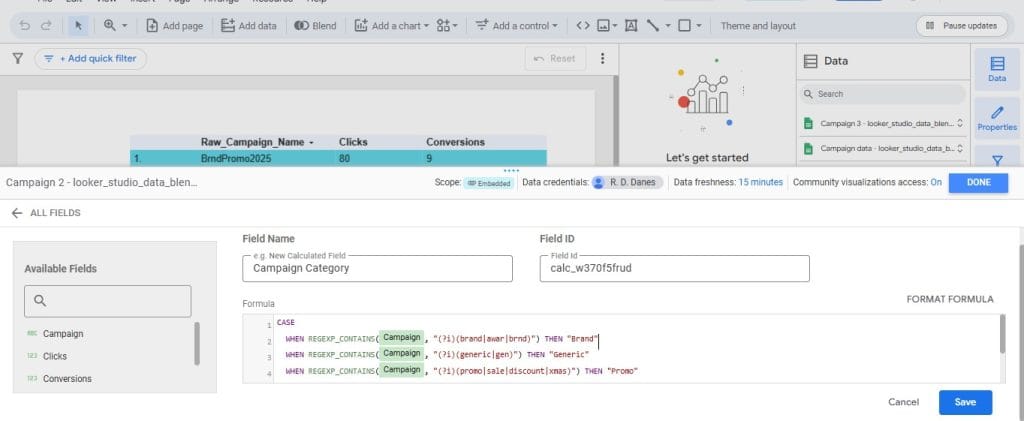
Step 4: Automate Metric Adjustments with Calculated Fields
Use calculated fields to automatically generate new metrics from your Google Ads data — no manual spreadsheets required. Think of it like giving your reports a brain: they calculate important numbers for you while you focus on strategy.
- Open your Looker Studio report connected to Google Ads (or BigQuery if you’re routing your data through it)
- Go to Resource, then select Manage added data sources
- Choose your data source and click EDIT
- In the top menu of the data source editor, click + ADD A FIELD
- Name your calculated field, for example, ROAS%
- Enter your formula using Looker Studio syntax — (Revenue / Cost) * 100
- Set the field type, for example, Currency, Number, or Percent, so your charts format automatically
- Click Save, then Done to return to your report
Tip: Create fields like CPA, CTR, or Value per Click the same way. This lets you show key insights without touching a spreadsheet, making your reports cleaner and more impressive to clients.
How to Troubleshoot Common Google Ads Integration Issues
Things can still go wrong even with Google’s built-in connector. But we’ve got the quick fixes to overcome the most common challenges when working with Google Ads and Looker Studio.
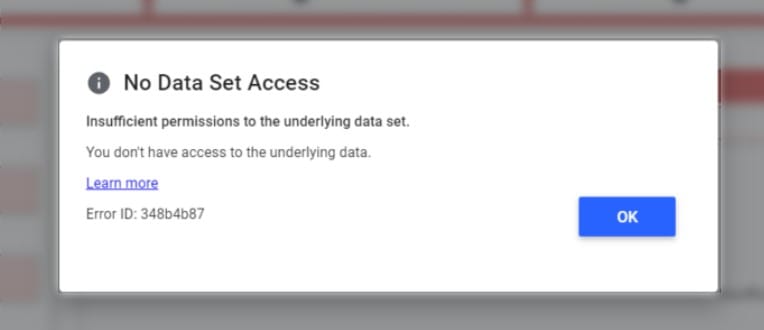
Data Source Shows “No Data Set Access” or Similar Errors
This usually happens when permissions get mixed up between your Google account and the client’s account, or when account access changes. To solve this:
- Verify your Google account has the correct Google Ads access level, such as Standard or Admin
- Reauthenticate by removing and re-adding the data source in Looker Studio
- Ensure the Google Ads account is active, error-free, and still linked to your Google account
Reports Show Outdated or Missing Recent Data
This happens when your data pipelines aren’t working properly or Google’s data processing is facing some issues. While the data might be outdated because of the errors on Google’s side, you can try out these solutions:
- Verify and adjust data freshness settings in your data source
- Manually refresh the data source to trigger an immediate update
- Confirm your Google Ads campaigns are active and generating data
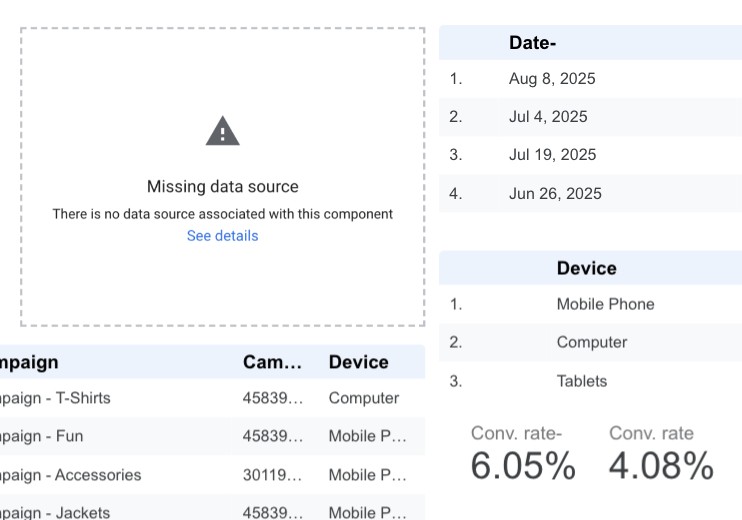
Some data sources disconnect without notification, and you’ll then see a Missing data source error message. To fix this:
- Reauthenticate your data source through the Resource and Manage added data sources tab
- Reset data freshness to the default and refresh the report manually
Reports load slowly or time out
Avoid slow loading by limiting the amount of data pulled at once and narrowing date ranges. Large datasets can overwhelm Looker Studio and stall reports on the loading screen for hours. To fix this:
- Remove unnecessary dimensions and metrics from charts and tables
- Separate channels or large campaigns onto different report pages
Alternative Ways to Report on Google Ads Performance
Looker Studio isn’t your only option for reporting Google Ads results. Choose the tool that fits your workflow, client expectations, and campaign complexity. Treat your reporting setup like a Swiss Army knife — each tool has its purpose, and using the right one saves time and stress.
Reporting Platforms Built for Marketing Agencies
Think of these platforms as ready-to-roll race cars. They handle multi-client campaigns, automate delivery, and keep templates consistent across accounts. Unlike Looker Studio, where you build everything from scratch, these platforms come preloaded with professional templates for PPC, SEO, and social media.
Take automated marketing platforms built for marketing agencies, like Swydo. Swydo users don’t have to build reports from scratch like they do in Looker Studio. For example, imagine a hypothetical agency managing five clients with 12 campaigns across three channels. With a platform like Swydo, you can:
- Use Swydo’s ready-made PPC, SEO, social media, and channel-specific templates that look professional out of the box
- Schedule automated weekly or monthly reports for each client
- Add calculated fields like ROAS or Conversion Rate without fiddling in spreadsheets
- Merge Google Ads, Instagram Insights, LinkedIn Ads, and more into all-in-one performance reports
- Skip the complex workarounds required in Looker Studio
The time saved here is like hiring a full-time reporting assistant without the salary — you focus on strategy, not manual data entry.
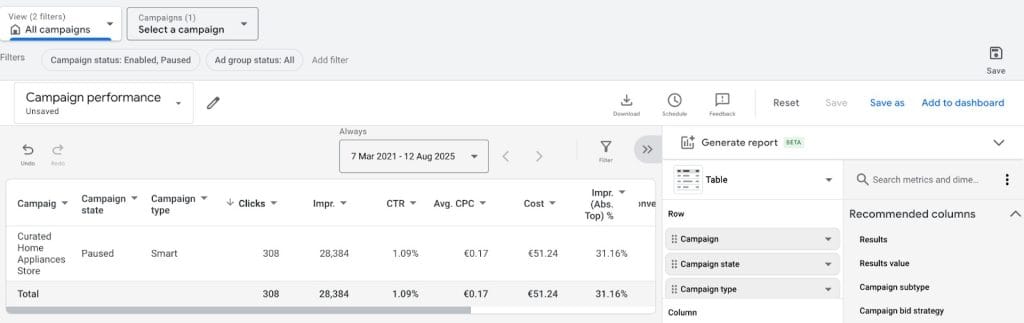
Google Ads Native Reporting
Google’s built-in reporting has improved a lot lately, so it might be a way out if you’re fed up with Looker Studio. It delivers precise campaign data without relying on connectors that break or data that fails to refresh. Custom reports show exactly what you need and can run automatically each week, keeping numbers accurate and consistent for your clients.
Automated rules can make life easier. They pause ads that flounder and boost winners so you don’t have to anxiously watch dashboards all day. They save hours and can stop budgets from blowing up overnight.
The catch: this only covers Google Ads. Multi-channel campaigns, client socials, Facebook Ads, SEO, and other marketing work need separate reporting tools.
When to Choose Each Tool
- Use Looker Studio for fully customized, multi-channel dashboards when you want complete control and visual flair.
- Choose Swydo or similar platforms when time efficiency and multi-channel aggregation matter more than custom design.
- Use Google Ads native reporting for single-channel campaigns or clients who value simplicity and speed over cross-platform integration.
Pro Tip: Start small. Test each tool with one client before scaling across your portfolio. This approach reduces headaches and ensures you pick the setup that will last when campaign volume grows.
Make Every Google Ads Report Count and Win Client Loyalty
Google Ads and Looker Studio connection is simpler than most agencies think, and it doesn’t add any extra cost. The trick is to keep it straightforward – track what clients care about, automate time-wasting tasks, and add calculated fields so you can show off metrics like ROAS without repeating manual work.
Also prepare for times when Looker Studio breaks or throws errors up on the screen. Don’t forget about Google Ads reporting alternatives, like Swydo, that help you automate client reports across multiple channels smoothly and seamlessly.
Start with one client account, perfect the setup, then scale it upwards for your other clients. Each clean, automated report is a signal to clients that your agency is organized, professional, and data-driven. The more consistently you deliver, the longer clients stay — and the more likely new ones will knock on your door, tired of agencies drowning in messy, outdated numbers.
Once you’ve mastered Google Ads reporting and set up your first client, Swydo makes scaling effortless. Try it free for 14 days and see how easy multi-channel reporting can be with a solution made for marketing agencies.
Google Ads to Looker Studio FAQ
Common questions about connecting Google Ads data to Looker Studio reports
Yes, Looker Studio is completely free for basic Google Ads reporting. You can create unlimited reports, use the native Google Ads connector, and share reports with clients at no cost. Looker Studio Pro ($10/month) adds automatic data refresh and advanced features, but isn’t required for most agencies.
About 5-10 minutes for a basic connection. Open Looker Studio, create a new report, add Google Ads as your data source, authorize access, and select your account. Creating a polished client report takes 30-60 minutes depending on complexity.
Standard access is recommended. Read-only access works for basic reporting, but Standard access gives you more data options. Your Google email must be added to the client’s Google Ads account before you can connect it in Looker Studio.
Yes, you can connect multiple accounts in the same report or create separate reports for each client. Each account requires separate authorization. Manager accounts (MCC) can access all sub-accounts from one connection.
Yes, Manager accounts (MCC) work perfectly with Looker Studio. Connect your MCC account to access all client accounts in one place. You can create consolidated reports across multiple accounts or separate reports for individual clients.
Check that your Google login matches the email address added to the Google Ads account. Verify the account is active and has recent data. Try signing out and back into both platforms, then reconnect the data source.
This error appears when required permissions are missing or the data source setup wasn’t completed. Remove the data source, re-add it, and fully complete all authorization steps. Ensure you select the correct account and confirm all permission prompts.
Free Looker Studio requires manual refresh – click the three dots menu and select “Refresh data”. Looker Studio Pro enables automatic refresh. Data may also be delayed if campaigns are paused or Google is processing recent changes.
This happens when connections break or permissions change. Go to Resource → Manage added data sources, click Edit on the broken source, and reauthenticate. If that fails, delete the data source and reconnect from scratch.
Check your formula syntax – use proper field names exactly as they appear in the data source. Common formulas: ROAS = Conversion Value / Cost, CPA = Cost / Conversions. Ensure you’re not dividing by zero by adding conditions like IF(Conversions > 0, Cost / Conversions, 0).
Focus on business impact metrics: Conversions, Cost per Acquisition (CPA), Return on Ad Spend (ROAS), and Conversion Rate. Include supporting metrics like Impressions, Clicks, and Click-Through Rate (CTR) for context, but prioritize metrics that directly connect to revenue.
Daily refresh works for most clients. High-spend accounts may need hourly updates, while smaller campaigns can use weekly refresh. Google Ads data has a 2-3 hour processing delay, so real-time data isn’t available anyway.
Yes, click Share → Schedule Delivery to automatically email reports to clients weekly or monthly. Set consistent delivery days so clients expect reports. Include filters so clients can interact with the data while maintaining security.
Go to your data source, click Edit, then + Add a field. For ROAS: Conversion Value / Cost. For CPA: Cost / Conversions. Set field type to Currency for CPA and Number for ROAS. Name fields clearly like “Cost Per Acquisition” for client reports.
Large datasets overwhelm Looker Studio. Limit date ranges, remove unnecessary dimensions, and separate big campaigns onto different pages. For enterprise accounts, consider BigQuery integration to handle large volumes without performance issues.
Yes, but each data source requires separate connections. You can blend Google Ads with Google Analytics, Facebook Ads, Google Sheets, or other connectors in the same report. Third-party tools like Supermetrics simplify multi-channel reporting.
Impressions count total ad views (same person can generate multiple impressions). Reach counts unique people who saw your ad. Reach is only available for Display and Video campaigns, not Search campaigns. Most agencies focus on impressions for Search ads.
Use Google Ads native reporting for quick campaign optimization and single-channel analysis. Choose Looker Studio for client presentations, multi-channel reports, or when you need custom visualizations and automated delivery.
Consider Supermetrics ($47/month) if you manage multiple channels (Google Ads + Facebook + LinkedIn) or need advanced calculated fields. For Google Ads only, the free native connector usually suffices. Factor in per-client costs when managing many accounts.
Agency-focused platforms like Swydo, AgencyAnalytics, or DashThis offer pre-built templates and multi-channel integration. They cost $20-100/month but save setup time. PowerBI or Tableau work for enterprise needs but require technical expertise.
Use BigQuery for enterprise accounts with massive data volumes (millions of impressions monthly), when you need historical data beyond Looker Studio’s limits, or when reports consistently timeout. BigQuery handles large datasets without performance issues.
Google Sheets works for simple reports and data manipulation, but lacks Looker Studio’s visualization options and automatic refresh. Use Sheets as a staging area for data cleaning, then connect to Looker Studio for client-ready dashboards.
Start with free Looker Studio for Google Ads-only reporting. Add Supermetrics ($47/month) when you expand to multi-channel campaigns. Avoid expensive enterprise tools until you’re managing 20+ client accounts consistently.
Skip the complex Google Ads to Looker Studio setup and automate client reports in minutes with Swydo.
Start Your Free Trial Today