LinkedIn Ads delivers 121% ROAS for B2B advertisers in 2026. Google Search comes in at 67%. Meta sits at 51%. So LinkedIn is the only major platform that actually returns more revenue than you spend, according to Dreamdata’s 2026 LinkedIn Benchmarks Report.
But that one number doesn’t decide the question for your clients. Google still grabs high-intent demand faster and cheaper per click. The right mix depends on how long your client’s sales cycle is, how big their deals are, and whether their buyers are actually searching for solutions today.
So which platform should you recommend? It depends on a few things, and we’ll walk through all of them. The data here pulls from 66 million sessions across 3.5 million B2B customer journeys, plus the latest WordStream and PPC Land reporting.
Quick Answer on Which Platform Wins for B2B in 2026
You want a fast read on which platform fits your client? Here’s the short version.
| Client situation | Primary recommendation |
|---|---|
| Deal value over $10K, sales cycle 6+ months, multiple stakeholders | LinkedIn Ads |
| Prospects actively search, sales cycle under 3 months, budget under $3K/mo | Google Ads |
| Budget over $8K/mo, sales cycle 3-6 months, multi-channel attribution | Both platforms |
What’s worth noting? Almost every B2B client now lives in that third row. The average B2B buyer journey runs 272 days and pulls in 10 stakeholders across 4 channels. So a single-platform recommendation is rarely the right answer anymore.
The 2026 B2B Advertising Benchmarks That Actually Matter
These are the numbers you need to defend a platform recommendation in a client meeting. Save this section.
| Metric | LinkedIn Ads | Google Search | Meta Ads |
|---|---|---|---|
| ROAS (average) | 121% | 67% | 51% |
| ROAS (top quartile) | 279% | 138% | 133% |
| Cost per company influenced | $82 | $129 | $151 |
| Average CPC | $7 (avg) | $2-10 (B2B) | $1.87 |
| Share of B2B paid budget | 41% | 46% (full Google network) | 8% |
| Share of influenced new business deals | 36% | 31% | 2% |
A few things jump out here.
LinkedIn’s ROAS climbed from 113% to 121% year over year. Google Search actually fell from 78% to 67%. So the gap is widening, not narrowing.
Then there’s the cost-per-company figure. At $82, LinkedIn reaches a target account for nearly half what Google Search costs. That number flips the whole “LinkedIn is expensive” conversation, and we’ll get into why later.
One more thing worth flagging on Google. The average B2B cost per lead came in at $70.11 in 2025, up just 5.13% year over year, per WordStream’s data. That’s a real slowdown from the prior year’s 25% jump. So Google’s pricing is stabilizing, but its returns aren’t keeping pace.
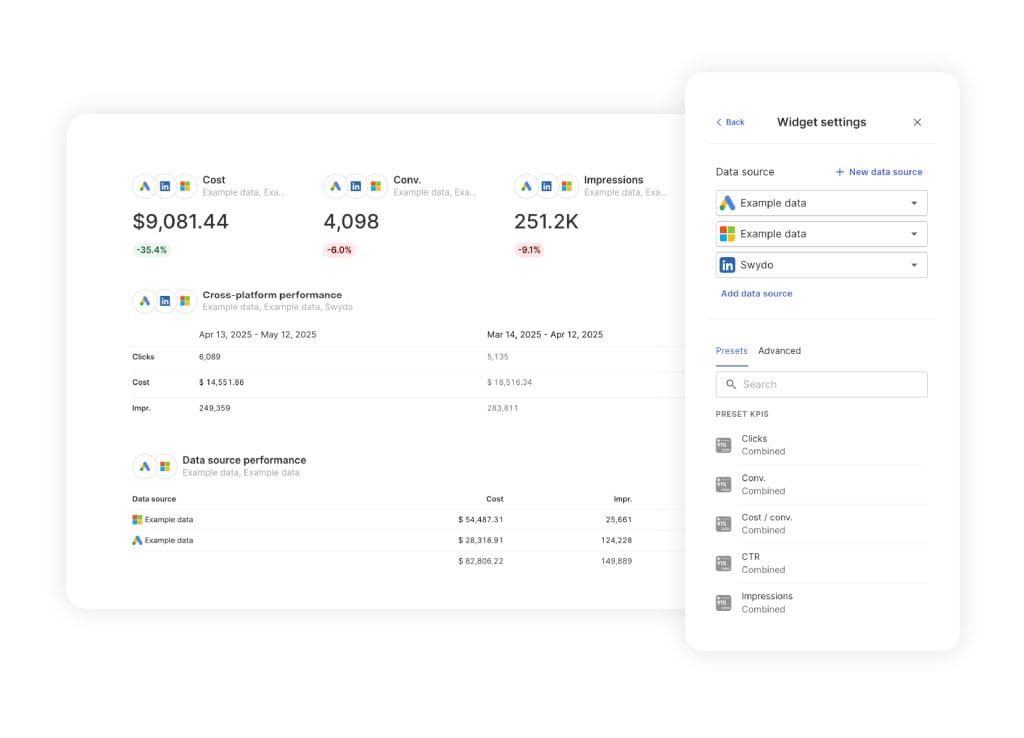
If you’re presenting both platforms in the same client review, you’ll want them on the same page, literally. Swydo’s Combined Data Sources widget uses data blending to pull Google Ads and LinkedIn Ads metrics into a single ROAS or cost-per-conversion view, so your client sees the comparison instead of flipping between dashboards.
The Single Biggest Shift in B2B Advertising
Your client’s buyers take longer to decide than they did a year ago. A lot longer.
The average B2B journey now runs 272 days. That’s up from 211. It involves 88 touchpoints (up from 76), 4 channels (up from 3.7), and 10 stakeholders (up from 6.8). So a 29% increase in journey length happened in just twelve months.
Where did all that extra time go? Almost entirely into the pre-sales window.
Buyers now spend the first 220 days, roughly seven months, in what Dreamdata calls a “silent” self-education phase. They consume content. They form opinions. They build a shortlist. And they do all of that before anyone in your client’s sales pipeline knows they exist.
272 days from first touch to closed deal — and 220 of them happen before your CRM knows the buyer exists
The journey now stretches 29% longer than a year ago. Here’s where it actually breaks down — and why most of it is invisible to last-click attribution.
81% of the buying decision happens during the silent education phase — before sales hears the buyer’s name. If you measure on a 30-day window, you’re grading 11% of the journey.
Here’s the part that changes how you measure campaigns. 81% of the customer journey now happens outside the CRM. So if your client judges LinkedIn on a 30-day window, they’re looking at maybe 11% of the actual journey. That’s like grading a marathon runner on the first mile.
But once buyers do enter the pipeline, something interesting happens. They move faster than before. MQL to SQL dropped from 107 days to 92 days. SQL to closed-won shrank from 62 days to 52 days, per PPC Land’s analysis. So buyers show up later, but they show up better informed.
What does this mean for you? Tell your clients up front that LinkedIn results take 6-12 months to show up in pipeline data. Use cohort-based reporting that groups leads by generation month and measures pipeline at 180 and 365 days out. If you don’t, you’ll watch a client kill their best demand-gen channel because of a weekly dashboard.
When Google Ads Should Be Your Primary Recommendation
Google Ads makes sense when your client’s prospects already know they have a problem. The platform’s 7.52% average conversion rate reflects that. People who click are ready to act.
Recommend Google as primary when these things line up:
- Sales cycle runs under 3 months
- Solution category has real search volume (your client should be able to show you keyword data)
- Client needs leads this quarter, not pipeline for next year
- Budget sits under $3,000 a month
- Audience mixes B2B and B2C
- Product fits a known category like CRM, payroll, or accounting software
But there’s a problem on Google in 2026 you can’t ignore. AI Overviews now appear in roughly 48% of searches, and they’ve driven a 68% drop in paid CTR on the queries where they show up, according to Seer Interactive’s analysis of 3,119 informational queries. B2B Tech queries specifically have seen a 128% jump in AI Overview presence year over year.
So what’s the practical impact for your clients? Top-of-funnel informational stuff, like “what is marketing automation” or “how does ABM work,” is mostly dead on paid search. Your ad shows up below an AI summary that already answered the question. Transactional queries, on the other hand, like “[product name] pricing” or “[competitor] alternative”, still drive strong click volume.
Google Ads is now a bottom-funnel conversion tool. Not a top-funnel awareness driver. Shift your client’s Google budget toward branded terms, competitor terms, and high-intent transactional queries. The era of using Google Search to introduce new B2B categories? It’s over.
When LinkedIn Ads Should Be Your Primary Recommendation
LinkedIn is the only platform delivering positive ROAS for B2B in 2026. And it’s the only platform where you can target by job title, seniority, company size, and industry at the same time.
Think about what that targeting actually does. You can show ads to “VP of Sales at 500-1,000 person SaaS companies in North America.” Google can only show ads to “anyone searching for sales software.” So you’re paying to reach decision-makers, not students or competitors doing research.
Recommend LinkedIn as primary when:
- Average deal value exceeds $10,000
- Sales cycle runs longer than 6 months
- Buying committee has multiple stakeholders (the average is now 10)
- Target audience is highly specific (particular roles, particular company sizes)
- Product or category needs market education
- Account-based marketing drives the strategy
- Budget supports $4,000 a month or more
Here’s the argument that wins client meetings. When clients fixate on CPL, redirect them. LinkedIn might cost $300 per lead while Google costs $70. But cost per company influenced sits at $82 on LinkedIn and $129 on Google. So at the account level, LinkedIn is actually cheaper. Why does that work? Because LinkedIn reaches multiple stakeholders within the same account. So one company gets touched by your ads through several different people, while Google charges you for each unrelated click.
LinkedIn also rolled out a few new things worth knowing about. Accelerate campaigns now use AI to handle targeting, bidding, and creative. They’re useful for fast deployment, but they limit creative testing depth. Predictive Audiences generate high-performing segments based on conversion patterns. Career Journey targeting reaches people based on recent promotions or job changes. And real-time CRM data integration in Campaign Manager lets you optimize toward pipeline, not just leads.
What Each Platform Actually Costs in 2026
Yes, Google costs less per click. And per lead. But that’s only half the story.
| Cost metric | Google Ads (B2B) | LinkedIn Ads |
|---|---|---|
| Average CPC | $2-10 | $5.58-10 |
| Competitive verticals CPC | $8-15 | $15+ in Q3 |
| Average CPL | $70-200 | $150-400 |
| Cost per company influenced | $129 | $82 |
| Minimum testing budget | $1,500-2,000/mo | $4,000-5,000/mo |
| Daily minimum per campaign | None | $10/day |
So LinkedIn is 2-3x more expensive per click and 2-5x more expensive per lead. But here’s where the math gets interesting. LinkedIn returns $1.21 in attributed revenue for every $1 spent. Google returns $0.67. So LinkedIn’s “expensive” leads are cheaper per dollar of revenue generated.
When you walk a client through this, show them the full math. Lead cost matters. Closed-won revenue matters more. The platform with the lower CPL is rarely the platform with the better ROAS in B2B.
How to Split Budget Between Platforms
For clients running both platforms, you split based on sales cycle length. The 2026 industry standard sits at 41% LinkedIn, 46% Google Network (search, display, and YouTube combined), 8% Meta, and 5% other.
But that average doesn’t fit every client. So here’s how to actually split the budget based on what your client sells:
How to split budget between Google and LinkedIn — by sales cycle length
There’s no universal split. The right allocation depends on how long your client’s sales cycle runs. Match the budget to the cycle and both platforms reinforce each other instead of competing.
What’s the minimum spend that makes either platform actually work?
Google alone needs $1,500-2,000 a month. LinkedIn alone needs $4,000-5,000. The older $3,000 LinkedIn floor doesn’t hold anymore because of CPC inflation. Both platforms together need $8,000+ a month to fund three to four months of testing.
If your client can’t commit at those levels for three months, don’t split the budget. Pick one platform and run it well. Splitting too thin produces no usable data on either side.
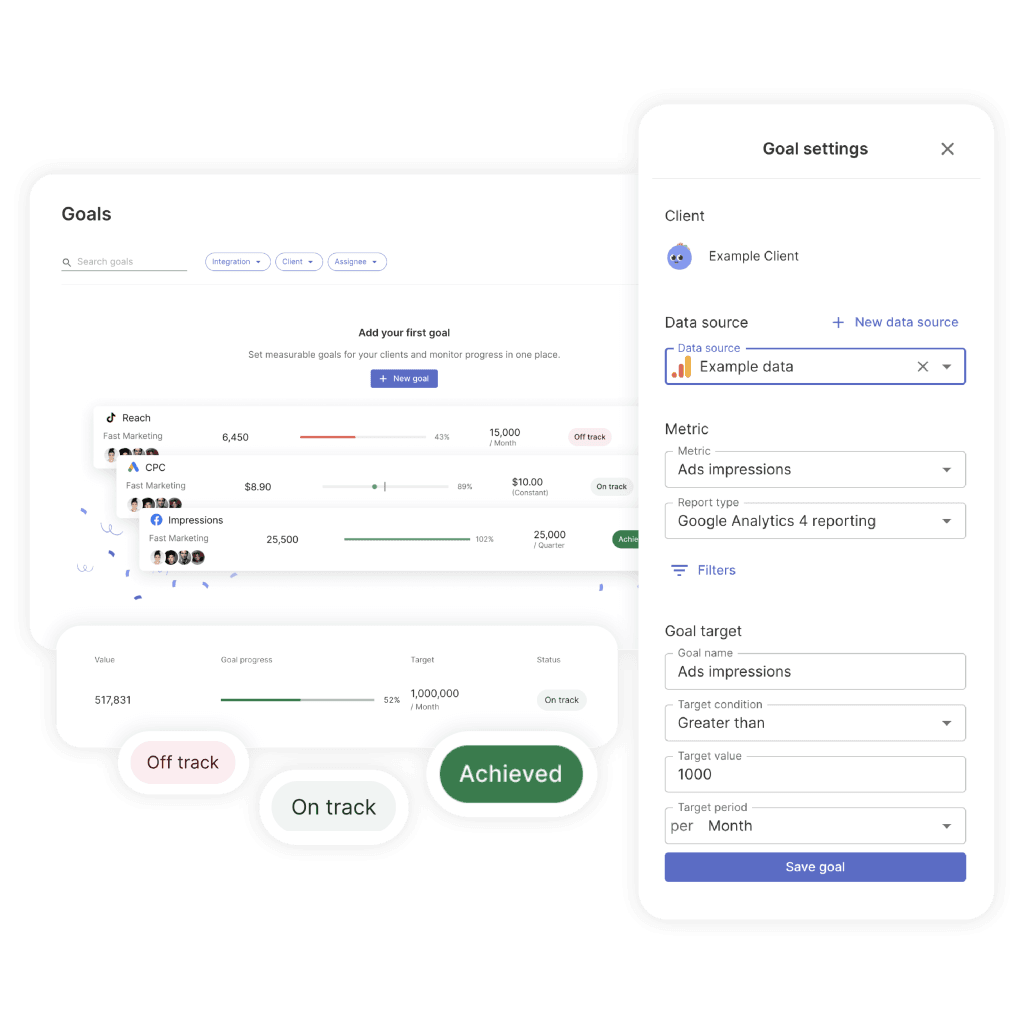
Once budgets are split and running, pacing becomes the next problem. Are you actually spending the LinkedIn allocation? Is Google overspending early in the month? Swydo’s Goals feature shows you On Track, Off Track, or Achieved status against the budget you set, so you catch pacing issues before the client does.
How Each Platform Owns Different Funnel Stages
Here’s the cleanest way to think about it. LinkedIn owns the 220-day silent education phase. Google owns the final conversion window. So they don’t compete with each other. They sequence.
LinkedIn and Google don’t compete — they sequence
Each platform owns a different phase of the buying journey. Get the sequencing wrong and you’ll either pay a premium for traffic that won’t convert, or capture demand you never built.
Buyers self-educate. They consume content, follow thought leaders, and quietly build a shortlist. They are not searching with intent yet.
Buyer enters the pipeline. Compares vendors. Reads reviews and runs comparison searches. Multiple stakeholders weigh in.
Branded and competitor searches spike. Demo requests, pricing checks, and final-stage stakeholder review. The deal closes.
new business deals
For top of funnel, LinkedIn dominates. Use Thought Leader Ads, which deliver up to 1.7x higher CTR than standard single-image ads, per LinkedIn’s own data. Pair them with educational content and Single Image Ads targeted by job title and company size. Google’s role here? Mostly dead, thanks to AI Overviews.
For middle of funnel, both platforms contribute. Run LinkedIn retargeting against your client’s website visitors and engagement audiences. Run Google Ads against comparison and review-style queries like “[your category] vs [competitor]” or “[product] reviews.”
For bottom of funnel, Google takes over. Branded campaigns. Competitor conquest. Direct-response keywords. LinkedIn’s role here is account-level retargeting against engaged ICP accounts.
Why does this matter? LinkedIn influences 36% of new business deals. Google Search influences 31%. Those numbers overlap significantly. Neither platform closes deals alone. So if your client uses last-click attribution, they’re going to give Google all the credit and cut LinkedIn. And then their pipeline is going to dry up six months later. So plan around that now.
The Attribution Problem to Solve First
Last-click attribution is the silent killer of LinkedIn budgets. Here’s why.
LinkedIn typically influences early stages of the journey. Google drives the final conversion. So a last-click model gives Google all the credit. Without proper multi-touch attribution, you’ll keep recommending budget cuts to the platform that actually built the pipeline in the first place. (For a deeper read on the trade-offs between marketing attribution models, we cover them separately.)
Three things you should set up before scaling LinkedIn spend for any client:
- LinkedIn Conversions API (CAPI). 75% of LinkedIn advertisers now use it. CAPI users see 20% lower cost per action and 31% more attributed conversions. This isn’t optional anymore.
- Offline conversion imports to Google Ads. Push closed-deal data back to Google so Smart Bidding optimizes toward revenue, not form fills. 64% of LinkedIn CAPI users now optimize toward pipeline conversions and revenue. Google should be set up the same way.
- Multi-touch or data-driven attribution. When LinkedIn engagement gets included in the model, the picture of channel performance shifts dramatically.
Without these three things in place? You’re guessing. So is your client.
If you’re tracking pipeline metrics across both platforms, Swydo’s Monitoring Boards let you watch the KPIs that matter (cost per qualified lead, MQL-to-SQL, pipeline generated) and trigger alerts when something turns red. So instead of finding out about a tanking campaign in the next monthly report, you find out the day it happens.
Performance Metrics for Setting Realistic Client Expectations
Before you set client expectations, know what realistic looks like on each platform. (If you want a fuller breakdown of which Google Ads metrics actually move the needle for B2B, we cover them separately.)
| Metric | Google Ads (B2B) | LinkedIn Ads |
|---|---|---|
| CTR | 3.0-3.5% | 0.44-0.65% (peak Q3: 0.96-1.05%) |
| Conversion rate | 7.52% (1.5-3% for B2B SaaS) | 0.5-0.65% on platform |
| Cost per lead | $70-200 | $150-400 |
| Average ROAS | 67% | 121% |
| Top-quartile ROAS | 138% | 279% |
Here’s the part most agencies get wrong on LinkedIn measurement. 30-day ROAS on LinkedIn is structurally bad. Often 0.1-0.3x, even for well-performing programs. 90-day ROAS sits at 0.3-0.8x. Real performance shows up at 180 days (1.5-3.0x) and 365 days (3.0-6.0x).
Same campaigns. Same spend. Wildly different ROAS depending on when you measure.
If your client judges LinkedIn on a 30-day window, they’ll conclude it’s failing — when it’s actually their strongest pipeline source. The journey takes 272 days. Your measurement has to match.
Set the expectation upfront with clients: LinkedIn results take 6–12 months to surface in pipeline data. Use cohort-based reporting at 180 and 365 days, or watch a client kill their best demand-gen channel because of a weekly dashboard.
So if your client measures LinkedIn on monthly or quarterly windows, they’ll conclude it’s failing when it’s actually their strongest pipeline source. The journey takes 272 days. So your measurement window has to match.
What Most Agencies Get Wrong
Five mistakes show up over and over. Have you done any of these for a client? (We dig into more agency-specific habits in our client reporting best practices guide if you want the broader playbook.)
Mistake one is using the same landing pages for both platforms. Google traffic runs hot. They’re ready to evaluate. So use direct, product-focused landing pages with strong CTAs like “Request demo” or “Start free trial.” LinkedIn traffic runs cold. They weren’t shopping. So use educational content and softer CTAs like “Get the guide” or “Watch the webinar.”
Mistake two is judging LinkedIn too quickly. A 30-day evaluation will always show negative ROAS. Always. Commit to six months minimum and use cohort-based measurement.
Mistake three is the optimization toward form fills. Track which leads become customers. Then feed that data back to both platforms via CAPI and offline conversion imports. Both platforms’ machine learning works better when it optimizes toward closed deals.
Mistake four is the failure to account for AI Overviews. If your client’s Google strategy still relies on top-of-funnel informational queries, AI Overviews ate that traffic. Shift toward bottom-funnel transactional and branded queries.
Mistake five is treating CPL as the headline metric. LinkedIn’s CPL will always look bad next to Google’s. The metric that matters? Cost per closed-won deal. And on that one, LinkedIn’s 121% ROAS versus Google’s 67% tells the truth.
The Bottom Line for Agencies
So your value isn’t in declaring a winner. It’s in matching the platform mix to each client’s specific sales motion, deal economics, and timeline. The 2026 data is clear. LinkedIn is the only platform delivering positive B2B ROAS. But Google still owns the final conversion window for buyers ready to act.
What should you do differently right now versus a year ago?
- Stop evaluating LinkedIn on monthly windows. With 272-day buyer journeys, anything shorter than 180 days is just measuring noise.
- Account for the AI Overview impact on Google’s top-funnel performance. Google’s role has shifted toward bottom-funnel capture. Your budget allocation should follow.
- Measure cost per company influenced, not just cost per lead. $82 for LinkedIn versus $129 for Google Search at the company level. Even though Google looks cheaper at the lead level.
So how does your current client mix line up against this? If you’re still running LinkedIn at last year’s $3,000 floor, or judging it on quarterly ROAS, or pushing all budget to Google because the CPL looks better, you’re leaving pipeline on the table.
When you’re ready to show clients the full picture across both platforms, Swydo pulls Google Ads and LinkedIn Ads data into the same client report, so the comparison sits in front of them every month, not just at quarterly business reviews.
(For a deeper read on Google Ads reporting for agencies, we have a separate guide on that side of the workflow.) You can start a 14-day free trial here, no credit card needed, and see if it fits how your team reports.
LinkedIn Ads vs Google Ads for B2B: FAQ
Direct answers to the questions B2B marketers and agencies are actually asking
LinkedIn delivers better return: 121% ROAS versus Google Search at 67%. But Google captures high-intent demand faster and cheaper per click. The right answer depends on sales cycle length, deal size, and whether buyers are actively searching.
Use LinkedIn when deals exceed $10K, cycles run 6+ months, or you need to reach specific job titles. Use Google when prospects are actively searching, cycles are under 3 months, or budget is tight. Most B2B clients should run both.
LinkedIn Ads has the highest B2B ROAS at 121%, followed by Google Search at 67% and Meta at 51%. LinkedIn is the only major platform returning more revenue than spend on average.
Top-quartile performers see 279% ROAS on LinkedIn versus 138% on Google Search. The gap has widened year over year as LinkedIn’s ROAS climbed from 113% to 121% while Google Search fell from 78% to 67%.
Start with Google if your category has search demand and you need leads this quarter. Start with LinkedIn if you sell high-ticket deals to specific roles and need to build pipeline for the next two quarters.
One platform run well beats two platforms run thin. If your monthly budget is under $4,000, pick one. Above $8,000/month, run both with budget split based on your sales cycle length.
Meta delivers only 51% ROAS for B2B and influences just 2% of new business deals despite holding 8% of average B2B paid budgets. Targeting professional buyers by job function is much weaker than on LinkedIn.
Meta can work for B2B retargeting and brand awareness at scale, but it shouldn’t be a primary platform for lead generation or pipeline building. The CPC advantage doesn’t translate into qualified pipeline.
LinkedIn is worth it only if your average deal value exceeds $10,000 and you can commit at least $4,000-5,000 per month for six months. Below those thresholds, the math rarely works for small businesses.
Small B2B companies with lower-ticket products are usually better served by Google Search for high-intent capture, plus organic LinkedIn content and outbound to support the funnel without paying LinkedIn’s premium CPCs.
The average B2B buyer journey runs 272 days from first touch to closed deal, up from 211 days the previous year. That’s a 29% increase in journey length in just twelve months.
Each journey now involves 88 touchpoints across 4 channels and 10 stakeholders. Any campaign measurement window shorter than six months is sampling a fraction of the actual journey.
The silent phase is the roughly 220-day stretch (about seven months) where buyers self-educate before contacting sales. They consume content, follow thought leaders, build a shortlist, and form opinions — all invisibly to your CRM.
This phase represents 81% of the total buying decision. By the time a buyer raises their hand, most of the platform comparison has already happened. That’s why awareness-stage advertising on LinkedIn outperforms last-click attribution suggests.
The average B2B buying committee now includes 10 stakeholders, up from 6.8. Multiple roles weigh in: economic buyers, end users, technical evaluators, procurement, executive sponsors, and internal champions.
This is why account-level metrics matter more than lead-level metrics. Reaching one company through several stakeholders (LinkedIn’s strength) outperforms paying for ten unrelated clicks (Google’s model) when deals require committee buy-in.
Total cycles are getting longer (272 days vs 211), but in-pipeline cycles are getting shorter. MQL-to-SQL dropped from 107 days to 92 days. SQL-to-closed-won shrank from 62 days to 52 days.
The implication: buyers spend more time researching before reaching out, but once they do, they move faster because they’re better informed. Your top-of-funnel content does more work than ever, and your sales team handles fewer but more qualified conversations.
About 81% of the B2B buyer journey now happens outside the CRM, before any sales contact is made. Of the 272-day average journey, 220 days occur before the buyer enters your pipeline.
This is the core argument for awareness-stage spending. If you only fund bottom-of-funnel campaigns targeting in-market searchers, you’re competing for buyers whose vendor preferences were already shaped by the brands they saw during the silent phase.
LinkedIn CPCs typically run $5.58 to $10, with competitive verticals exceeding $15 in peak quarters. Cost per lead lands between $150 and $400. The minimum testing budget that produces usable data is $4,000-5,000 per month.
Daily campaign minimums start at $10/day, but spending below $4K/month leaves you with too little volume to optimize creative, audiences, or bidding. The old $3K floor no longer holds because of CPC inflation.
Google B2B CPCs range from $2 to $10 depending on category, with competitive software and finance verticals reaching $8-15. Average B2B cost per lead sits at $70-200. Minimum testing budget is around $1,500-2,000 per month.
Google’s cost per lead has stabilized recently, growing only about 5% year over year compared to a 25% jump the prior year. But ROAS has fallen, meaning leads cost roughly the same while converting at lower rates.
LinkedIn is 2-3x more expensive per click and 2-5x more expensive per lead because every impression reaches a verified professional and you can target by exact job title, seniority, company size, and industry simultaneously. Google can only target search intent, which is broader and less precise.
The premium pays off at the company level. LinkedIn’s cost per company influenced is $82 versus Google’s $129, because LinkedIn touches multiple stakeholders within the same account while Google charges separately for each click.
Cost per company influenced measures spend at the account level rather than the lead level. It’s calculated by dividing total spend by the number of unique target accounts your ads reached, regardless of how many people inside that account engaged.
It matters because B2B deals close at the account level, not the lead level. LinkedIn’s $82 versus Google’s $129 reflects how multi-stakeholder reach inside a single buying committee is more efficient than scattered clicks across unrelated companies.
Split based on sales cycle length. For cycles under 3 months: 65% Google, 35% LinkedIn. For 3-6 month cycles: 50/50. For cycles over 6 months: 35% Google, 65% LinkedIn.
The B2B industry average sits at 41% LinkedIn, 46% Google Network, 8% Meta, and 5% other. Use that as a benchmark, not a default. The optimal mix depends on your specific sales motion, not market averages.
Google alone needs at least $1,500-2,000/month. LinkedIn alone needs $4,000-5,000/month. Running both requires $8,000+/month for three to four months of meaningful testing.
Below these thresholds, results are statistically noisy and you can’t tell whether the platform isn’t working or you’re just under-funded. When in doubt, pick one platform and run it well.
Real LinkedIn results take 6-12 months to surface in pipeline data because the average B2B buyer journey is 272 days. At 30 days, ROAS typically looks like 0.1-0.3x. At 90 days, 0.3-0.8x. Real performance shows at 180 days (1.5-3.0x) and 365 days (3.0-6.0x).
If you measure LinkedIn on a 30-day window, you’re seeing about 11% of the actual journey. Use cohort-based reporting that groups leads by generation month and tracks pipeline at 180 and 365 days out.
LinkedIn looks like it’s failing on short windows because 81% of the buyer journey happens before pipeline entry. Monthly reports capture clicks and form fills but miss the influence on deals that close 6-9 months later.
Last-click attribution makes this worse: it credits Google for closing deals that LinkedIn actually built. Switch to multi-touch or data-driven attribution and the picture flips.
LinkedIn CAPI is a server-side conversion tracking method that sends conversion data directly from your CRM or backend to LinkedIn, bypassing browser-based tracking limitations. Around 75% of LinkedIn advertisers now use it.
CAPI users see 20% lower cost per action and 31% more attributed conversions on average. It’s no longer optional for serious B2B programs. Combine it with offline conversion imports so LinkedIn’s algorithms optimize toward closed deals, not just form fills.
Use multi-touch or data-driven attribution, not last-click. Last-click systematically under-credits awareness platforms like LinkedIn and over-credits closing platforms like Google branded search.
The ideal setup combines CAPI on LinkedIn, offline conversion imports on Google, and a multi-touch model that includes all touchpoints across the 272-day journey. Without this, you’ll defund the channels actually building your pipeline.
Cost per closed-won deal is the only KPI that tells the truth in B2B. CPL alone always favors Google because Google’s leads are cheaper. But Google’s leads convert at lower rates and produce smaller deals, which is why its 67% ROAS trails LinkedIn’s 121%.
If full revenue attribution isn’t possible yet, use cost per company influenced as an intermediate metric. It captures account-level economics without requiring fully integrated revenue data.
Each platform has different baseline benchmarks. Use these to calibrate expectations:
| Metric | Google Ads (B2B) | LinkedIn Ads |
|---|---|---|
| CTR | 3.0-3.5% | 0.44-0.65% |
| Conversion rate | 7.52% | 0.5-0.65% |
| Cost per lead | $70-200 | $150-400 |
| Average ROAS | 67% | 121% |
Don’t compare platforms on the same metric in isolation. LinkedIn’s lower CTR isn’t worse performance — it’s a different mechanism (interruption vs intent) reaching different buyers at different funnel stages.
AI Overviews now appear in roughly 48% of searches and have caused a 68% drop in paid CTR on those queries. B2B Tech queries have seen a 128% jump in AI Overview presence year over year. Top-of-funnel informational queries like “what is marketing automation” no longer drive meaningful paid traffic.
Google Ads is now a bottom-funnel tool. Shift budget to branded terms, competitor terms, and high-intent transactional queries like “[product] pricing” or “[competitor] alternative.” Let LinkedIn handle the awareness work.
Thought Leader Ads outperform standard formats with up to 1.7x higher CTR than single-image ads. They show ads as content from a real person at your company, which feels less like advertising and more like a peer recommendation.
Other strong formats: Single Image Ads with job-title targeting for awareness, Document Ads for gated content, Conversation Ads for ABM outreach, and retargeting Carousel Ads against engaged ICP accounts. Video works for thought leadership but rarely beats Thought Leader Ads on cost per engagement.
LinkedIn Accelerate campaigns use AI to automate targeting, bidding, and creative selection. You provide a landing page and basic inputs, and LinkedIn’s algorithm builds the audience and tests variations automatically.
They’re useful for fast deployment when you don’t have time to build campaigns manually, but they limit creative testing depth and audience visibility. Use them for awareness campaigns or as a baseline to beat with manual campaigns, not as your primary ABM strategy.
Predictive Audiences uses LinkedIn’s machine learning to generate lookalike-style segments based on patterns in your existing converters. You upload conversion data or seed audiences, and LinkedIn finds professionals matching the underlying behavioral signals of buyers most likely to convert.
It’s most effective when paired with CRM data showing closed-won deals, since the algorithm optimizes toward whatever outcome you feed it. Garbage in, garbage out — feeding it form fills produces lookalike form fillers, not lookalike customers.
No. Google traffic runs hot — they’re actively searching and ready to evaluate. Use direct, product-focused pages with strong CTAs like “Request demo” or “Start free trial.”
LinkedIn traffic runs cold — they weren’t shopping when your ad interrupted them. Use educational content with softer CTAs like “Get the guide,” “Watch the webinar,” or “Read the report.” Pushing demo requests to cold LinkedIn traffic tanks conversion rates and makes the platform look like it’s failing.
LinkedIn owns top of funnel during the 220-day silent phase: Thought Leader Ads, educational content, awareness campaigns by job title and company size. Google’s top-funnel role is mostly dead due to AI Overviews.
Both platforms contribute at middle of funnel. LinkedIn handles website visitor retargeting; Google handles comparison and review queries. Bottom of funnel belongs to Google: branded search, competitor conquest, high-intent direct-response. LinkedIn’s bottom-funnel role is account-level retargeting against engaged ICP accounts.
Five mistakes show up repeatedly: using identical landing pages for both platforms, judging LinkedIn on a 30-day window, optimizing toward form fills instead of closed-won data, ignoring how AI Overviews killed top-funnel Google performance, and treating CPL as the headline metric instead of cost per closed deal.
The fix for all five is the same idea: align measurement, creative, and budget with how B2B buyers actually move through a 272-day journey involving 10 stakeholders, instead of optimizing for the metrics that show up fastest in dashboards.
Give clients one report that tells the real story across LinkedIn, Google, and beyond.
Start Your Free Trial Today