
Google Analytics 4 (GA4) is a game-changer for marketing agencies in 2025. As someone who’s been working with data for a while, I can confidently say that GA4 is essential for understanding user behavior and engagement.
GA4’s event-based data model and user-centric approach provide a comprehensive understanding of user behavior across devices and platforms. This allows you to effectively attribute your efforts and demonstrate the value you bring to your clients.
With GA4, you can track valuable insights into user behavior and website performance, enabling you to align GA4 metrics with your clients’ business objectives. You can monitor website traffic, conversion rates, and user engagement to provide your clients with a clear picture of how their marketing investments translate into tangible results.
Let’s explore the key metrics in Google Analytics 4 that you should focus on.
10 Key GA4 Metrics to Track
Why It’s Important: Reveals the size of your audience and provides insights into cross-device behavior.
What It Measures: Unique visitors identified by various user identifiers.
How It Works: GA4 collects and aggregates user data automatically.
Benchmark: Varies by industry and site objectives.
Best For: Understanding audience trends and growth patterns.
Related Metrics: Sessions, Engagement Rate.
Common Pitfalls: Overlooking the difference between new and returning users.
Why It’s Important: Indicates overall site activity and the effect of your campaigns.
What It Measures: Groups of user interactions within a specific timeframe.
How It Works: GA4 automatically starts a new session after a set period of inactivity.
Benchmark: Depends on your website’s traffic patterns.
Best For: Analyzing the volume of traffic and campaign performance.
Related Metrics: Users, Engagement Rate.
Common Pitfalls: Misconfigured session timeouts can distort session counts.
Why It’s Important: Helps determine how many sessions are meaningful based on user interaction.
What It Measures: The percentage of sessions that last longer than 10 seconds, involve a conversion, or include multiple page views.
How It Works: GA4 calculates this automatically based on session behavior.
Benchmark: Varies by content type and industry.
Best For: Evaluating content performance and user interaction.
Related Metrics: Average Engagement Time.
Common Pitfalls: Relying solely on default criteria may not capture all meaningful interactions.
Why It’s Important: Measures the average duration users interact with your site or app.
What It Measures: The active time users spend on your content.
How It Works: Tracked automatically by GA4 to show true user engagement.
Benchmark: Industry-specific and depends on the type of content.
Best For: Assessing content effectiveness.
Related Metrics: Engagement Rate.
Common Pitfalls: May include idle time if not properly configured.
Why It’s Important: Provides a detailed view of how users interact with specific elements on your site.
What It Measures: The total number of specific actions (such as clicks, video plays, or form submissions).
How It Works: GA4 tracks events automatically and via custom implementation.
Benchmark: Varies with the type of interaction and site purpose.
Best For: Understanding the popularity of features and content.
Related Metrics: Conversions.
Common Pitfalls: Overloading event tracking can clutter data and make analysis challenging.
Why It’s Important: Directly ties marketing efforts to achieving business goals.
What It Measures: The number of times users complete a predefined valuable action.
How It Works: Set up by marking specific events as conversions in GA4.
Benchmark: Depends on the nature of your campaigns and goals.
Best For: Evaluating campaign effectiveness.
Related Metrics: Event Count, Session Conversion Rate.
Common Pitfalls: Neglecting to track intermediate actions can hide full conversion paths.
Why It’s Important: Indicates the percentage of sessions where users have minimal interaction.
What It Measures: Sessions that end without significant engagement.
How It Works: Calculated as the ratio of non-engaged sessions to total sessions.
Benchmark: Lower rates generally indicate better performance.
Best For: Evaluating landing page performance.
Related Metrics: Engagement Rate.
Common Pitfalls: Misinterpreting bounce rate on single-page applications can lead to false conclusions.
Why It’s Important: Shows the percentage of sessions that result in a conversion.
What It Measures: Conversion events divided by the total number of sessions.
How It Works: Automatically calculated by GA4.
Benchmark: Varies by campaign and industry.
Best For: Assessing immediate conversion performance.
Related Metrics: Conversions.
Common Pitfalls: Ignoring multi-session behavior may lead to incomplete insights.
Why It’s Important: Shows which pages or screens capture the most attention.
What It Measures: The total number of times a page or screen is viewed.
How It Works: GA4 tracks pageviews and screen views automatically.
Benchmark: Dependent on the size and scope of your site.
Best For: Evaluating content reach.
Related Metrics: Views per User.
Common Pitfalls: High view counts do not always equate to quality engagement.
Why It’s Important: Measures how deeply users explore your content.
What It Measures: The average number of pages or screens viewed by each user.
How It Works: Calculated automatically by GA4 based on total views and unique users.
Benchmark: Varies by content type and audience behavior.
Best For: Understanding content stickiness.
Related Metrics: Views.
Common Pitfalls: Data may be skewed if users switch between multiple devices.
Users
Users is a fundamental metric for understanding your audience.
Why Users Metric is Important
The Users metric provides insights into your audience size, growth trends, and overall reach, which is fundamental to any marketing strategy.
What Users Metric Measures
GA4 tracks users across devices and platforms, providing a more unified view of user behavior than previous versions of Google Analytics. It uses a machine learning model and various user identifiers (User ID, Google signals, Device ID) to identify users even when cookies are disabled. This allows agencies to gain a more accurate understanding of user behavior across different touchpoints and attribute marketing efforts more effectively.
User Types
- Total Users The total number of unique visitors to your website or app.
- Active Users The number of users who have had an engaged session or for which GA4 collects certain parameters.
- New Users The number of first-time visitors to your website or app.
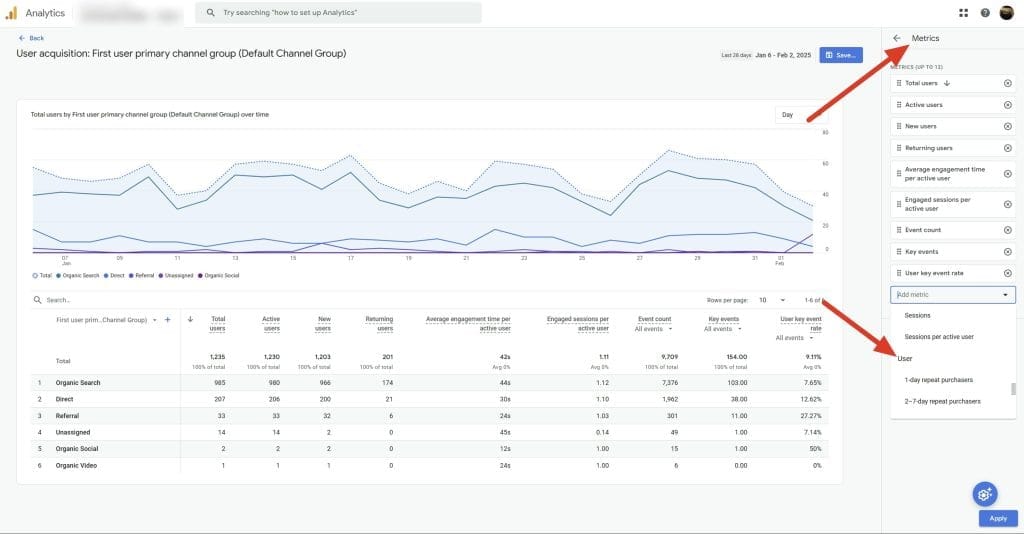
How to Track Users
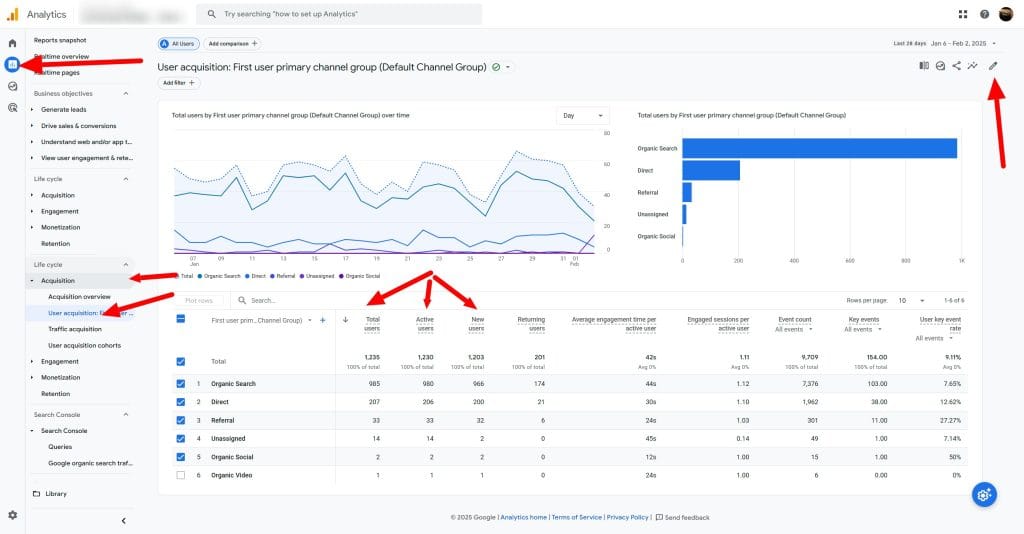
GA4 automatically collects user data. Access user-centric reports in the “Reports” section under “Acquisition” > “User acquisition”. For a more granular view, use the “User Explorer” report under “Explore”.
User Data Analysis
Use the “User acquisition” report to understand where your users are coming from and which channels are driving the most traffic. Segment your user data by demographics, interests, and behaviors to identify high-value audiences and tailor your marketing strategies accordingly. Monitor user trends over time to gauge the effectiveness of your acquisition and retention efforts.
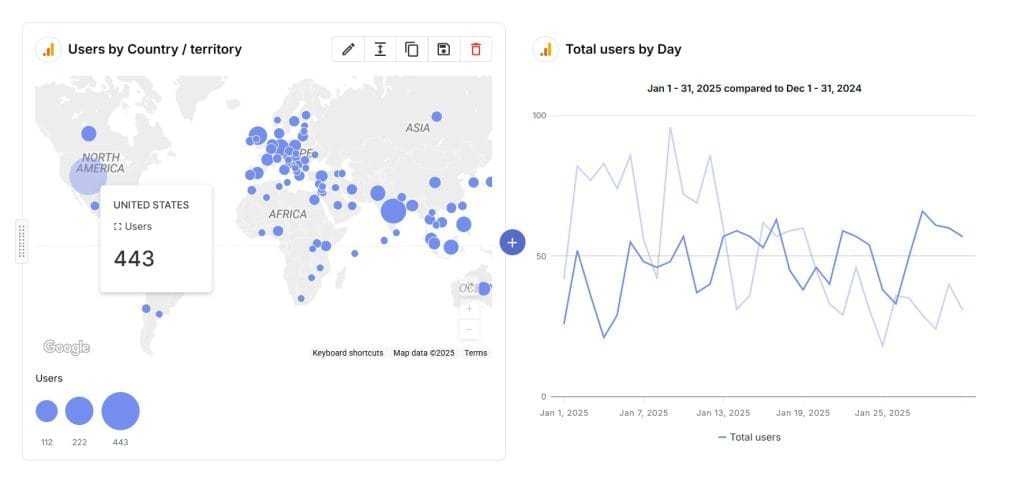
User Data Visualization
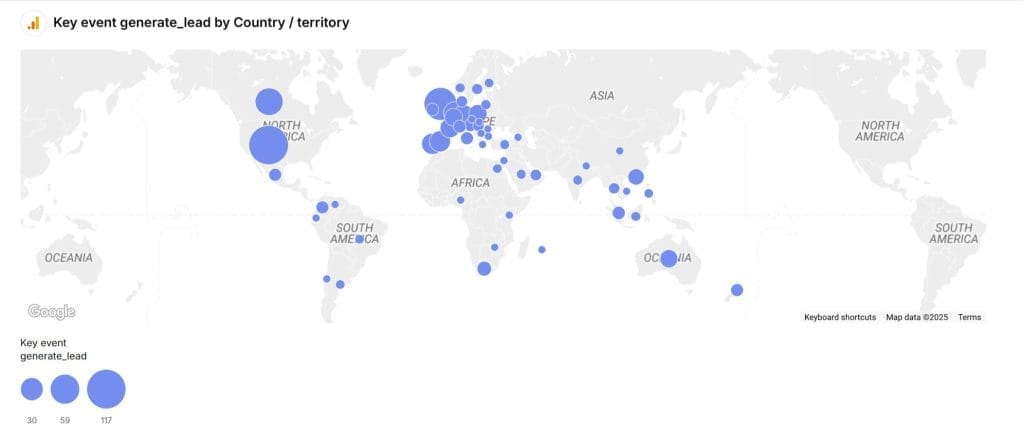
Use the “Users by country” map in the “User acquisition” report to visualize your user distribution geographically. Create a line graph of “Total Users” over time to track audience growth trends. Use a pie chart to visualize the breakdown of New vs. Returning Users.
Common Pitfalls with GA4 User Metrics
Let’s go over a few ways user metrics in GA4 can lead you astray. These pitfalls affect reporting and decision-making, so understanding them helps you measure your audience more accurately.
Problem: Some reports rely on Total Users when Active Users is more realistic, which can create inflated numbers.
Why This Matters: Total Users counts anyone who visited the site, while Active Users refers to those who actually do something meaningful.
Better Approach:
- Look at Active Users for genuine engagement and performance checks.
- Use Total Users for overall reach and growth patterns.
- Build segments that separate user types.
- Set up custom dimensions for deeper engagement insights.
Problem: GA4’s cross-device tracking can count one person more than once if they aren’t signed in or switch devices.
Why This Matters: This leads to inflated user counts and can mess with conversion data.
Better Approach:
- Implement User ID for visitors who log in.
- Turn on Google signals for better cross-device tracking.
- Use client ID as a custom dimension.
- Build segments that account for device switching.
Sessions
Sessions provide valuable context for understanding user behavior and engagement.
Why Sessions Metric is Important
Sessions help assess the effectiveness of marketing campaigns in driving traffic and conversions within a specific timeframe.
What Sessions Metric Measures
In GA4, a session is a group of user interactions with your website or app that take place within a given time frame. These interactions can include page views, events, and other actions users take on your site or app.
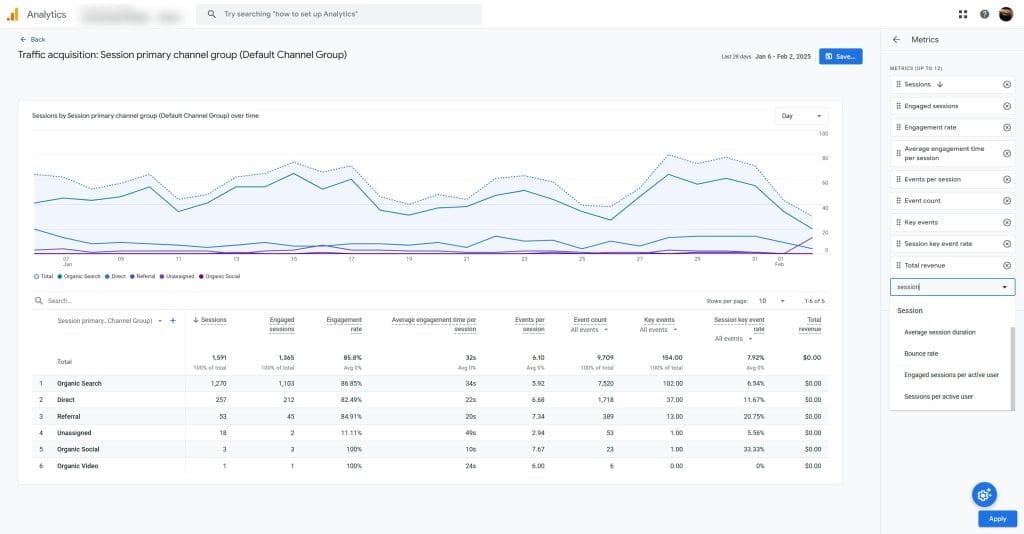
How to Track Sessions
GA4 automatically tracks sessions. Find session data in the “Reports snapshot” under “Reports”. For a more detailed analysis, use the “Traffic acquisition” report under “Reports” > “Acquisition”.
Session Data Analysis
Monitor session trends over time to identify patterns and anomalies in user engagement. Analyze sessions by traffic source to understand which channels are driving the most engaged users. Compare session metrics (e.g., Average Session Duration, View per Session) across different user segments to identify high-value audiences.
Session Data Visualization
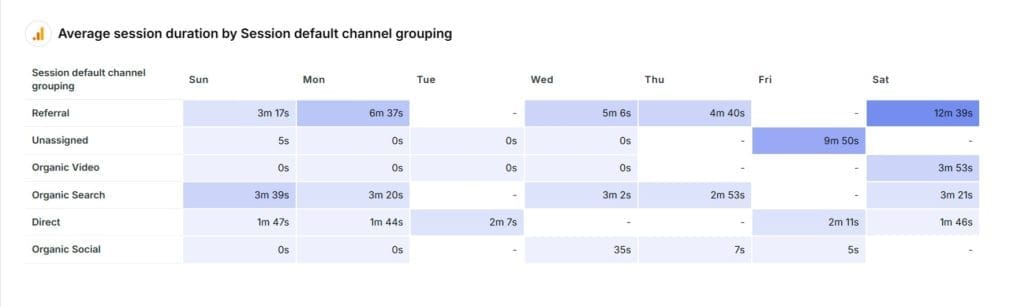
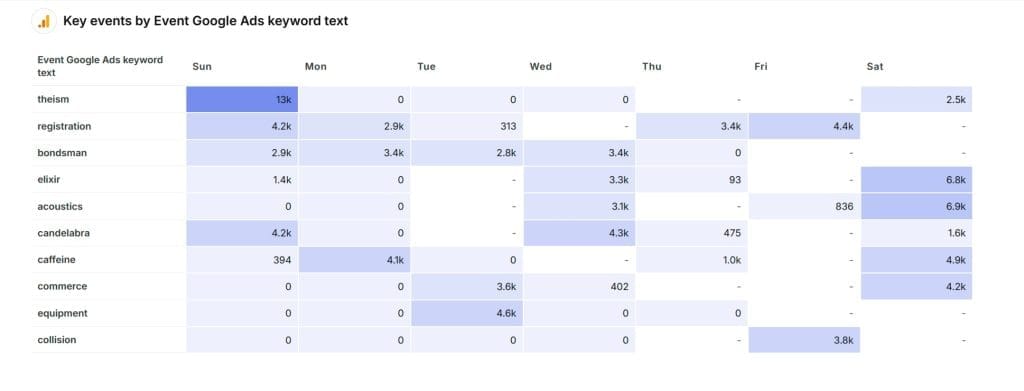
Use a line graph to visualize session trends over time, with annotations for major events or campaigns. Create a bar chart comparing sessions by traffic source or campaign. Use a heat map to visualize session activity by day of the week and time of day.
Common Pitfalls with Sessions Metric
Session counts in GA4 might differ from previous versions of Google Analytics due to changes in how sessions are defined. And data on sessions can fool you if not handled well, so here’s how to keep your numbers accurate. Here are a few common pitfalls to avoid:
Problem: Default session timeout settings may not align with your site’s typical user behavior, which can lead to artificially split or combined sessions.
Why It Matters: Incorrect session counts affect all session-based metrics, including conversion rates and engagement data.
Solution:
- Analyze your typical user journey length
- Adjust session timeout settings based on real behavior
- For content-focused sites: Consider longer timeouts (30+ minutes)
- For e-commerce sites: Shorter timeouts might be more appropriate
- Monitor how timeout changes affect key metrics
Problem: GA4 doesn’t end a session when campaign parameters change, which alters how campaign attribution is recorded.
Why It Matters: This impacts campaign performance measurement and ROI assessments.
Solution:
- Use UTM parameters across campaigns
- Create custom channel groupings for more precise attribution
- Incorporate campaign-specific event parameters
- Adopt data-driven attribution models for better insights
Engagement Rate
Engagement Rate helps measure how engaging your website or app content is to your users.
Why Engagement Rate Metric is Important
Engagement Rate is a key metric for understanding how well your content resonates with your audience.
What Engagement Rate Metric Measures
Engagement Rate measures the percentage of engaged sessions. An engaged session is one that lasts longer than 10 seconds, has a conversion event, or has two or more page views.
Engagement Rate Calculation
How to Track Engagement Rate
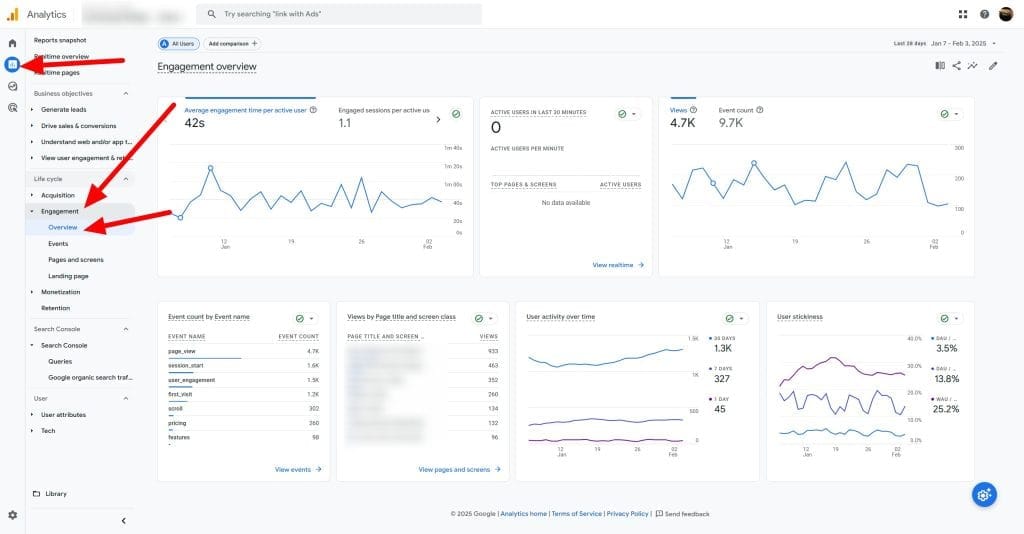
GA4 automatically calculates Engagement Rate. Find this data in the “Engagement” > “Overview” report under “Reports” > “Life cycle”.
Engagement Rate Analysis
Monitor Engagement Rate over time to identify trends and patterns in user engagement. Compare Engagement Rate across different pages, screens, or pieces of content to identify top performers and areas for improvement. Analyze Engagement Rate by traffic source or user segment to understand which audiences are most engaged.
Engagement Rate Visualization
Use a line graph to visualize Engagement Rate trends over time. Create a bar chart comparing Engagement Rate across different pages or screens. Use a scatter plot to visualize the relationship between Engagement Rate and other metrics like Conversion Rate or Average Engagement Time.
Common Pitfalls with Engagement Rate Metric
Avoid these common pitfalls so that your metrics reflect genuine user interactions. Engagement rates can be misleading if they are not set up correctly. And a low Engagement Rate might indicate that your content is not resonating with your audience or that there are issues with website usability.
Problem: GA4’s default engagement criteria (10+ seconds, 2+ page views, or a conversion) may not reflect meaningful engagement for your site.
Why It Matters: This can lead to inflated engagement rates that don’t correlate with actual user value.
Solution:
- Define custom engagement events tailored to your content
- Create engagement thresholds based on real user behavior
- Implement scroll depth tracking for content-heavy pages
- Set up custom metrics for more detailed engagement insights
Problem: Different types of pages naturally have different engagement patterns, but using a one-size-fits-all approach leads to inaccurate insights.
Why It Matters: This can cause misinterpretation of performance, overlooking real issues or false positives.
Solution:
- Compare engagement rates within similar page types
- Create segments for page types like product pages, blog posts, and landing pages
- Set unique engagement thresholds for each page type
- Use custom metrics designed for specific content categories
Average Engagement Time
Average Engagement Time provides valuable insights into the quality of user engagement and the effectiveness of your content in holding users’ attention.
Why Average Engagement Time Metric is Important
Average Engagement Time is a crucial metric for assessing how well your content captures and maintains user interest.
What Average Engagement Time Metric Measures
This metric measures the average duration users actively engage with your website or app during a session. It focuses on active interaction, unlike previous metrics that might include inactive time. This provides a more accurate measure of how long users are truly engaged with your content.
How to Track Average Engagement Time
GA4 automatically tracks Average Engagement Time. Find this data in the “Engagement” > “Overview” report under “Reports” > “Life cycle”.
Average Engagement Time Analysis
Monitor Average Engagement Time over time to identify trends in user engagement. Compare Average Engagement Time across different pages, screens, or pieces of content to identify top performers and areas for improvement. Analyze Average Engagement Time by traffic source or user segment to understand which audiences are most engaged.
Average Engagement Time Visualization
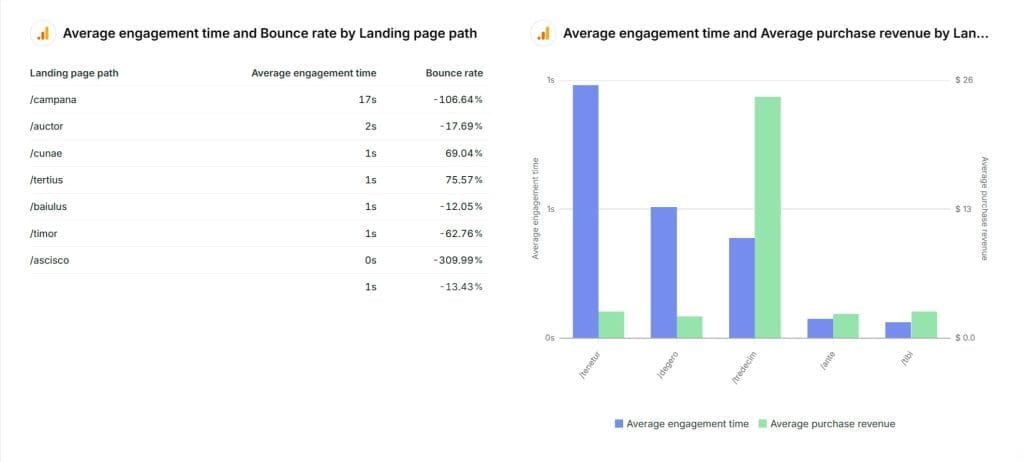
Use a line graph to visualize Average Engagement Time trends over time. Create a bar chart comparing Average Engagement Time across different pages or screens. Use a Table to visualize the relationship between Average Engagement Time and other metrics like Conversion Rate or Bounce Rate.
Common Pitfalls with Average Engagement Time Metric
Average Engagement Time can be misleading if it doesn’t reflect real user interactions. Analyze Average Engagement Time alongside other engagement metrics like Bounce Rate and Conversion Rate for a more comprehensive understanding. Here are common pitfalls to watch out for when analyzing this metric in GA4.
Problem: The default measurement doesn’t differentiate between active user interaction and idle time on the page.
Why It Matters: This can inflate engagement metrics, making it seem like users are more engaged than they actually are.
Solution:
- Implement custom timer events that pause during user inactivity
- Track interaction events such as scrolls, clicks, and form inputs
- Create custom calculations that only count active engagement periods
- Set thresholds to exclude suspiciously long sessions
Problem: Users often keep multiple tabs open, which can lead to inaccurate engagement time measurements.
Why It Matters: This can result in overestimated engagement metrics, leading to misguided content optimization efforts.
Solution:
- Implement visibility API tracking to detect when a tab is active
- Create custom metrics that only count time when the tab is active
- Set maximum thresholds for session durations to avoid inflated data
- Validate engagement through actual interaction events
Event Count
Event Count provides a granular measure of user interactions with your website or app, allowing you to track specific actions and behaviors beyond page views.
Why Event Count Metric is Important
Event Count is crucial for understanding how users interact with specific elements and features of your website or app.
What Event Count Metric Measures
This metric tracks the total number of times a specific event has occurred on your website or app. Events can include actions like button clicks, video plays, form submissions, and more.
How to Track Event Count
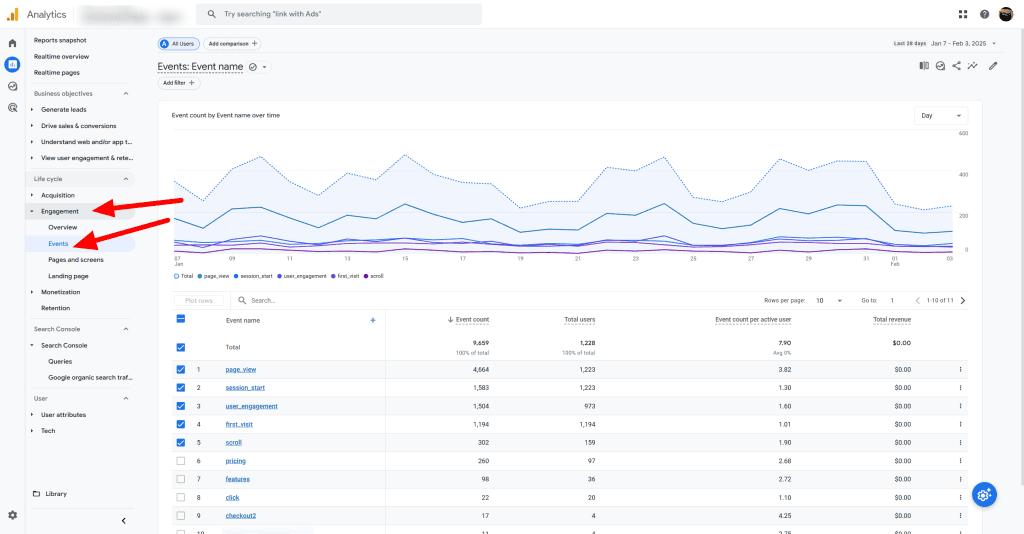
GA4 automatically tracks a variety of events through Enhanced Measurement. Set up custom events to track specific actions relevant to your clients’ goals. Find event data in the “Events” report under “Reports” > “Engagement”.
Event Count Analysis
Monitor Event Count over time to identify trends in user interactions and behavior. Compare Event Count across different pages, screens, or features to understand which elements are driving the most engagement. Analyze Event Count by user segment to understand how different audiences interact with your website or app.
Event Count Visualization
Use a line graph to visualize Event Count trends over time. Create a bar chart comparing Event Count across different events or event categories. Use a heat map to visualize the most popular events or features on your website or app.
Common Pitfalls with Event Count Metric
Event tracking in GA4 can get out of hand quickly. Here are common pitfalls that can clutter your data and how to keep things clean and actionable.
Problem: Tracking too many events leads to data noise, making analysis overwhelming.
Why It Matters: Key insights can get buried in unnecessary data, making it harder to identify patterns that matter.
Solution:
- Create an event hierarchy (Primary, Secondary, Tertiary events)
- Focus on tracking events aligned with business objectives
- Use event parameters instead of separate events for variations
- Conduct regular audits to remove unnecessary event tracking
Problem: Similar events are tracked differently across pages or features, creating inconsistent data.
Why It Matters: This inconsistency makes it difficult to aggregate and compare event data accurately.
Solution:
- Implement regular QA processes to check event tracking
- Develop a clear event naming convention
- Document event parameters and their values thoroughly
- Use Google Tag Manager variables to maintain consistency
Conversions
Conversions or Key Events are a crucial measure of the effectiveness of your marketing campaigns in driving desired user actions and achieving business objectives.
Why Conversions Metric is Important
Conversions directly tie your marketing efforts to tangible business results, making it one of the most important metrics to track.
What Conversions Metric Measures
Conversions track the number of times users complete a specific action that you have defined as valuable, such as making a purchase, submitting a form, or signing up for a newsletter.
How to Track Conversions
In GA4, set up conversion tracking by marking specific events as conversions. Track conversion data in various reports, including the “Conversions” report under “Engagement” and the “Traffic acquisition” report under “Acquisition.”
Conversion Data Analysis
Monitor conversion trends over time to identify patterns and opportunities for optimization. Analyze conversions by traffic source to understand which channels are driving the most valuable user actions. Compare conversion rates across different pages, screens, or user segments to identify high-performing areas and potential barriers to conversion.
Conversion Data Visualization
Use a line graph to visualize conversion trends over time, with annotations for major campaigns or website changes. Create a bar chart comparing conversions by traffic source or campaign. Use a funnel visualization to track user progression through key conversion steps and identify drop-off points. Or based on demographic with a map.
Common Pitfalls with Conversions Metric
Conversion tracking in GA4 can be tricky if not set up thoughtfully. Here are common pitfalls that can lead to misleading data and how to avoid them.
Problem: Only tracking final conversions without capturing intermediate steps in the user journey.
Why It Matters: This limits visibility into how users progress through the conversion funnel, missing key opportunities for optimization.
Solution:
- Implement micro-conversion tracking to capture key user interactions
- Define funnel stages with appropriate event tracking
- Track abandonment points using custom events
- Use sequence segments to analyze conversion paths effectively
Problem: Failing to track or attribute conversion values correctly, especially in complex purchase journeys or multi-step conversions.
Why It Matters: This leads to inaccurate ROI calculations and poor marketing budget decisions.
Solution:
- Set up value-based bidding strategies for advertising campaigns
- Track conversion values for all relevant conversion events
- Use custom metrics for complex value calculations, like lifetime value
- Create conversion-specific segments to refine performance analysis
Bounce Rate
Bounce Rate provides insights into the effectiveness of your website or app in capturing user interest and encouraging further exploration.
Why Bounce Rate Metric is Important
Bounce Rate helps you understand how well your content and user experience are resonating with your audience.
What Bounce Rate Metric Measures
In GA4, Bounce Rate is the percentage of sessions that are not engaged. An engaged session is one that lasts longer than 10 seconds, has a conversion event, or has two or more page views.
Bounce Rate Calculation
How to Track Bounce Rate
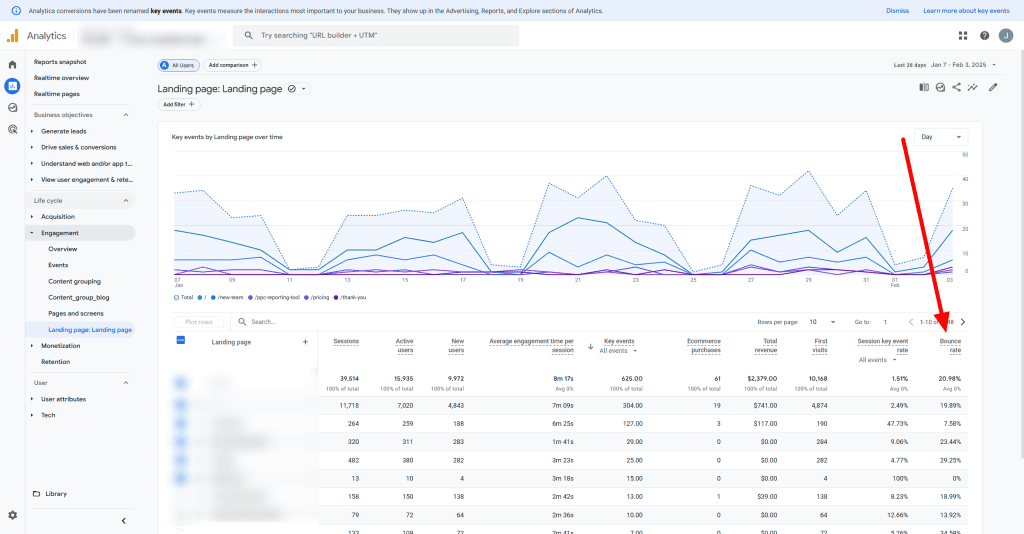
Customize the report you want to see Bounce Rate in. Find your report in the “Report” tab and click the edit icon in the upper right-hand corner of the report. Click “Metrics”, then “Add Metric”, and then choose “Bounce Rate”. Click “Apply” to save your changes.
Bounce Rate Analysis
Monitor Bounce Rate over time to identify trends and patterns in user engagement. Compare Bounce Rate across different pages, screens, or pieces of content to identify areas for improvement. Analyze Bounce Rate by traffic source or user segment to understand which audiences are least engaged.
Bounce Rate Visualization
Use a line graph to visualize Bounce Rate trends over time. Create a bar chart comparing Bounce Rate across different pages or screens. Use a scatter plot to visualize the relationship between Bounce Rate and other metrics like Conversion Rate or Average Engagement Time.
Common Pitfalls with Bounce Rate Metric
Bounce rate can be misleading if not interpreted correctly, it doesn’t account for factors like time spent on page or micro-conversions. Here are common pitfalls to avoid when analyzing bounce rates in GA4.
Problem: Failing to consider that different types of pages have varying acceptable bounce rates.
Why It Matters: This can lead to unnecessary optimization efforts or overlooking real performance issues.
Solution:
- Establish benchmark bounce rates for different page types
- Consider user intent when analyzing landing page performance
- Use engaged sessions as the primary metric for content-heavy pages
- Create custom segments to differentiate user journey types
Problem: Traditional bounce rate metrics don’t accurately reflect engagement for modern single-page applications (SPAs).
Why It Matters: This can result in artificially high bounce rates for pages that are actually performing well.
Solution:
- Focus on engagement metrics instead of bounce rate for SPAs
- Implement virtual pageviews to capture SPA navigation events
- Track meaningful interactions with custom event tracking
- Create adjusted bounce rate calculations for SPAs
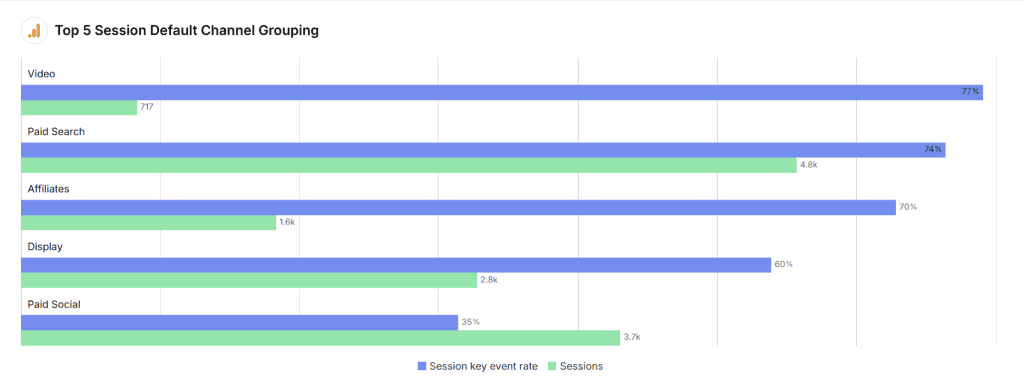
Session Conversion Rate
Session Conversion Rate or Session Key Event Rate helps measure the immediate effectiveness of your website or app in driving conversions within a single session.
Why Session Conversion Rate Metric is Important
Session Conversion Rate provides a direct measure of how well your website or app is optimized for conversions.
What Session Conversion Rate Metric Measures
It calculates the percentage of sessions that result in at least one conversion event, such as a purchase or form submission.
Session Conversion Rate Calculation
How to Track Session Conversion Rate
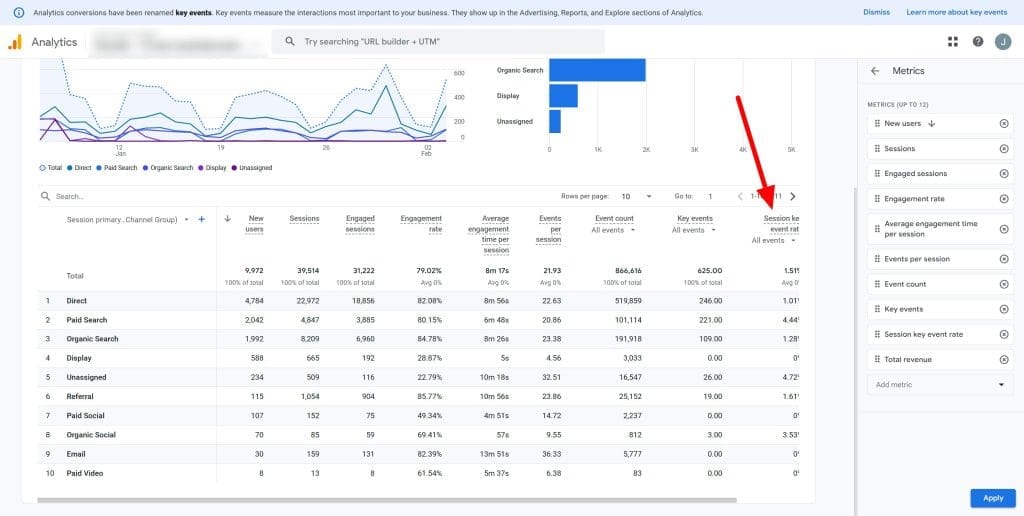
GA4 automatically calculates Session Conversion Rate. Find it in the “Traffic acquisition” report under “Reports” > “Acquisition”. Customize other reports to include this metric.
Session Conversion Rate Analysis
Monitor Session Conversion Rate over time to identify trends and patterns in conversion performance. Compare Session Conversion Rate across different traffic sources, campaigns, or user segments to identify high-performing areas and potential optimization opportunities. Analyze Session Conversion Rate by device type to understand how conversion behavior differs across desktop, mobile, and tablet users.
Session Conversion Rate Visualization
Use a line graph to visualize Session Conversion Rate trends over time, with annotations for major campaigns or website changes. Create a bar chart comparing Session Conversion Rate by traffic source or campaign. Use a scatter plot to visualize the relationship between Session Conversion Rate and other metrics like Average Engagement Time or Pages per Session.
Common Pitfalls with Session Conversion Rate Metric
Session conversion rate can be deceptive if not viewed in the right context. Here are common pitfalls to avoid when analyzing this metric in GA4.
Problem: Focusing solely on session conversion rate ignores the multi-session nature of many purchase journeys.
Why It Matters: This can lead to undervaluing key touchpoints in longer customer journeys.
Solution:
- Track and analyze multi-session conversion paths
- Implement cross-session attribution models for more accurate insights
- Create custom conversion segments based on different journey lengths
- Use path analysis to understand typical conversion timelines
Problem: Users switching devices during their journey aren’t properly tracked in session conversion rates.
Why It Matters: This leads to an incomplete view of conversion paths, affecting optimization strategies.
Solution:
- Enable cross-device tracking whenever possible
- Implement User ID tracking for logged-in users to maintain continuity
- Create device-specific conversion segments for granular analysis
- Analyze conversion patterns to identify cross-device behavior trends
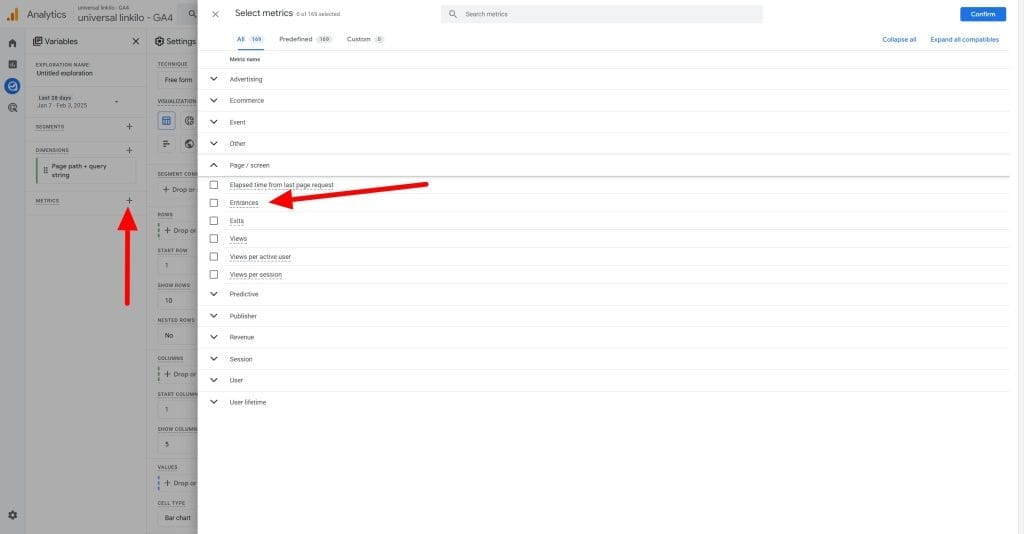
Entrances
Entrances provide insights into how users first access your website or app, helping you understand the effectiveness of different entry points and landing pages.
Why Entrances Metric is Important
Entrances help you identify the most common starting points for user journeys on your website or app.
What Entrances Metric Measures
It counts the number of times a session begins on a specific page or screen.
How to Track Entrances
Entrances are not available in standard GA4 reports. Create a custom report using “Explorations”.
Entrance Analysis
Identify your top landing pages by Entrances to understand which pages are driving the most traffic. Compare engagement and conversion metrics (e.g., Bounce Rate, Average Engagement Time, Conversion Rate) for your top landing pages to assess their effectiveness. Analyze Entrances by traffic source to understand which channels are driving the most traffic to specific pages.
Entrance Visualization
Create a bar chart showing your top landing pages by Entrances. Use a treemap to visualize the distribution of Entrances across your website or app hierarchy. Create a flow diagram to visualize user paths from Entrance pages to key conversion points.
Common Pitfalls with Entrances Metric
Entrances can be a misleading metric if not analyzed with the right context. Discrepancies between Entrances and session metrics might occur due to session timeouts or cross-domain tracking issues. Here are common pitfalls to avoid when tracking entrance data in GA4.
Problem: Raw entrance data doesn’t consider user intent or the quality of the traffic source.
Why It Matters: High entrance numbers can hide poor-quality traffic or misaligned user expectations, leading to false assumptions about performance.
Solution:
- Segment entrances based on traffic sources to identify quality channels
- Track initial engagement metrics to evaluate the effectiveness of each entry point
- Create custom scoring models to measure entrance quality beyond just volume
- Analyze bounce rates in conjunction with entrance data to detect low-engagement traffic
Problem: Single Page Applications (SPAs) don’t trigger traditional pageview events, causing entrance tracking issues.
Why It Matters: This leads to incomplete or inaccurate entrance data, which affects user flow analysis for modern web applications.
Solution:
- Implement virtual pageview tracking to simulate traditional entrance events
- Create custom entrance events tailored to SPA route changes
- Use history change listeners to capture navigation within SPAs accurately
- Configure GA4 properly for SPA environments to maintain data integrity
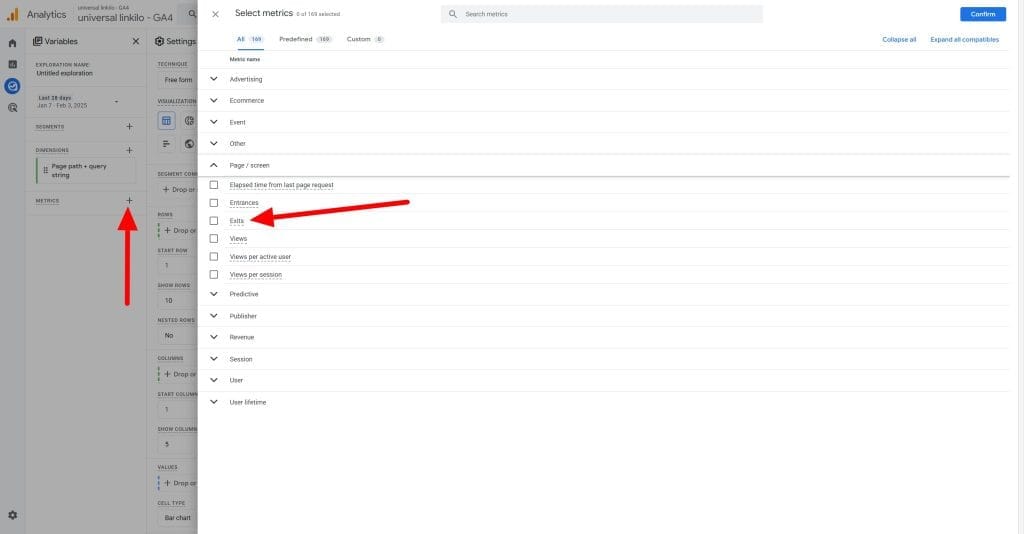
Exits
Exits help identify the pages or screens where users leave your website or app, providing valuable insights into potential areas for improvement in user experience and content engagement.
Why Exits Metric is Important
Exits provide insights into where users are dropping off in their journey, helping you identify potential issues or areas for improvement.
What Exits Metric Measures
It shows how many times visitors left your site on a certain page or screen.
How to Track Exits
Similar to Entrances, Exits are not available in standard GA4 reports. Create a custom report using “Explorations”.
Exit Analysis
Identify your top exit pages to understand where users are dropping off in their journey. Compare exit rates across different pages or screens to identify potential problem areas or points of friction. Analyze exit rates by traffic source or user segment to understand if certain audiences are more likely to drop off at specific points.
Exit Visualization
Create a bar chart showing your top exit pages by Exit Rate. Use a treemap to visualize the distribution of Exits across your website or app hierarchy. Create a flow diagram to visualize user paths from key pages to Exit points.
Common Pitfalls with Exits Metric
Differentiate between Exits and Bounce Rate. While all bounces are exits, not all exits are bounces.
Problem: Standard exit tracking doesn’t reveal why users are leaving your site.
Why It Matters: Without understanding exit intent, it’s difficult to optimize effectively for user retention and engagement.
Solution:
- Implement exit-intent surveys to capture user feedback before they leave
- Track the last user actions to understand behaviors leading to exits
- Conduct exit path analysis to identify common exit journeys
- Set up custom exit categorization to differentiate exit types
Problem: Technical issues like timeouts or errors are often recorded as regular exits, skewing the data.
Why It Matters: This can mask user experience issues that need attention, leading to missed optimization opportunities.
Solution:
- Track error events separately to distinguish technical issues from user-initiated exits
- Implement technical exit categorization to identify exits caused by errors
- Create custom segments to analyze different types of exits
- Set up alerts to detect abnormal exit patterns that may indicate technical problems
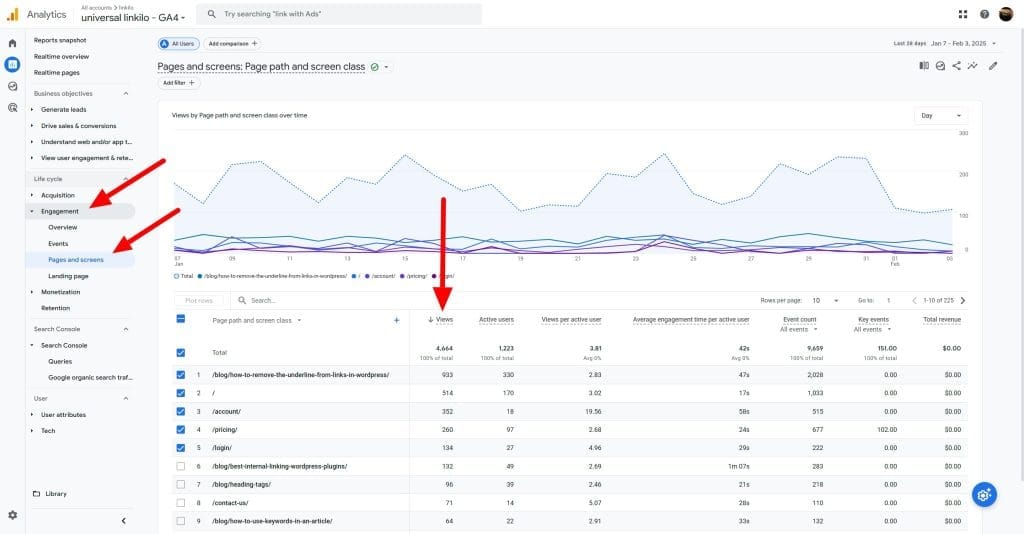
Views (formerly known as Pageviews)
Views provide a fundamental measure of user engagement with your website or app content. They help track the overall traffic and popularity of different pages or screens.
Why Views Metric is Important
Views help you understand which pages or screens are getting the most attention from users, providing insights into content popularity and user engagement.
What Views Metric Measures
Views represent the total number of times a page or screen has been viewed by users. In GA4, this metric combines both page views (for websites) and screen views (for apps).
How to Track Views
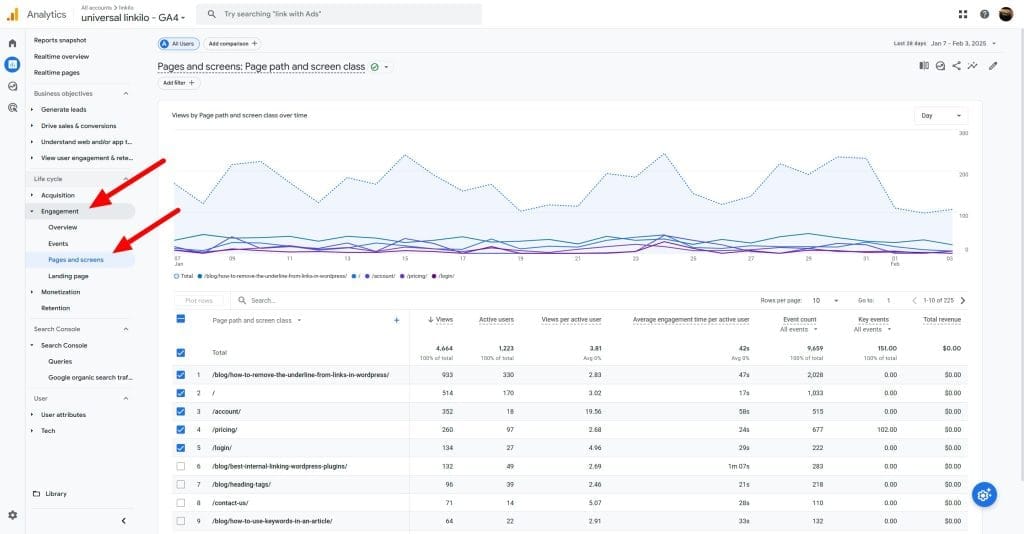
GA4 automatically tracks views. Find this data in various reports, including the “Pages and screens” report under “Reports” > “Engagement”.
View Analysis
Identify your most popular pages or screens by Views to understand which content is driving the most engagement. Monitor Views over time to identify trends and patterns in content popularity and user engagement. Compare Views across different sections or categories of your website or app to understand which areas are most engaging to users.
View Visualization
Create a bar chart showing your top pages or screens by Views. Use a line graph to visualize Views trends over time, with annotations for major content updates or promotional campaigns. Use a treemap to visualize the distribution of Views across your website or app hierarchy.
Common Pitfalls with Views Metric
Pageview metrics can be deceptive if taken at face value. A high number of views doesn’t necessarily equate to high engagement if users are quickly bouncing off the page or not interacting with the content. Here are common pitfalls to avoid when analyzing views in GA4.
Problem: High view counts are often mistaken for content success without considering user engagement.
Why It Matters: This can shift focus towards content volume instead of value, leading to ineffective content strategies.
Solution:
- Create engagement-weighted view metrics to prioritize quality
- Track time-on-content alongside views to measure depth of interest
- Implement content quality scoring based on interaction data
- Analyze view-to-conversion ratios to evaluate content performance
Problem: Bot traffic and automated systems can inflate view counts, distorting performance data.
Why It Matters: This skews your understanding of user behavior, leading to poor content strategy decisions.
Solution:
- Implement bot filtering to exclude non-human traffic
- Create velocity checks to detect suspicious activity patterns
- Set up custom alerts for unusual spikes in view counts
- Use interaction metrics to confirm authentic user engagement
Views per User
Views per User provides insights into the depth of user engagement with your website or app content. It helps assess how effectively your content encourages users to explore different pages or screens.
Why Views per User Metric is Important
Views per User helps you understand how deeply users are engaging with your content and how effectively your site or app encourages exploration.
What Views per User Metric Measures
This metric calculates the average number of screens or pages viewed by each user during their session.
How to Track Views per User
GA4 automatically calculates Views per User. Find this data in the “Pages and screens” report under “Reports” > “Engagement”.
Views per User Analysis
Monitor Views per User over time to identify trends in user engagement and content exploration. Compare Views per User across different user segments or cohorts to understand how engagement depth varies by audience. Analyze Views per User by traffic source to understand which channels drive the most engaged users.
Views per User Visualization
Use a line graph to visualize Views per User trends over time. Create a bar chart comparing Views per User across different user segments or cohorts. Use a scatter plot or a simple table to visualize the relationship between Views per User and other metrics like Session Duration or Conversion Rate.
Common Pitfalls with Views per User Metric
Views per user is a valuable metric, but it can easily mislead if not analyzed correctly. Interpret Views per User in conjunction with other engagement metrics. Here are common pitfalls to avoid when working with this metric in GA4.
Problem: Average views per user can mask key behavioral segments, hiding opportunities for optimization.
Why It Matters: This leads to missed chances to optimize content and experiences for high-value user segments.
Solution:
- Create user segments based on distinct view patterns
- Analyze view distribution across different user types
- Implement cohort analysis to track trends in view behavior
- Track sequential view behaviors to identify patterns over time
Problem: Users viewing content across multiple devices may be counted as separate users, skewing views per user data.
Why It Matters: This leads to an underestimation of views per user and a fragmented understanding of the user journey.
Solution:
- Enable cross-device tracking to unify user sessions
- Implement User ID tracking to identify logged-in users consistently
- Create device-agnostic metrics for a holistic view of user behavior
- Analyze behavior patterns specifically for logged-in users
How to Make GA4 Fit Your Client’s Needs
Every client is different, and while the metrics we’ve discussed are important, you’ll need to tailor GA4 to match what matters most to each client. The real power of GA4 lies in its flexibility – you can create custom metrics and events that align perfectly with your clients’ specific goals.
The Difference Between KPIs and Metrics
Let’s talk about something that often gets confused: KPIs versus metrics. Think of metrics as all the data points you can track – bounce rates, page views, time on site, and so on. They’re like ingredients in your kitchen. KPIs, on the other hand, are the specific measurements that tell you if you’re achieving your client’s business goals – they’re the actual meal you’re trying to prepare.
For example, a client might track dozens of metrics, but their true KPIs might be qualified lead generation rate and customer acquisition cost. When setting up GA4, start by identifying these crucial KPIs, then build your tracking and reporting around them. This helps cut through the noise and focus on what truly drives your client’s business forward.
Choosing the Right Way to Show Your Data
Data visualization isn’t just about making things look pretty – it’s about making complex data instantly understandable. Here’s a simple guide I use:
Want to show changes over time? A line chart is your friend. Need to compare different categories? Go for a bar chart. Showing parts of a whole? That’s where pie charts shine (though use them sparingly!). When using Swydo with GA4, you can choose visualizations that make the most sense for your specific metrics.
The key is to match your visualization to your audience. Executive summaries might need simple, high-level charts, while marketing teams might want detailed breakdowns. Let your client’s needs guide your choice of visualization.
Making Client Reporting Actually Valuable
Here’s something I’ve learned the hard way: a report is only as good as the actions it inspires. When creating reports in Swydo using your GA4 data, think like a storyteller. Don’t just dump numbers – walk your clients through what the data means for their business.
Start with the big picture – how are we tracking against main business goals? Then dive into the why – what’s driving these results? Finally, always include clear, actionable recommendations. For instance, instead of just reporting a drop in mobile conversion rates, explain what might be causing it and what specific steps could fix it.
Tools like Swydo make this easier by automating the data gathering and visualization, giving you more time to focus on analysis and recommendations. You can set up custom dashboards that show both real-time metrics and long-term KPI tracking, giving your clients both immediate insights and trend analysis.
Want to take this to the next level? Schedule regular review sessions with your clients to discuss the reports. This turns your reporting from a one-way data dump into a strategic conversation about their business growth. After all, the best insights come from combining your analytical expertise with your client’s business knowledge.
Read more about client reporting best practices to enhance your client reporting with GA4.
Best Practices and Actionable Tips for Using GA4 Metrics
make the most of GA4’s powerful metrics and features to drive meaningful results for your clients and establish yourself as a trusted, data-driven partner with these best practices
Define Clear Goals and KPIs
Work with your clients to identify their top 3-5 business objectives. Translate these objectives into measurable GA4 metrics. For example, if your client wants to increase sales, you might focus on metrics like conversion rate and average order value. Don’t just ask clients what they think they want.
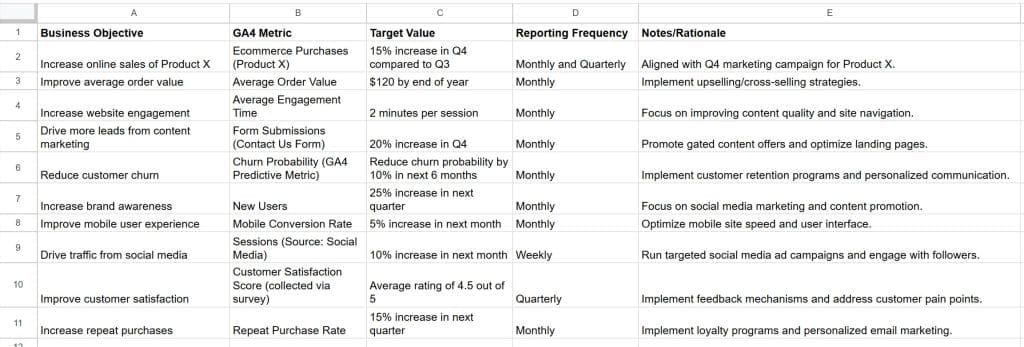
Dig deeper. “More sales” is vague. “Increase online sales of product X by 15% in Q4” is measurable. Tie KPIs to specific GA4 metrics. Set specific targets for each metric based on historical data and industry benchmarks. This will give you a clear framework for measuring success and identifying areas for improvement. Create a KPI worksheet with columns for Business Objective, GA4 Metric, Target Value, and Reporting Frequency. Share this with the client for alignment.
You can create this KPI worksheet in a spreadsheet program (like Google Sheets, Excel, or Numbers) or even as a simple table in a document. Here’s a suggested structure and example content:
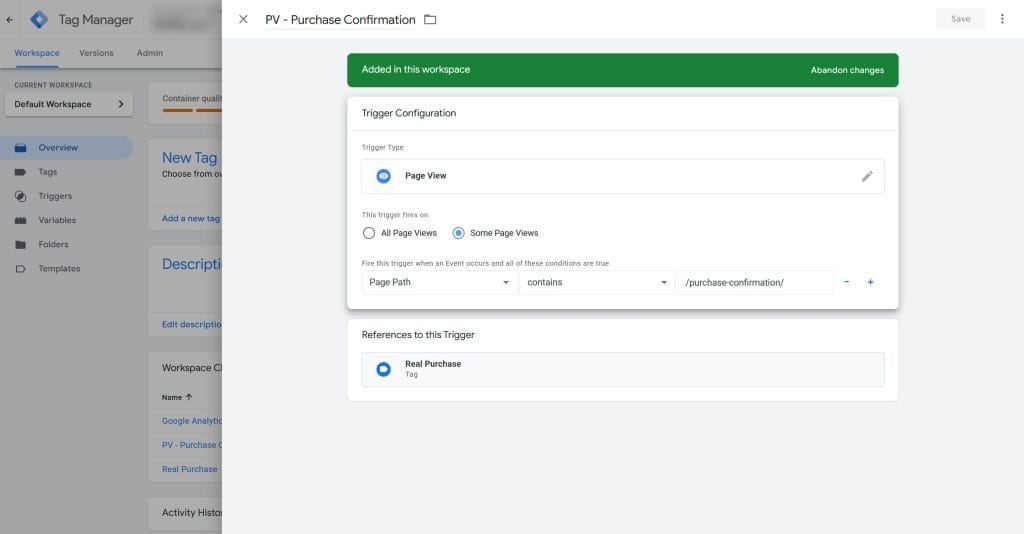
Keep Event Tracking Up-To-Date
Create a master list of all the key interactions and user behaviors you want to track. This might include things like button clicks, form submissions, or video views. Use GA4’s Enhanced Measurement features to automatically track common events like page views, scrolls, and clicks.
For more client-specific actions, implement custom event tracking using GA4’s event builder or Google Tag Manager. Enhanced Measurement is great, but it doesn’t catch everything. Prioritize custom events for key actions like form submissions, video starts/completes, file downloads, and add-to-carts.
It’s important to review your event tracking setup every quarter or so to ensure it still aligns with your clients’ goals and priorities. Use Google Tag Manager (GTM) for greater control and easier management of custom events. Audit your GTM container to make sure that your tags are firing correctly.
Segment Your Data for Deeper Insights
GA4’s segmentation tools are incredibly powerful. Use default dimensions like device category, source/medium, and country to create basic segments. Then, create custom segments based on user behavior.
For example, you might create a segment for users who watched a product video or users who abandoned their cart. Compare metrics across these segments to identify high-performing and underperforming user groups. These insights can inform your targeting and personalization strategies to drive better results. Segmentation is where the magic happens.
Go beyond basic demographics. Create segments based on user behavior (e.g., “users who added to cart but didn’t purchase”), traffic source (e.g., “users from the Google Ads campaign”), and engagement (e.g., “users who viewed 3+ pages”). Create a segment library in GA4. Document the logic behind each segment so your team can use them consistently.
Take Advantage of GA4’s Predictive Capabilities
GA4 introduces powerful predictive metrics that leverage machine learning to anticipate future user actions and outcomes, giving you a significant edge in optimizing your marketing efforts. These predictive capabilities are game-changers for proactive marketing.
How GA4 Uses Machine Learning to Help Marketers
GA4’s machine learning models power these key predictive metrics:
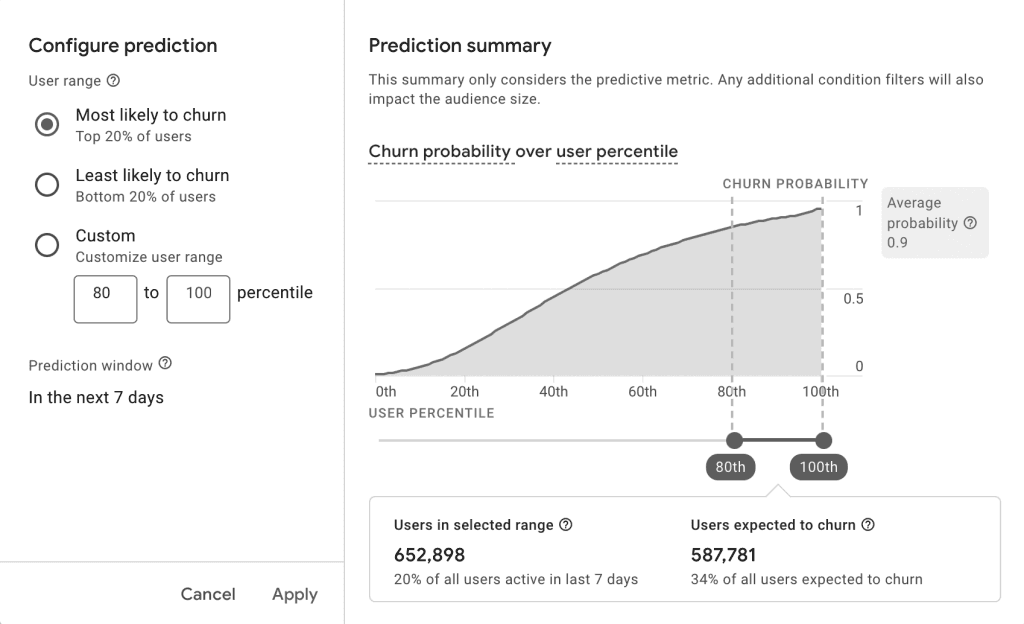
- Purchase Probability: This metric predicts the likelihood that a user will make a purchase within the next 7 days. This allows you to proactively target high-value users with personalized offers and experiences, maximizing your ROI.
- Churn Probability: GA4 can predict the probability that a user will not return to your client’s website or app within the next 7 days. This enables you to identify at-risk users and implement targeted retention strategies before they churn.
Actionable Steps:
Ongoing Optimization: Monitor the predictive metrics over time to assess the impact of your optimizations and continually refine your approach. As GA4 gathers more data, the accuracy of these predictions will improve, allowing you to further personalize and optimize your campaigns.
Enable Predictive Metrics: Verify that these predictive metrics are enabled in your GA4 property settings. (You might add a screenshot here of where to find this in the GA4 interface).
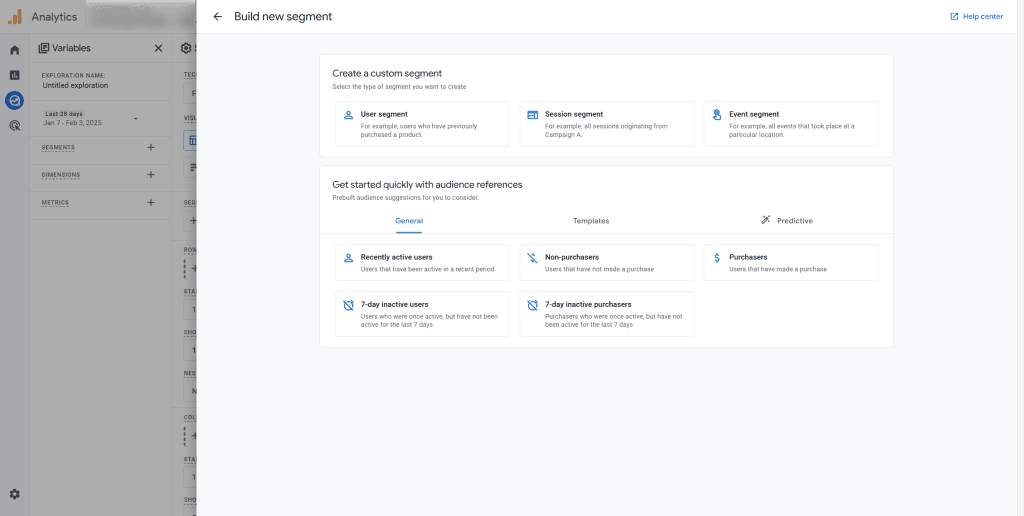
Create Targeted Audiences: Build audience segments based on these predictive metrics. For instance, create an audience of users with a “high purchase probability” or a “high churn probability.”
Personalized Campaigns: Use these predictive audiences for targeted remarketing campaigns or personalized on-site experiences. For example, offer special discounts to high-purchase probability users or personalized content to at-risk users.
Integrate Quantitative and Qualitative Data
While GA4 provides a wealth of quantitative data, it’s important to also consider qualitative insights. Use GA4 to identify high-traffic pages or key drop-off points in the user journey. Then, set up on-site surveys or feedback widgets on these pages to gather qualitative insights from users.
Analyze the open-ended survey responses to identify common themes or pain points. These qualitative insights can provide valuable context for your quantitative GA4 data and inform UX optimizations that drive real improvements.
GA4 tells you what is happening. Qualitative data (surveys, user testing) tells you why. Combine them for a complete picture. Use heatmaps and session recordings (like Hotjar, Clarity, Full Story or Crazy Egg) to visualize user behavior on key pages. Combine this with survey data about user experience.
Prioritize Actionable Insights
It’s easy to get lost in the sea of data that GA4 provides. To avoid analysis paralysis, focus on actionable insights. For each GA4 report or dashboard, identify 2-3 key takeaways or areas for improvement. Translate these insights into specific, actionable recommendations.
For example, you might recommend reducing mobile load time by implementing lazy loading to improve mobile conversion rate. Assign ownership and deadlines for each action item for accountability. Then, track the impact of your recommendations on key GA4 metrics over time. Data is useless without action. Focus on the “so what?”
For every insight, ask “What can we do with this?” Create a monthly “GA4 Insights & Actions” report for your clients. Include 2-3 key insights, the recommended actions, who is responsible, and the deadline.
Present Insights Effectively
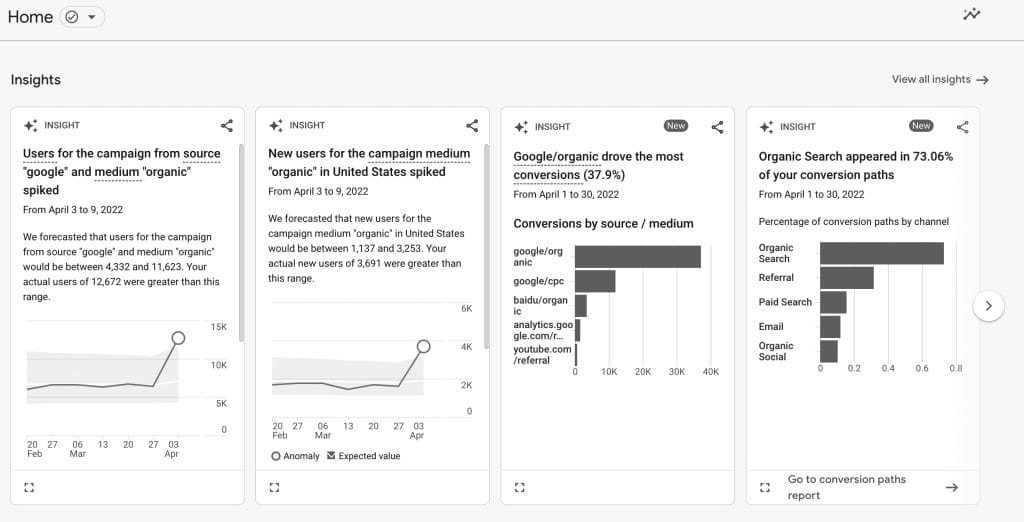
The way you present your GA4 insights is just as important as the insights themselves. Use GA4’s Data Studio integration to create custom, visually engaging reports and dashboards. Highlight key metrics, trends, and anomalies using charts, tables, and annotations.
Provide brief, text-based summaries to explain the significance of each insight and its impact on the business. Where appropriate, use storytelling techniques like data visualization and case studies to make your insights more memorable and persuasive.
The goal is to make the data accessible and actionable for your clients. Clients don’t want data dumps. They want clear, concise stories. Use visualizations and plain language. Use Swydo or Looker Studio to create visually appealing dashboards. Focus on the key metrics and tell a story with the data.
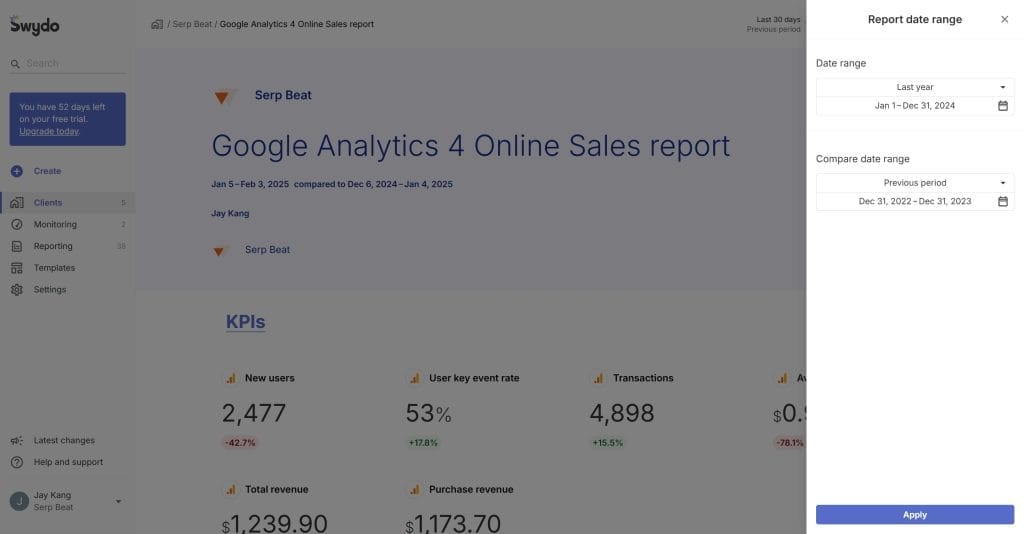
Track and Compare Performance Over Time
GA4 makes it easy to track performance over time. Set up custom comparisons to track key metrics across different time periods, like week-over-week or month-over-month. Use GA4’s date range comparison feature to analyze the impact of specific marketing campaigns or website changes.
Create custom reports or dashboards to monitor key metrics and comparisons over time. Schedule regular reviews of this performance data with your clients to identify trends, successes, and areas for improvement. This ongoing monitoring is key to optimization.
Show clients how their metrics are improving (or not) over time. Use comparisons to highlight the impact of your work. Create a year-over-year comparison report showing the growth in key metrics like conversions, revenue, and engagement.
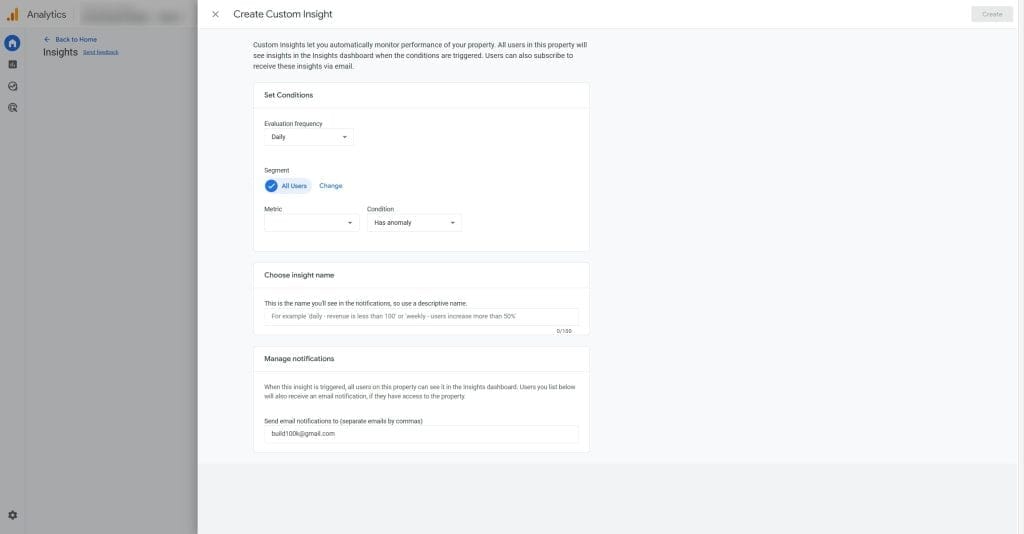
Create Custom Insight Alerts
Custom alerts can help you stay on top of important changes in your GA4 data. Identify critical thresholds or anomalies for your clients’ key metrics. For example, you might set an alert for a 20% drop in conversion rate or a 50% increase in bounce rate. Set up these custom insight alerts in GA4 to notify you when these thresholds are met or anomalies are detected.
Create an action plan for how to investigate and respond to each type of alert. This might include checking for tracking issues or identifying the root cause of the anomaly. Use alerts to proactively identify and resolve issues before they have a significant impact on your clients’ business.
Don’t wait for clients to tell you something is wrong. Set up alerts to be proactive. Set up custom alerts in GA4 for significant drops in conversions or increases in bounce rate. Configure the alerts to notify you by email or SMS.
How to Overcome Data Discrepancies and Tracking Issues
One common challenge marketing agencies face when working with GA4 is dealing with data discrepancies and tracking issues. Here are some tips for troubleshooting and resolving these problems:
Data Discrepancies
Data discrepancies can occur when the numbers in GA4 don’t match those from other tools or platforms. This can happen due to differences in tracking methodologies, data processing, or attribution models.
To resolve data discrepancies:
- Audit your GA4 setup to make sure tracking codes are properly implemented and firing correctly.
- Check your data filters and exclusions to make sure you’re not inadvertently excluding or altering data.
- Compare your GA4 data with data from other reliable sources, such as server logs or sales records, to identify any inconsistencies.
- Investigate the differences in data definitions and attribution models between GA4 and other platforms.
- Document and communicate any known discrepancies to your clients, along with an explanation of the underlying causes and potential impact on reporting.
Tracking Issues
Tracking issues can arise when GA4 fails to capture certain user interactions or events correctly. This can lead to incomplete or inaccurate data, making it difficult to make informed decisions.
To resolve tracking issues:
- Audit your GA4 event tracking and verify that all relevant interactions are being captured.
- Use GA4’s DebugView to test and validate event tracking in real-time.
- Implement server-side tracking using the GA4 Measurement Protocol to capture events that may be missed by client-side tracking (e.g., ad blockers, browser restrictions).
- Work with your web development team to prevent site changes or updates from breaking existing tracking code.
- Use the GA4’s data import feature to fill in any data gaps from other sources, such as CRM or offline sales data.
Address data discrepancies and tracking issues proactively to make sure your GA4 data is accurate and reliable, enabling you to make better decisions and drive more value for your clients.
Conclusion
In short, GA4 success requires a commitment to data-driven marketing. Let the data guide your decisions and dedicate yourself to ongoing improvement.
For agencies that embrace this approach, the rewards can be significant. Deliver tangible, measurable results to differentiate yourself in a crowded market, build stronger client relationships, and drive growth for your own business.
So if you take one thing away from this guide, let it be this: GA4 is a tool, but it’s up to you to use it effectively. Invest in learning GA4, integrate it into your processes, and use it to drive real, meaningful improvements for your clients. That’s the key to success in the new era of analytics.
Step up your agency’s game with GA4 insights and deliver clear results for your clients.
Start Your Free Trial