
A Facebook Page reaches roughly 1% to 2% of its followers with an average organic post, and no posting trick changes that arithmetic. What changes it is publishing video as Reels, writing posts people save and share, and measuring reach on the windows Meta reports exactly.
The pitch for Facebook organic hasn’t changed much since 2016. You post five times a week for a client, reach falls anyway, and the quarterly review turns into an argument about whether social deserves the retainer. The reach problem is real. It’s also mostly a distribution problem sitting on top of a measurement problem, and you can fix both inside a single 28-day window.
This guide walks the process end to end, from setting a baseline you can defend to proving the change moved a number a client cares about.
What Is Facebook Reach?
Facebook reach is the number of unique accounts that saw a post at least once. Impressions count every time that post was displayed, so one person who scrolls past the same post twice produces one reach and two impressions.
Reach splits three ways, and the split is where agency reports usually go wrong:
- Organic reach. People who saw the post without any ad spend behind it.
- Paid reach. People who saw it because you paid.
- Viral reach. People who saw it because someone they know interacted with it.
A single number labeled “Reach” on a client dashboard hides all of that. It lets a $40 boost look like content strategy. If you only fix one thing in your Facebook reporting this quarter, fix this: split organic from paid before you report either. The same discipline applies to Facebook organic metrics generally, and it’s the reason dashboards vs reports is a distinction worth being pedantic about with clients.
One more thing that trips up year-over-year comparisons. Meta removed a long list of Page metrics in March 2024 when Classic Pages moved to New Pages, including Engaged Users, Unique Page Likes, Positive Feedback, and both logged-in and logged-out Page Views. Any reach trendline that crosses that date is comparing two different measurement systems. Rebuild those fields as custom metrics rather than explaining the gap to a client in a meeting.
How the Facebook Algorithm Decides What to Show
Facebook ranks every candidate post through four steps: inventory, signals, predictions, and a relevance score. Meta describes the process publicly, and the short version is that ranking is a prediction problem, not a popularity contest.
Inventory is everything that could appear in a given person’s Feed right now. Posts from friends, Pages they follow, Groups they’ve joined, and an increasingly large pile of recommended content from accounts they’ve never interacted with.
Signals are what Meta knows about each candidate. Who posted it, how old it is, what format it’s in, how quickly people engaged with it, whether the viewer has interacted with that account before, whether they’re on wifi, how many times they’ve hidden similar posts. Meta’s own documentation describes hundreds of thousands of these, which is worth keeping in mind whenever a claim of a fully reverse-engineered algorithm comes across your desk.
Predictions turn signals into probabilities. How likely is this person to comment? To watch the whole video? To hide the post? To report it?
Relevance score is the single number those predictions collapse into. Highest score wins the slot.
Two things follow from that structure. First, the algorithm optimizes for predicted meaningful interaction, which is why a post that earns twelve real comments outperforms a post that earns four hundred likes. Second, negative predictions carry weight. A post Meta expects people to hide gets suppressed before a single person hides it.
So the lever isn’t volume. It’s the probability that a specific person does something deliberate with the post.
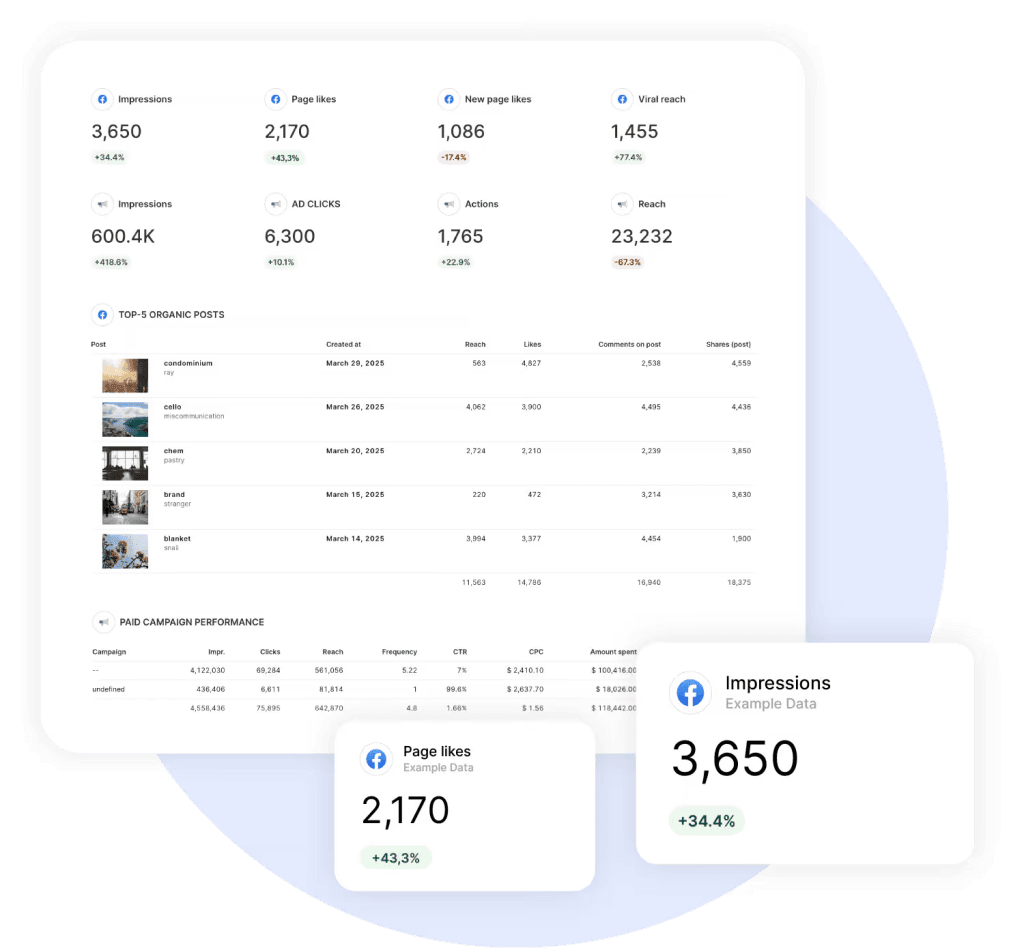
Why Facebook Reach Matters to Your Agency
Reach is the first number most clients look at, which makes it the number that decides how the rest of the review goes. It’s a weak business metric and a strong political one. Both are true at once, and the second one is what decides renewals.
- Renewals. A reach line that trends down for two quarters becomes “what are we paying you for,” regardless of what conversions did. Reach is a client retention metric long before it’s a marketing one.
- Budget defense. A Page that can’t reach organically forces paid spend. Clients would rather hear that in month two than month ten.
- Early warning. A sharp reach drop is usually the first visible symptom of a Page-level problem, not a content problem.
- Margin. Agencies respond to falling reach by posting more. More posts cost hours, and the hours come out of agency profitability.
The benchmark that matters: Socialinsider’s analysis of tens of millions of posts puts the average Facebook engagement rate at about 0.15% and the average reach rate near 1.65%. Small Pages beat that. Large Pages don’t. If a client with 80,000 followers is reaching 900 people a post, they are not broken. They are average.
What average actually looks like on a Facebook Page
Before you tell a client their Page is underperforming, check it against the number the rest of the platform is posting.
| Metric | Platform average | Read it as | What it tells you |
|---|---|---|---|
| Organic reach rate | 1.2% to 1.65% | Below 1% needs a look | Share of followers who saw an average organic post. Small Pages beat this. Pages above 50k followers rarely do. |
| Engagement rate | 0.15% | Flat year on year | Engagement per post against followers. Roughly unchanged, which means a falling reach line is rarely an engagement problem. |
| Reels engagement | 0.15% | Only format still rising | Every other format is flat or down. This is the whole argument for shooting vertical. |
| Follower count | Not predictive | Weak denominator | A large share of the Feed comes from accounts the viewer doesn’t follow. Followers cap almost nothing. |
Reach and engagement averages: Socialinsider Facebook benchmarks, drawn from an analysis of tens of millions of posts across more than 130,000 Pages. Reach-rate range reflects two different sampling windows in the same study.
The 28-Day Reach Cycle
The 28-Day Reach Cycle is a four-stage loop: baseline, test, confirm, standardize. It runs on 28 days rather than a calendar month for a reason that has nothing to do with tidiness, which we’ll get to in step two.
- Baseline. Record the client’s own reach and engagement rate over the trailing 28 days. Not the industry average. Their number.
- Test. Change exactly one variable. Format, posting window, or content type. One.
- Confirm. Compare the next 28-day window against the baseline on the same metric.
- Standardize. Roll the winner into a goal and an alert so it holds without anyone watching.
Stage two is where most cycles stall. Three variables change at once, reach moves, and the result has no traceable cause. The cycle is boring on purpose, and that’s what makes it repeatable.
The 28-Day Reach Cycle
One variable per cycle. Twenty-eight days, because that’s a window Meta reports exactly.
1. Baseline
Their own 28-day reach and engagement rate. Not the industry average.
2. Test
Change exactly one variable. Format, posting hour, or content type.
3. Confirm
Measure the next 28 days against the baseline on the same metric.
4. Standardize
The winner becomes a goal and an alert, then the next cycle starts.
Twenty-eight days isn’t a rounding of “one month.” Meta’s API returns exact Reach for 1-day, 7-day, and 28-day ranges only. Everything else is an estimate you’ll end up defending.
Why This Gets Harder With Every Client You Add
The reach work above is the same whether you run it for 5 clients or 50. The overhead around it is not. That overhead is the real reason agencies switch reporting tools, and it’s worth naming before the walkthrough.
Run this in a free tool like Looker Studio and every morning looks the same. Open one client’s dashboard, read the numbers, check nothing’s disconnected, close it, open the next. Find the file. Remember which tab held the reach view. Notice the Facebook connection expired sometime yesterday, but only because the chart went blank. Do it again for the next client, and the next. The reporting is free. The half hour before every send, times forty clients, is not.
Swydo collapses that morning into one screen, and the four pieces that do it are the daily habit agencies actually run: Metrics Overview to read every client’s numbers side by side, Goals to hold each client to a target, Alerts to get told when one drifts, and Data Health Check to catch a broken connection before it reaches a client’s inbox. Call it the Morning-Check-at-Scale loop. It’s the same four moves whether the portfolio is 5 clients or 50, and it’s the difference agencies feel on day one.
That’s the honest case for paying for a reporting tool instead of using a free one. Not prettier charts. The half hour you get back before every report goes out.
The morning check, one client vs a full book
The reach work is identical at any size. The routine around it is what scales badly, and it’s the half hour agencies are actually paying to get back.
| Daily task | Manual, per client | Swydo, whole book |
|---|---|---|
| Read the numbers | Open each client’s dashboard one at a time | Every client side by side in Metrics Overview |
| Check against target | Remember the goal, eyeball the gap | On Track or Off Track shown per client in Goals |
| Catch a drop early | Notice it whenever you next open that client | Alerts email you the day it drifts |
| Spot a broken connection | Find out when a chart goes blank | Data Health Check flags it before you send |
| Time before every send, 40 clients | Roughly half a morning | One screen, once |
Same four checks whether the book is 5 clients or 50. The manual column grows with every client you win. The Swydo column doesn’t.
What You’ll Need
Three things, and only one of them costs money.
- The client’s Facebook Page and Meta Business Suite access, with admin rights. Analyst access won’t return everything you need.
- A content calendar and someone who can shoot vertical video. A phone is fine. A social media approval process that doesn’t take nine days is not optional.
- A reporting layer that pulls Facebook Insights and Facebook Ads into the same place. Plenty of Facebook reporting tools do one or the other. Swydo connects both, along with 30-plus other sources. The flat rate includes 10 data sources and unlimited seats, and the 14-day trial doesn’t ask for a card, which is enough to run one full cycle on two or three clients before you decide anything.
How to Increase Reach on Facebook for Marketing Agencies
Facebook Page Reach Check
Find out whether a client’s reach is actually a problem or just average
Organic only. Use a 28-day range, the window Meta reports exactly.
Shares carry distribution. This is the number worth watching.
Reach Rate
Analyzing
Enter your numbers to compare this Page against the platform average.
Reach Rate
–
Average: 1.2% to 1.65%
–
Engagement Rate
–
Average: 0.15%
–
Share Rate
No published average
How these are calculated
Reach rate:
Engagement rate:
Share rate:
Platform averages come from Socialinsider’s Facebook benchmarks, an analysis of tens of millions of posts across more than 130,000 Pages. Reach rate falls as follower count grows, so read the verdict with Page size in mind. Engagement rate here counts reactions, comments, and shares against followers, which is one of several definitions in use, so compare like with like before quoting it to a client.
What to do about it
1. Set an Honest Baseline for Every Client
You can’t claim a lift without a before number, and the before number has to come from the client’s own Page. Industry averages make for good slides and bad decisions.
Open Monitoring → Metrics Overview → +New view. Select the clients you want in one screen, then add up to six metrics: Reach, Post Reach, and Post Engagement Rate are the three that matter here. Views are unlimited, so build one for social and keep it separate from the paid view.
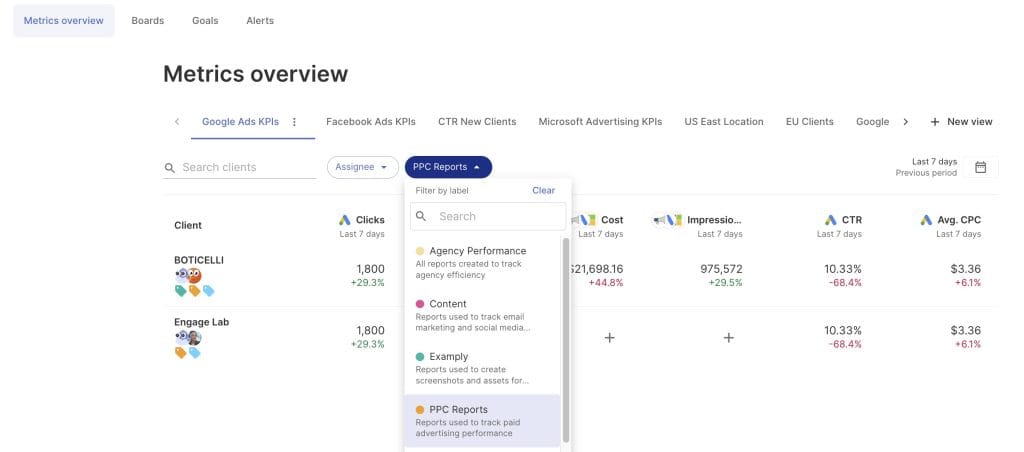
Sidenote. Benchmark each client against their own trailing 90 days before you benchmark them against anything else. A seasonal client will look broken in January and heroic in June, and neither is true.
2. Lock Your Reach Windows to 1, 7, or 28 Days
Meta’s API returns exact Reach for three date ranges only: 1 day, 7 days, and 28 days. Ask for anything else and you get an estimate. Swydo estimates it too, because there is nothing else to return.
So don’t fight it. Set your reporting range to 28 days and the number you show a client is the number Meta actually has. When a client insists on calendar months, log the exact 28-day figure as a Manual KPI alongside the monthly view, and label it plainly. It takes two minutes and it means you never have to explain why your reach number and their Business Suite number disagree.
The constraint is doing you a favor. A 28-day window is long enough to survive a bad Tuesday and short enough to still be a test.
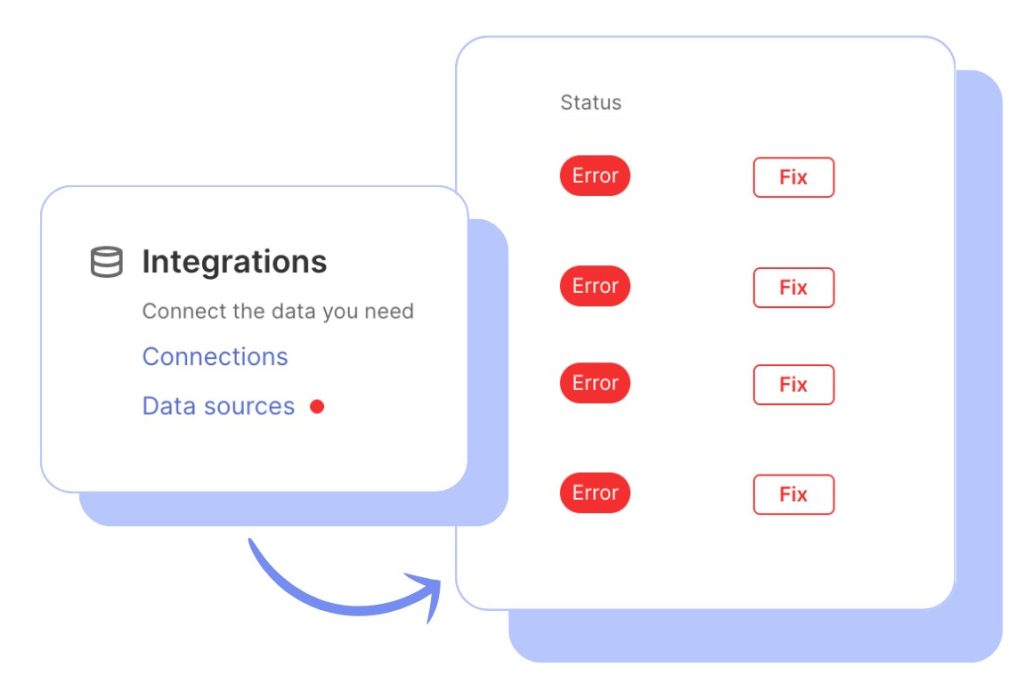
One number in that window can be wrong for a reason that has nothing to do with reach. An expired Facebook token drops the connection, the chart goes quiet, and in most tools you find out when a client asks why their report is half empty.
Data Health Check watches every connection for you and drops a red dot under Settings → Connections the moment a token expires or a permission breaks, then emails the connection owner a link straight to the fix. You see the break before the client does, which is the whole point. Checking it is the last thing to do before any report goes out.
3. Publish Every Video as a Reel
New video uploaded to a Facebook Page publishes as a Reel. That’s not a strategy choice you get to make anymore, so make the format work for you instead of against you.
Shoot vertical at 9:16. Land the hook in the first two seconds, before the thumb decides. Upload natively and never post a file with a TikTok watermark on it, because Meta demotes reposted content that carries another platform’s branding. Meta’s October 2025 recommendation update pushes more same-day creator Reels into feeds, which means a Reel posted and forgotten performs worse than a Reel posted and replied to within the hour.
Worth saying plainly. Boosting a 16:9 video from a 2021 brand shoot spends a client’s money on a format Meta stopped distributing. Reshoot it vertical and the same budget goes further.
Video reach also behaves differently enough from static reach that it deserves its own row in the report. The same is true across platforms, which is why Instagram organic metrics and Facebook’s shouldn’t share a widget.
4. Write for Saves and Shares, Not Likes
Saves and shares are the strongest signals a post can earn. A like is close to worthless as a distribution signal, because a like costs nothing and predicts nothing.
The practical difference shows up in the first line of the post. “Book your summer HVAC service before the rush” earns likes from people who already booked. “The five noises that mean your AC dies in August, and the one that means it’s fine” earns saves from people who will book in six weeks.
Write posts a person would want to find again. Then check whether they did. Shares and saves belong in your social media reporting next to reach, because they explain the reach number instead of just reporting it, and they’re closer to the marketing KPIs clients care about than raw impressions ever get.
5. Keep the Page Off the Demotion List
Meta demotes engagement bait, and it demotes Pages that do it repeatedly, not just the individual post. “Tag a friend who needs this,” “like if you agree,” and comment-vote polls all qualify. So does reposted content with a competitor platform’s watermark, and so does a link dropped in a post with nothing else around it.
Engagement bait stays tempting because it moves the metric everyone reports. It moves it for exactly one post. Then the Page carries the demotion into every post after it.
What Meta suppresses and what it carries
The left column earns one good post and a Page-level penalty afterward. The right column compounds.
DEMOTED
Engagement bait
“Tag a friend,” “like if you agree,” comment-vote polls. Repeat offenders get demoted at the Page level, not just the post.
Watermarked reposts
A TikTok logo in the corner tells Meta the content was made for somewhere else.
Bare link drops
A URL with no reason to stay on Facebook predicts an exit, and exits are a negative signal.
Landscape video
New video publishes as a Reel. A 16:9 crop wastes most of the frame Meta is distributing.
DISTRIBUTED
Saves
A deliberate act with a cost. Predicts the viewer wanted the post to exist tomorrow.
Shares to a person
Sending a post to one friend beats broadcasting it to none. This is where viral reach comes from.
Comments with replies
A conversation is two signals. Answer within the hour and you create the second one yourself.
Native vertical Reels
Uploaded to Facebook, 9:16, hook inside two seconds. The only format still gaining engagement.
6. Move Distribution Into Groups and Staff Feeds
A Facebook Group reaches its members far more reliably than a Page reaches its followers, because Group content is served on a different logic. For local service clients, a Group is usually the single highest-return thing you can build, and it takes about six weeks to be worth anything.
Employee advocacy works on the same principle. Eight staff members with 500 connections each is a distribution network the Page will never have.
A caution, since this claim circulates constantly: you’ll read that personal profiles get five times the organic reach of Pages. There’s no public dataset behind that number. Treat it as a hypothesis worth testing on one client for one cycle, not a fact worth putting in a pitch deck.
7. Find Each Client’s Posting Window and Frequency Instead of Copying a Study
Published best-time-to-post studies disagree with each other, and they should, because they’re averaging across industries that share nothing. Thursday at 9 a.m. is a fine place to start and a terrible place to stop.
Run two windows against each other for one 28-day cycle. Same content type, same format, same frequency. Change the hour and nothing else. Then keep the winner and test something else. Anything faster than 28 days is measuring noise, which is the whole reason for the cycle.
Frequency deserves the same treatment, and it’s the easiest place to lose ground. Reach falls, so the Page posts more to compensate. Seven mediocre posts a week replace three good ones, each competing with the last for the same audience, and average reach per post drops again. That reads as further decline, which invites more posting.
Three to five posts a week is a reasonable starting hypothesis for most Pages. Test down before you test up. A client publishing five times a week who drops to three and holds total reach flat has just handed you back two slots of production time, and that time is the actual product an agency sells.
8. Turn the Winning Pattern Into a Goal and an Alert
A pattern that only holds while you’re watching it isn’t a pattern, it’s a person. Two things fix that.
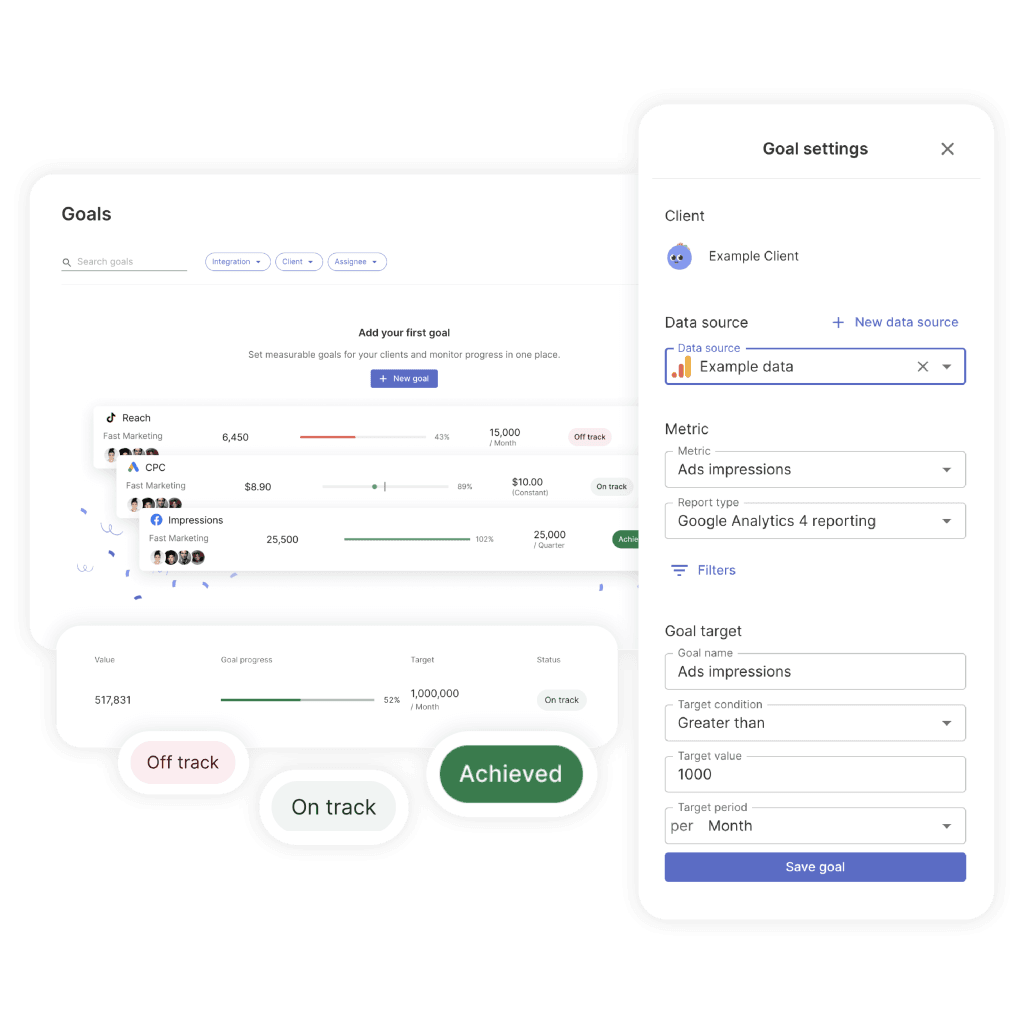
Set the target first. Open Monitoring → Goals → +New Goal, pick the client, the Facebook Insights data source, and Post Reach as the metric. Set the condition and the target value, then the period. Goals report as On Track, Off Track, or Achieved, and the Recent Periods Overview shows you the client’s actual historical values while you’re picking the number, so you set a target instead of guessing one.
Then set the tripwire. Alerts check any metric daily and notify you when it goes out of bounds, with trigger periods of 1, 7, 30, or 90 days. Route them to Slack, and use Advanced settings to skip weekends so nobody learns to ignore them.
Alert on the leading metric, not the lagging one. Post Reach and shares move first. Follower count moves last, and by the time it moves you’ve already lost the quarter. That distinction is the whole argument in monitoring vs reporting.
9. Report Reach as a Business Outcome
Reach is an input. Clients pay for outputs. The report should say so.
“We reached 41,000 people” invites the question you don’t want. “Reach fell 6% while shares doubled and 38 people asked about pricing in the comments” answers it before it’s asked. Same month, same Page, entirely different meeting.
Swydo AI drafts that framing from the report data with four prompts: Summary, Wins, Issues, and Recommendations. Point it at the Facebook section with the paperclip icon, then drop the AI summary block into the scheduled report email so it regenerates on every send. You edit the draft instead of starting from a blank page at 11 p.m. on the last day of the month.
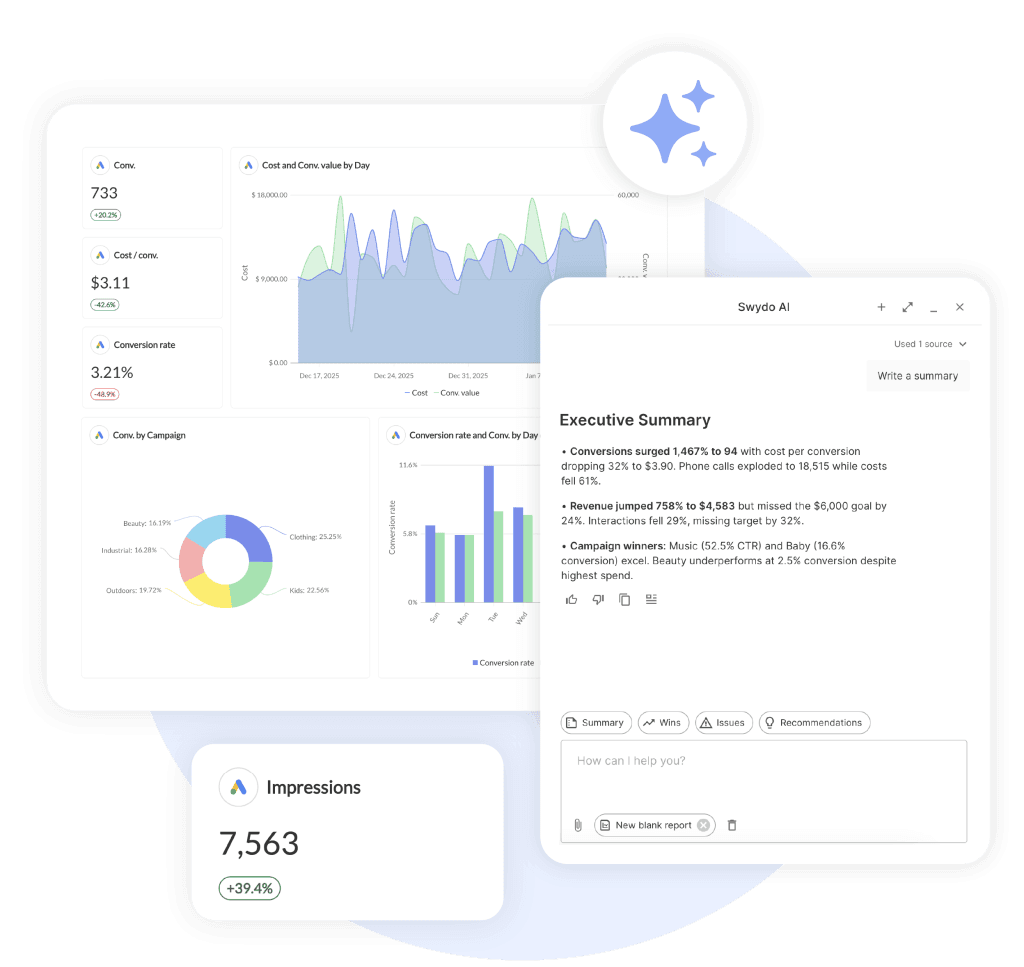
That’s the whole loop, and it’s the difference between client reporting best practices as a phrase and as a practice. Run it across a portfolio and it becomes report automation for marketing agencies rather than nine people copying numbers on the 30th.
Is It Really That Simple?
No, and the reason is structural.
Roughly half of what a person sees in the Facebook Feed now comes from accounts they don’t follow. Meta’s Feed is a recommendation engine that happens to include your client’s Page, not a subscription feed that happens to recommend things. Your client isn’t competing with their competitors for followers’ attention. They’re competing with every video Meta believes that person wants to watch, which includes people who have never heard of them and never will.
That has two consequences worth saying out loud to a client.
Follower count is nearly worthless as a reach denominator. Reach rate as a percentage of followers survives only because clients understand it, not because it describes how distribution works. Keep reporting it, and plan against something sturdier.
And organic Facebook reach has a hard ceiling that no amount of content skill breaks through. The agencies that do well here stopped treating organic as a channel and started treating it as a test bench. You publish six Reels, two of them earn saves and shares well above the client’s baseline, and those two get paid budget behind them.
Organic tells you which creative deserves money. Paid delivers the reach. Organic reach sold as a growth channel in its own right is a 2016 product, and the honest version of that conversation is the same one that underpins Google Ads vs Facebook Ads budget splits.
So when do you stop? If a Page sits below 1% reach for two full cycles while shipping vertical Reels weekly and earning saves, the Page isn’t the problem. The offer is, or the audience is. Say that in month three, not month twelve. Clients forgive a hard diagnosis. They don’t forgive a slow one.
What does your last Facebook client review actually say about which of those two it was?
Common Questions About Facebook Reach
Facebook Reach FAQ for Agencies
Straight answers for measuring and rebuilding organic reach across a client book
Around 1% to 2% of followers per organic post is average.
Pages under a few thousand followers routinely beat that. Pages above 50,000 rarely do, because reach rate shrinks as the follower base grows. The only benchmark worth acting on is the client’s own trailing 90 days. A Page with 80,000 followers reaching 900 people per post isn’t broken, it’s average.
| Metric | Platform average | Read it as |
|---|---|---|
| Organic reach rate | 1.2% to 1.65% | Below 1% needs a look |
| Engagement rate | 0.15% | Roughly flat year to year |
| Reels engagement | 0.15% | Only format still climbing |
No, but it works better as a test bench than a growth channel.
Organic reach tells you which creative earns attention. Paid delivers that creative to an audience at scale. The workflow that gets results: publish several Reels, find the ones that earn saves and shares above the client’s baseline, then put paid budget behind those. Selling organic as a standalone growth engine is the part that no longer holds.
Reach counts unique people who saw a post. Impressions count every time it was shown.
One person who scrolls past the same post twice is one reach and two impressions. Meta has also started using “views” as the headline number in place of impressions on some surfaces. For agency reporting, the point that matters more is splitting organic, paid, and viral reach instead of showing one combined figure that lets a small boost look like content strategy.
Reach is how many people saw the post. Engagement is how many acted on it.
They feed each other, and the direction matters. Engagement drives reach more than reach drives engagement, because the algorithm reads early interaction as a signal to show the post to more people. That’s why a post with twelve real comments can out-reach one with four hundred passive likes.
It scores every candidate post and shows the highest scorer first.
The score comes from four steps. Inventory is everything that could appear in a person’s Feed. Signals are what Meta knows about each post, and its documentation describes hundreds of thousands of them. Predictions turn those signals into probabilities, like how likely the person is to comment or watch to the end. The relevance score collapses those predictions into one number. The lever isn’t volume, it’s the chance that a specific person does something deliberate with the post.
Because the Feed is now a recommendation engine, not a subscription list.
Roughly half of what a person sees comes from accounts they don’t follow. That has a direct reporting consequence: follower count is a weak denominator for reach, since a client competes with every post Meta thinks a viewer wants, not just with rival Pages for their own followers. Keep reporting reach as a percentage of followers because clients understand it, and plan against sturdier signals like saves and shares.
Yes, and it can penalize the whole Page, not just the post.
“Tag a friend who needs this,” “like if you agree,” and comment-vote polls all count as engagement bait, and Meta demotes Pages that use it repeatedly. The trap is that it moves the exact metric most reports lead with, so it looks like it worked for one post. Then the demotion follows the Page into every post after it.
A little, and only for the small share of followers who actually do it.
Favoriting a Page or choosing “See First” does push its posts higher for that person, so it’s worth a genuine ask now and then. Just don’t build a strategy on it. Most followers never change the setting, and turning the request into a repeated call to action drifts toward the engagement bait the algorithm demotes.
Yes. Reels are the clearest path to people who don’t already follow the Page.
All new video on a Facebook Page publishes as a Reel, Reels are the only format whose engagement is still rising, and Meta’s recommendation system actively pushes recent Reels to non-followers. Photos and text mostly reach existing followers. Shoot vertical at 9:16, land the hook in the first two seconds, upload natively, and never post a file with another platform’s watermark on it.
Posts people save and share.
Saves and shares are the strongest signals a post can earn. A like predicts almost nothing, because it costs nothing. The difference shows up in the first line. “Book your summer service before the rush” earns likes from people who already booked. “The five noises that mean your AC dies in August, and the one that means it’s fine” earns saves from people who will book in six weeks.
Three to five times a week is a starting point, not a rule. Test down before you test up.
Posting more to fix falling reach usually lowers reach per post, because each post competes with the last one for the same audience. A client who drops from five posts a week to three and holds total reach flat has just handed back two slots of production time, which is the actual product an agency sells.
A little, and far less than on Instagram. Two to five relevant tags is the ceiling.
Hashtags on Facebook mainly help categorize a post so it can surface in a topic search, which reaches a few people who don’t follow the Page. They won’t rescue a weak post. Stacking ten or more looks spammy and can suppress reach, so treat them as light organization, not a growth lever, and put the effort into the content itself.
A bare link with no other context usually does.
Facebook would rather keep people on Facebook, so a post that’s just a URL pointing off-platform predicts an exit, and exits are a negative signal. You don’t have to abandon links. Lead with a real post that stands on its own, then include the link, or put it in the first comment. Reposting the same link across many groups is the version most likely to get throttled.
Check the reporting before the content.
A reach line can fall because Meta deprecated the underlying metric, because the date range slipped off a 1, 7, or 28-day window and switched to an estimate, or because a data connection broke quietly and the chart went half empty. If the data is clean, the usual causes are a format change, a Page-level demotion from engagement bait, a repost carrying another platform’s watermark, or plain seasonality. Rule out the measurement problem first, since it’s the fastest to confirm.
Probably not in the way people mean. Facebook doesn’t run an official shadowban, but it does demote content.
What gets called a shadowban is almost always a reach demotion from a known cause: engagement bait, reposted or watermarked content, too many hashtags, repeated identical links, or automated activity. Fixing the cause is more useful than chasing a ban. Slow down, post fresh native content, drop the tag-and-link spam, and reach recovers. A sudden drop with none of those causes is usually a broken data connection or seasonality, not a penalty.
Anything Meta reads as gaming the Feed or pulling people off it.
The repeat offenders are engagement bait, reposts with a competitor platform’s watermark, bare link drops, hashtag stuffing, and content the tool republishes unchanged. Most of these raise a vanity metric for one post and cost the Page reach on every post after. Clean native posts that earn saves and shares are the opposite signal, and they compound.
No. Boosting buys paid reach, not organic reach.
Treating the combined number as one figure is how ad spend gets reported as content performance. Boosting can produce viral reach indirectly, if paid viewers share the post to people who weren’t targeted. Split the three in the report so you can tell which one actually happened, and so a client can see what their content did on its own.
Because Meta returns exact reach for 1, 7, and 28-day ranges only. Everything else is an estimate.
Set the reporting range to 28 days and the number you show a client is the number Meta actually holds. When a client insists on calendar months, log the exact 28-day figure alongside the monthly view and label it, so your number and their Business Suite number never disagree in a meeting. A 28-day window is also long enough to survive one bad day and short enough to still work as a test.
Put every client on one screen instead of opening dashboards one at a time.
Checking each Page by hand is fine at three clients and punishing at thirty. A cross-client view that shows reach and engagement for the whole book side by side, plus per-client targets and an alert when one drifts, turns the daily check into one screen. That’s the difference agencies feel when a book grows: the manual routine scales with every client won, a single dashboard doesn’t.
Use a tool that watches connections for you instead of finding out when a chart goes blank.
An expired Facebook token drops the data quietly, and in most setups the first sign is a client asking why their report is half empty. A connection-health check that flags a broken token or permission the moment it happens, and points you to the fix, moves that discovery to before the send. Checking it should be the last step before any report goes out.
As a business outcome, not a raw number.
“We reached 41,000 people” invites the question you don’t want. “Reach fell 6% while shares doubled and 38 people asked about pricing in the comments” answers it first. Split organic from paid, show saves and shares next to reach so the number has an explanation, and lead with what those numbers meant for the client’s business.
Final Thoughts
Three things carry most of the result. Measure on 28-day windows, because that’s what Meta reports exactly and everything else is an estimate you’ll have to defend. Publish video as Reels, vertical and native, because Meta distributes nothing else. Chase saves and shares instead of likes, because those are the signals that actually move distribution.
The rest is discipline. One variable per cycle, a goal with a real target behind it, and an alert that reaches you before the client does. Run it for two cycles and you’ll have something most agencies never bring to a review: a reach number you can explain.
Organic Facebook reach isn’t dead. It’s just small, measurable, and honest about what it is, which makes it a much better test bench than it ever was a growth channel.
Stop guessing why your Facebook reach is tanking. Track the metrics that predict algorithm changes before they happen.
Start Your Free Trial Today