
Your agency work demands you consistently deliver quantifiable results for clients via Instagram advertising. The platform’s rapid evolution has likely left you scrambling to keep up with client expectations that seem to shift with every new feature release.
One thing remains clear amidst the constant change: success on Instagram now requires more than just creative content. It demands a data-driven approach to campaign optimization and client reporting. The challenge, of course, is figuring out which metrics actually matter when it comes to driving real business outcomes for your clients.
We designed this guide specifically for agency pros like you who are looking to level up your Instagram Ads game. We’ll cut through the noise and zero in on the metrics that make a tangible difference to your clients’ bottom lines. We deliver practical, data-driven insights that help you optimize campaigns, demonstrate your value, and build lasting relationships with clients.
Why Instagram Ad Metrics Matter for Your Agency
Before we examine specific metrics in detail, it’s essential for your agency’s success to have a strong understanding of these numbers. A strategic command of the right metrics can be transformative, allowing you to:
- Shift the conversation from a defensive justification of your activities to a proactive demonstration of the value you’re delivering
- Tie your efforts directly to the KPIs your client cares about most
- Solidify your position as an indispensable partner in their success
These metrics are more than just numbers for your agency – they’re the compass guiding every optimization decision you make. They help you determine:
- The most effective audience targeting strategies
- How to craft compelling creative
- Where to allocate budgets for maximum impact
Tracking and analyzing key data points consistently can help you drive ongoing improvement and demonstrate a tangible return on investment for your clients with every campaign. Understanding metrics gives you the confidence to make decisions based on solid strategic reasoning.
Key Instagram Ad Metrics to Track
So, what are the most important Instagram Ad metrics to track for your client?
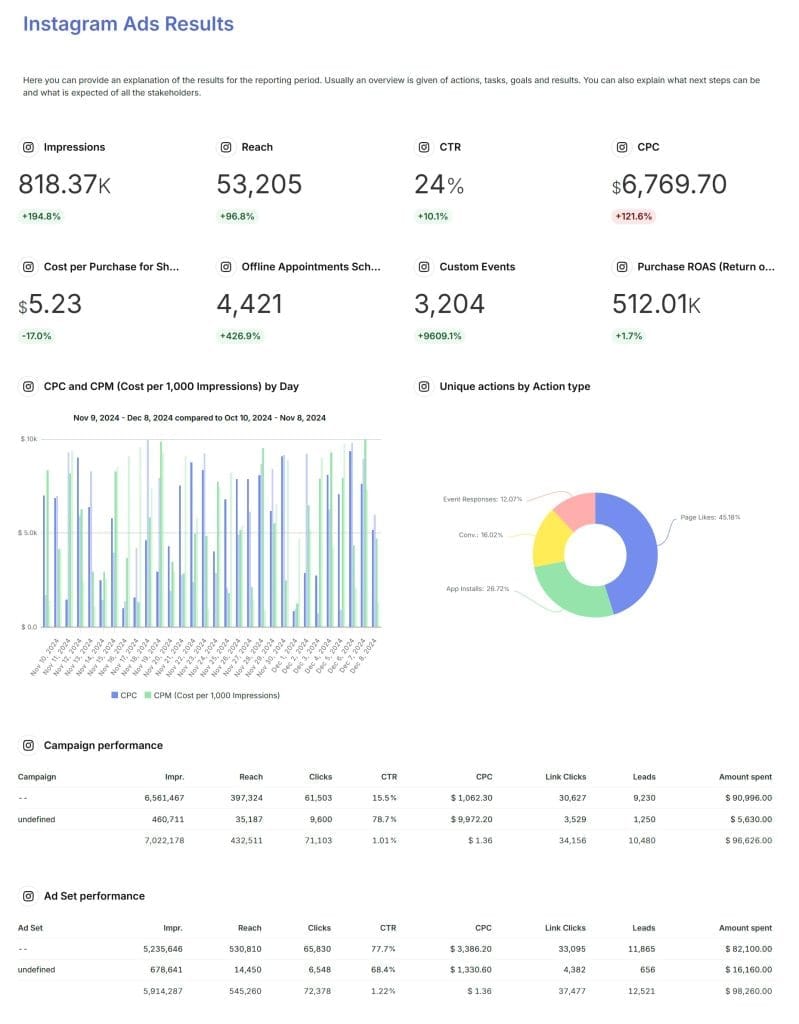
Impressions and Reach – Understanding Your Campaign’s Visibility
The first set of metrics that give you a crucial window into your campaign’s visibility are impressions and reach. While often mentioned in the same breath, these two metrics provide distinctly different insights that are essential for gauging the impact of your ads.
Impressions refer to the total number of times your ad was displayed, including multiple views by the same user. Tracking impressions gives you a sense of your ad’s overall exposure and can help you spot important trends:
- A high impression count might indicate that your ad is being served frequently
- It could mean your bidding strategy is effective
- On the other hand, you might bombard your audience with too many ads, leading to ad fatigue.
Reach, however, hones in on the unique users who were exposed to your ad, regardless of how many times they saw it. This metric gives you a clearer picture of the actual size of the audience you’re impacting.
When evaluating reach, consider:
- What percentage of your target audience you’re successfully connecting with
- How that maps to your specific campaign objectives
- Whether you’re continually expanding your reach to new prospects or hitting the same users repeatedly
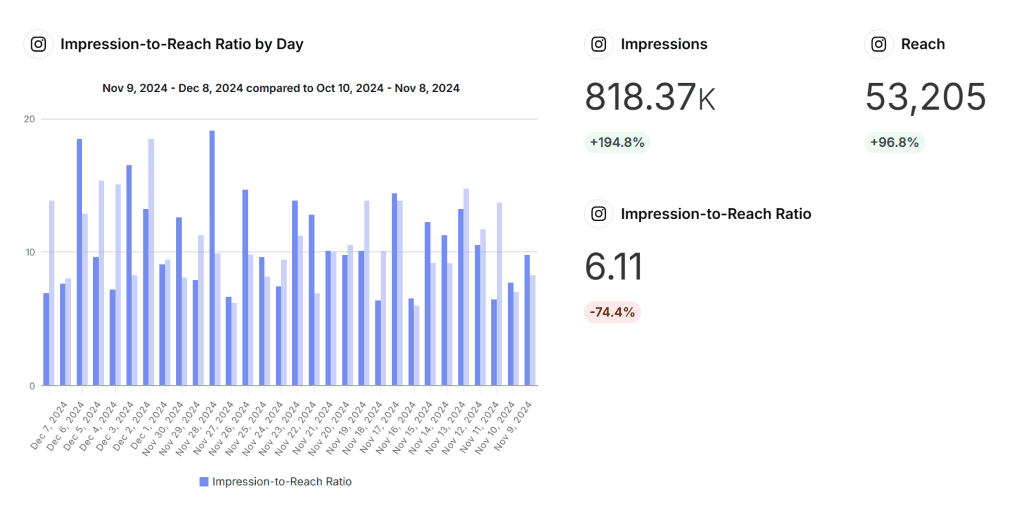
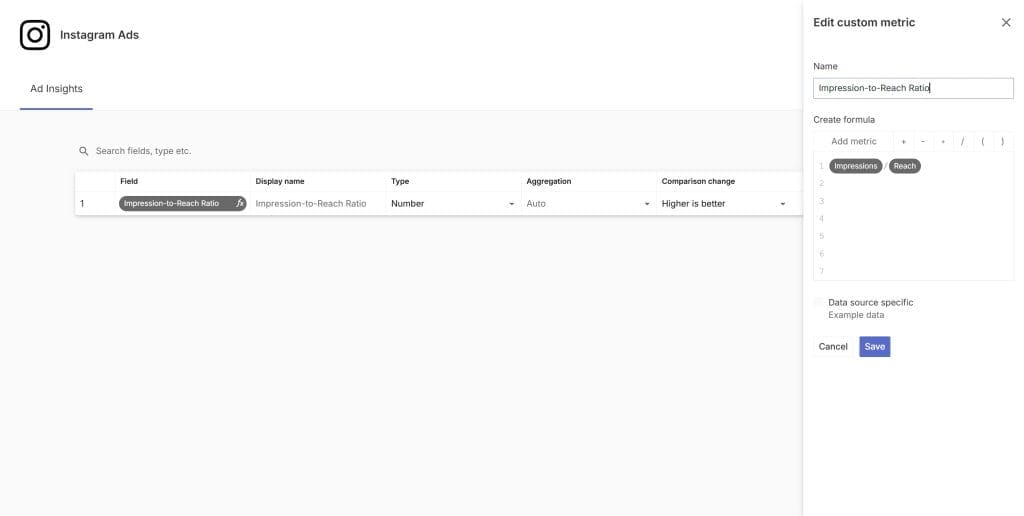
Comparing impressions to reach can uncover actionable insights about your campaign’s performance:
| Impression-to-Reach Ratio | Potential Implications |
|---|---|
| High | – You’re bombarding the same users too frequently – Your audience targeting is too narrow – You need fresh creative to combat ad fatigue |
| Low | – Your ads aren’t being shown frequently enough to make a memorable impact – Your audience targeting is too broad – You need to increase your budget or fine-tune your bidding approach |
Carefully monitoring these visibility metrics and the interplay between them can ensure that your ads reach the right people with the right frequency to make a lasting impact. It’s the crucial first step toward driving the engagement and conversion metrics that your clients ultimately care about.
Click-Through Rate (CTR) and Cost-Per-Click (CPC) – Measuring Engagement Efficiency
Assessing how effectively your ads are spurring your audience to take action is the next step once you clearly understand your campaign’s visibility. Click-through rate (CTR) and cost-per-click (CPC) enter the picture here, providing a snapshot of your ad’s engagement power and cost-efficiency.
CTR measures the percentage of impressions that resulted in a click, giving you a pulse check on how compellingly your ad creative and copy are resonating with your target audience.
While “good” CTR benchmarks vary significantly by industry and ad placement, the most important thing is to establish your own baselines and strive for continuous improvement over time.
To move the needle on CTR, focus on:
- Testing different creative approaches
- Honing your audience targeting
- Experimenting with various ad placements
- Using clear calls-to-action
- Ensuring that your ads are highly relevant to your target audience
CPC sheds light on how efficiently you’re channeling your client’s budget into driving those all-important clicks while CTR illuminates your ads’ magnetism. This metric can be influenced by a myriad of factors:
- The competitiveness of your target audience
- Your ad’s relevance score
- The granularity of your targeting
- Time of day and seasonality
To keep your CPC in check:
- Keep a close eye on performance trends to spot any concerning spikes or identify opportunities for improvement
- Experiment with different bidding strategies aligned with your campaign goals, whether that’s minimizing costs, maintaining a predictable CPC, or prioritizing conversions
- Continually refine your audience targeting to ensure you’re reaching the most receptive and relevant prospects
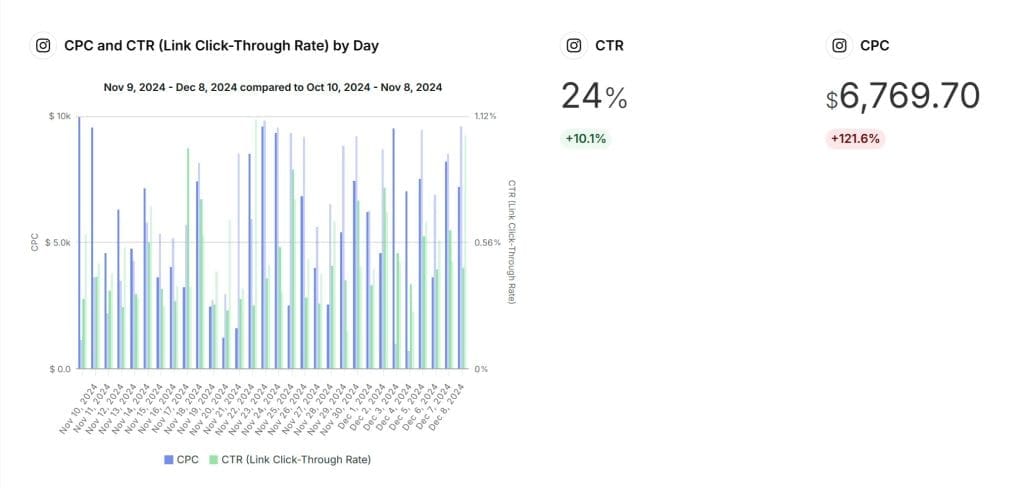
CPC and CTR are most powerful when analyzed in tandem:
| CTR | CPC | What It Means |
|---|---|---|
| High | Low | You’ve hit the sweet spot of compelling, relevant creative served to a precisely targeted audience |
| Low | High | Your ads are missing the mark – revisit your creative approach and targeting strategy |
It’s crucial to remember that a myopic focus on CPC can sometimes work against your ultimate objectives while it can be tempting to get caught up in chasing the lowest possible costs. A higher CPC can actually be warranted for conversion-focused campaigns if it’s bringing in users who are more likely to take that desired action.
The key is always to consider your CPC in the context of your broader campaign goals and the downstream metrics that matter most to your client’s business. Finding the right balance between engagement and cost efficiency can prove to your clients that you’re not just driving clicks but driving the right clicks that lead to meaningful business outcomes.
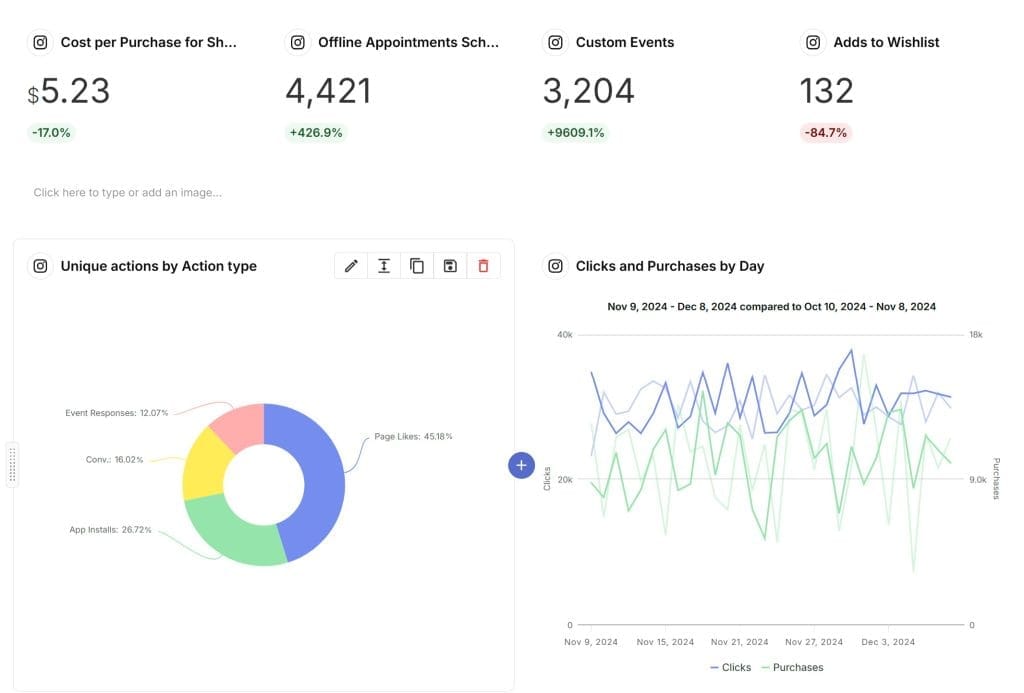
Custom Conversions and Cost Per Conversion – Tracking Real Business Impact
Custom conversions allow you to track the specific user actions that are most critical to your client’s business goals, whether that’s making a purchase, submitting a lead form, downloading a piece of content, or any other valuable action. Setting up custom conversions and tracking their associated costs can tie your Instagram ad efforts directly to the outcomes your clients care about most.
Proper conversion tracking hinges on meticulous setup through the Meta Pixel or Conversions API. Skipping this crucial step is one of the most common and costly mistakes agencies make. Without accurate conversion data, you’re essentially flying blind, unable to make informed optimization decisions or prove the tangible value of your work to clients.
Custom conversions open up a treasure trove of insights that can supercharge your optimization efforts and make reporting a breeze when set up correctly:
- Track the full user journey from initial ad view to ultimate conversion
- Identify which audience segments are driving the most valuable actions
- Make data-driven decisions to continuously fine-tune your campaigns for maximum impact
Tracking conversions is only half the battle – you also need to keep a close eye on how much you’re spending to achieve each conversion. This cost per conversion metric is the key to ensuring that your campaigns are not only driving results but doing so in a cost-effective way that makes sense for your client’s business.
To keep your cost per conversion in check:
- Create laser-targeted audiences – leverage tools like lookalike audiences to reach users who are most similar to your best existing customers, and be judicious about excluding audiences who are unlikely to convert
- Optimize your post-click experience – your ad is only as strong as the experience users have after they click; work with your clients to ensure that landing pages are seamlessly aligned with your ad creative and primed for conversion
- Test, test, test – continuously experiment with different creative approaches, calls-to-action, and audience targeting to incrementally drive down your cost per conversion over time
Be patient. Conversion-focused campaigns typically require a learning period for Instagram’s algorithms to optimize delivery for your desired action. Avoid the temptation to make knee-jerk adjustments, and instead allow for an initial learning phase before making more tactical optimizations.
Diligently tracking custom conversions and their associated costs can paint a clear, compelling picture for your clients of how your Instagram advertising efforts directly contribute to their bottom line. It’s the ultimate proof point of your agency’s value and the key to forging long-term, results-driven partnerships.
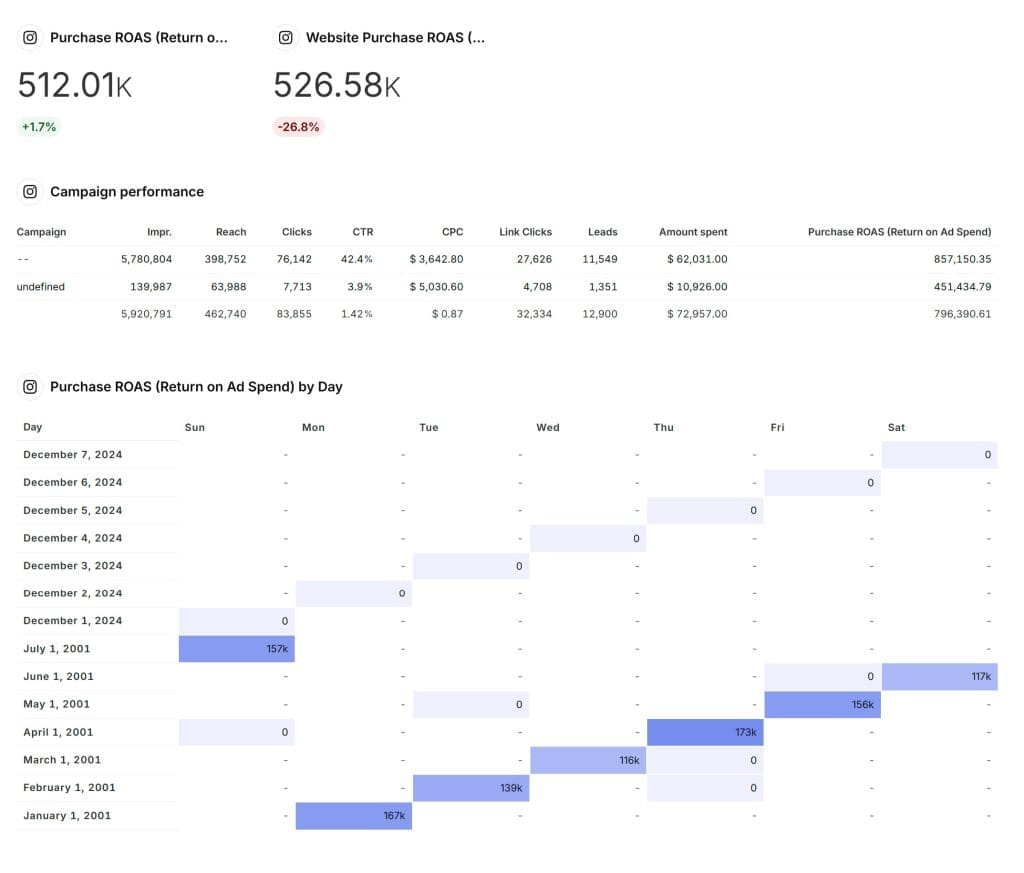
Return on Ad Spend (ROAS) – The Bottom Line Metric for Ecommerce Clients
Return on ad spend (ROAS) is undoubtedly the metric that rules them all for your ecommerce clients. This powerhouse metric reveals the revenue generated for every dollar spent on advertising, giving you the clearest possible picture of your campaigns’ impact on your client’s bottom line.
Achieving a strong ROAS is the ultimate proof point of your agency’s value. It demonstrates that you’re not just driving vanity metrics but truly moving the needle on the outcomes that directly impact your client’s business success. Your ability to consistently deliver a high ROAS makes you a valuable asset to your clients, driving their growth and building lasting partnerships.
To maximize your ROAS:
- Double down on your top performers – lean into the audience segments, creative approaches, and placements that are delivering the highest ROAS; consider allocating more budget to these proven winners
- Reach for the high-hanging fruit – focus your efforts on reaching the most valuable customers, those with the highest average order values and lifetime value
- Get granular with your product focus – hone in on your client’s highest-margin products that pack the biggest ROAS punch; consider tactics like product bundling to boost average order value
- Adopt a full-funnel approach – while a laser focus on bottom-of-funnel conversions is key, don’t neglect the importance of upper-funnel efforts in priming your audience and driving more cost-effective conversions down the line
- Be proactive about ROAS targets – work with your clients from day one to establish clear, realistic ROAS goals that align with their broader business objectives and constraints; having these mutually agreed-upon targets will help you stay aligned and avoid any unwelcome surprises down the road
Show your clients you’re a partner in their growth, not just another budget item, by obsessively focusing on ROAS and exploring every lever to boost it.
How to Align Your Metrics with Client Objectives
As an agency, it’s crucial to recognize that the relative importance you place on each metric will vary depending on the specific objectives your client has enlisted your agency to achieve. While the metrics we’ve covered are universally important, you must adapt your approach to align with your client’s goals.
Some examples of tailoring your metrics focus to client objectives:
- For a mobile gaming app install campaign, prioritize cost per install and in-app actions over mere click-through rates
- For a B2B brand awareness play, prioritize reaching the right decision-makers over maximizing total reach
- For an ecommerce conversion campaign, focus on ROAS and cost per purchase over vanity metrics like engagement rate
Awareness Campaigns
For clients focused on expanding their brand’s reach and visibility, metrics like impressions, reach, and ad recall should be your north stars. Your aim is to get your client’s brand in front of as many fresh eyes as possible, making a memorable splash that leaves a lasting impression.
To make the most of awareness campaigns, monitor your frequency metrics closely to avoid oversaturating your audience. Pay attention to indicators of strong engagement, such as video views and post saves, which suggest that your message is resonating. Consider using Brand Lift studies to directly measure the impact your campaigns have on key brand perception metrics.
- Objective: Increase brand visibility and reach among target audience
- Primary metrics: Reach, Impressions, Ad Recall Lift
- Secondary metrics: Video Views, Engagement Rate, Follower Growth
- Key considerations: Monitor frequency to avoid oversaturation, look for signs of strong engagement, use Brand Lift studies to measure impact on perception
Consideration Campaigns
When your client’s goal is to drive interest and engagement with their brand, focus on metrics like click-through rate, engagement rate, and cost per click. These campaigns are all about sparking meaningful interaction and getting your audience to actively consider your client’s offering.
To create consideration campaigns that truly connect, experiment with interactive formats like polls and question stickers to invite audience participation. Analyze the sentiment and themes of your comments to gauge how well your content is landing. Keep a close eye on your cost per click to ensure you’re efficiently driving quality traffic to your client’s website or app.
- Objective: Drive interest and engagement with the brand
- Primary metrics: Click-Through Rate, Engagement Rate, Cost per Click
- Secondary metrics: Link Clicks, Video Average Watch Time, Landing Page Views
- Key considerations: Experiment with interactive formats, analyze comment sentiment, monitor cost efficiency
Conversion Campaigns
For bottom-of-funnel campaigns laser-focused on driving specific actions, custom conversions and cost per conversion should be your guiding lights. While click-through rate and cost per click still matter, they are secondary to your ultimate goal of driving tangible business results.
To create conversion campaigns that impact the bottom line, monitor how your audience moves through the full funnel, identifying any drop-off points or conversion roadblocks. Relentlessly test every element of your campaign, from audience targeting to ad creative, to eke out incremental improvements in your conversion rates and costs. Use remarketing campaigns to nudge hesitant prospects across the finish line and maximize your conversion potential.
- Objective: Drive specific profitable actions like sales, signups, or lead generation
- Primary metrics: Custom Conversions, Cost per Conversion, Return on Ad Spend (ROAS)
- Secondary metrics: Click-Through Rate, Cost per Click, Funnel Drop-Off
- Key considerations: Test all campaign elements, use remarketing to nudge hesitant prospects, focus on incremental improvements
Additional Campaign Types
| Campaign Type | Objective | Key Metrics | Considerations |
|---|---|---|---|
| Traffic | Drive targeted website or app traffic | Link Clicks, CPC, CTR, Bounce Rate | Optimize for quality traffic, monitor landing page performance |
| App Installs | Drive app downloads and engagement | App Installs, Cost per Install, App Opens, In-App Actions | Highlight app benefits, test different app store assets |
| Video Views | Increase video engagement and reach | Video Views, Average Watch Time, Video Completion Rate | Experiment with video lengths, optimize for watch time |
| Lead Generation | Collect qualified leads | Leads Generated, Cost per Lead, Lead Form Completion Rate | Offer incentives, keep forms concise, integrate with CRM |
| Messages | Drive conversations with potential customers | New Conversations Started, Cost per New Conversation, Messaging Replies | Set up welcome messages, use engaging copy, respond promptly |
What truly distinguishes you as a strategic partner is your ability to choose and prioritize the most relevant metrics for each client and campaign. Focus on how your measurements contribute to your client’s bottom line to deliver the results that truly matter to them.
How to Combine Instagram Metrics for a Comprehensive View
Recognize that while individual metrics are important, the real power comes from combining them to gain a holistic view of your campaigns’ performance. Here are a few key metric combinations that can provide valuable insights for your clients:
- Reach & Engagement Rate: This combination helps you understand what percentage of your reached audience is actively interacting with your content. A high reach with a low engagement rate could indicate that your content isn’t resonating with your target audience, while a low reach with a high engagement rate might suggest an opportunity to expand your targeting.
- CPM & Frequency: Monitoring these metrics together can help you optimize your ad delivery. If your CPM is high and your frequency is also high, it could indicate ad fatigue, and that you need to refresh your creative or expand your audience. On the other hand, a low CPM and low frequency might mean you have room to increase your bid or budget to drive more impressions.
- CPC & Conversion Rate: Analyzing these metrics together can help you understand the quality of the traffic you’re driving. A low CPC might seem great, but if it’s paired with a low conversion rate, it could mean you’re driving a lot of low-quality clicks. Conversely, a high CPC paired with a high conversion rate indicates that you’re efficiently driving high-value traffic.
- ROAS & LTV: For ecommerce clients, understanding the relationship between your return on ad spend and your customers’ lifetime value is crucial. A campaign with a lower immediate ROAS might still be valuable if it’s bringing in customers with a high LTV. This insight can help guide your optimization strategies and budgeting decisions.
Align your metric combinations with your client’s specific KPIs and business goals. For instance, if your client is focused on building their email list, you might prioritize combinations like reach and email signup rate, or CPC and new subscriber cost. The key is to always tie your metrics back to the outcomes that matter most to your client.
How to Put Instagram Ad Metrics into Action for Client Success
Recognize that while understanding these key metrics is a critical first step, the real magic happens when you put that knowledge into action. Make metrics an integral part of your agency’s Instagram advertising approach with these pro tips:
How to Put Instagram Metrics into Action for Client Success
Turn your metric insights into tangible results for your clients by operationalizing them in your day-to-day work:
- Set SMART Goals: Use your metrics to set Specific, Measurable, Attainable, Relevant, and Time-bound goals for your campaigns. For instance, “Increase ROAS by 20% over the next quarter by optimizing ad placements and targeting.”
- Create a Testing Roadmap: Translate your metric insights into a clear testing plan. If your CTR is low, plan a series of creative tests. If your CPC is high, map out different audience targeting strategies to try. Use your metrics to guide your optimization priorities.
- Report & Optimize Regularly: Don’t let your metric insights gather dust. Set a regular cadence for reporting on your key metrics and, crucially, acting on those reports. Establish a clear process for translating metric movements into optimization actions.
- Communicate Impact: Don’t just report the numbers – tell the story of how your optimizations are driving meaningful results. If a round of creative testing boosted your ROAS by 15%, share that win with your client and explain how you’ll apply those learnings going forward.
- Ongoing Evaluation: As your campaigns run and your client’s business evolves, continually reassess which metrics matter most. If your client launches a new product line, lifetime value might become more important than immediate ROAS. Stay flexible and always align your metric focus with your client’s current priorities.
Metrics are only useful if they motivate action and lead to positive outcomes. Show your clients real results by leveraging metric expertise to constantly improve performance and drive bottom-line growth.
Key Takeaways
Take your Instagram advertising to the next level and get real results for your clients:
- Know the metrics that matter most: Understand the key metrics for each part of the funnel, from reach and impressions for awareness to custom conversions and ROAS for bottom-line impact.
- Match metrics to client goals: Make sure the metrics you focus on always connect directly to your client’s specific business objectives. Change your approach for different campaign types, from brand building to direct response.
- Use metric combinations for complete insights: Look at metrics in pairs or groups to get a full view of your campaigns’ performance. Use these insights to guide your optimization strategies.
- Make metrics part of your agency’s DNA: Integrate metrics into your team’s daily work. From setting goals to testing to reporting, make sure data is always at the center of your decisions.
- Turn insights into action: Transform your metric know-how into real results by putting your data to work. Use your insights to drive constant optimization and meaningful business impact.
These key principles will guide you in establishing your agency as a data-driven force, delivering outstanding results, and fostering strong, long-term client partnerships. Success in Instagram advertising demands deep knowledge of metrics, not simply a passing familiarity.
Transform Instagram Ad metrics into reports that win clients and drive results.
Start Your Free Trial