
Every agency has had this moment. The client leans forward in the quarterly review and asks: “So… is our lead generation actually working?” You have dashboards. You have numbers. But the question hangs there because the numbers don’t connect to the answer.
That gap—between the data you track and the questions clients actually ask—is what lead generation KPIs are supposed to close. But most agencies either track too many metrics (and drown in noise), too few (and miss the signals), or the wrong ones entirely.
This guide fixes that. Whether you’re building your lead generation for agencies playbook from scratch or refining an existing one, we’ll cover which KPIs actually matter, what “good” looks like with real benchmarks, and how to report them following client reporting best practices that build trust instead of confusion. We’ll also walk through how to set up KPI monitoring so problems surface before the client notices—not after.
What Are Lead Generation KPIs
A lead generation KPI is a measurable value that tells you whether your lead generation efforts produce the business outcomes your client needs. Not vanity wins. Not “activity” metrics. Outcomes tied to revenue.
Think of it like a fishing operation. Raw lead volume is how many fish you pull out of the water. But the KPI that matters is how many you can sell at market. If 9,500 of your 10,000 daily catch are the wrong species, the operation is failing—no matter how impressive the haul looks from the dock.
Lead generation KPIs work the same way. They measure what reaches revenue, not just what fills the CRM.
A quick distinction worth making: every KPI is a metric, but not every metric is a KPI. A metric is any data point you can measure—page views, email opens, ad impressions. A KPI is a metric tied to a business goal, with a target, that triggers action when it moves. Ask yourself: if this number shifts tomorrow, will you change what you’re doing? If yes, it’s a KPI. If no, it’s a metric. Keep it in context. Don’t put it on page one.
Why Lead Generation KPIs Matter More for Agencies Than Anyone Else
In-house marketers answer to one leadership team. You answer to 10, 20, or 50 different clients—each with different expectations, different industries, and different definitions of “success.” That multiplies both the stakes and the complexity.
- Retention depends on proof. Clients don’t churn because campaigns underperform for a month. They churn because they can’t tell if things are working. Clear KPIs with clear targets are your best client retention tool.
- Budget depends on attribution. When a client asks “should we increase spend?” you need a KPI-backed answer. Opinions get overruled. Data gets approved.
- Margin depends on efficiency. Time spent manually compiling reports is time not spent on strategy. Report automation for agencies directly protects your margin.
- Differentiation depends on insight. Every agency can run ads. Not every agency can explain what the numbers mean. Knowing which marketing KPIs clients care about gives you a competitive advantage.
So which KPIs should you actually track? It depends on the funnel stage.
The KPIs That Actually Matter, by Funnel Stage
Not every client needs every KPI. But every client needs the right 5–7. The full list of digital marketing metrics is long, but for lead gen specifically, the ones below move the needle. They’re organized by where each metric sits in the funnel—with formulas, benchmarks, and the context that makes each one actionable.
The lead-gen funnel
Which KPIs matter at each stage
Not every client needs every metric — they need the right 5–7. Here’s where each one sits, and the question each stage answers.
Top of Funnel
Are you in front of the right people?
Visitor-to-Lead Rate
2.9% all-industry median
Click-Through Rate
6.66% Google Ads avg
Cost Per Click
$5.26 Google Ads avg
Organic Search Traffic
748% average ROI
Middle of Funnel
Are these leads worth the sales team’s time?
MQL-to-SQL Rate
~15% median
Biggest bottleneckEmail Click-Through Rate
2.0% all-industry avg
Speed to Lead
5 min = 21× more likely
Bottom of Funnel
Is this investment actually profitable?
LTV:CAC Ratio
3:1 is the gold standard
Lead Velocity Rate
predicts 12–18 mo out
Pipeline Velocity
revenue moved per day
Single best KPITop of Funnel — Are You in Front of the Right People
Visitor-to-Lead Conversion Rate
Formula:
The most important top-of-funnel KPI. It measures the handoff between attention and action. Genesys Growth’s landing page conversion data puts the all-industry median at 2.9%. Legal firms lead at 7.4%. SaaS companies land between 1.1–3%. How does your client’s site compare?
Click-Through Rate (CTR)
Formula:
The all-industry Google Ads CTR average is now 6.66%, according to WordStream’s 2025 benchmarks. But a high CTR paired with a low conversion rate means the ad promises something the landing page doesn’t deliver. Always pair CTR with post-click metrics.
Cost Per Click (CPC)
Google Ads averages $5.26. LinkedIn runs $5–10. Facebook sits at $0.50–$3.00. These are just one piece of the PPC metrics picture. What matters isn’t whether CPC is “high” in a vacuum—it’s whether the downstream value justifies it. A $12 click that becomes a $50K deal is far more valuable than a $0.50 click that never responds.
Organic Search Traffic
When it comes to SEO metrics, the ROI story is hard to beat. SEO delivers an average ROI of 748%—far past any paid channel, according to Martal Group’s B2B benchmarks report. Organic leads convert at 2.1% visitor-to-lead vs. 0.7% for PPC, and hit a 51% MQL-to-SQL rate. If your client isn’t investing in organic, they’re renting all their leads.
Middle of Funnel — Are These Leads Worth the Sales Team’s Time
MQL-to-SQL Conversion Rate — The Biggest Bottleneck
Formula:
This is the single KPI that separates high-performing agencies from average ones. It’s one of the most critical conversion metrics in any funnel. The overall range sits at 12–21%, median around 15% (The Digital Bloom’s B2B SaaS funnel benchmarks). SEO-sourced MQLs convert to SQLs at 51%. Email at 46%. Paid search at 26%. A 5-point improvement here translates to a 12–18% revenue increase—without an extra dollar in ad spend.
What would that 5-point lift look like for your biggest client? Do the math. It’s usually enough to justify your entire retainer.
Email Click-Through Rate
Open rates have been inflated by Apple Mail Privacy Protection since 2021. Focus on CTR instead. All-industry average: 2.00–2.09%. Top performers: 6–10% (MailerLite’s 2025 email benchmarks report). Personalized emails drive 6× higher transaction rates.
Speed to Lead
A response within 5 minutes makes qualification 21× more likely compared to 30 minutes. The average B2B response time right now? 47 hours. If you help clients cut that below five minutes, you’ll see an immediate lift.
Bottom of Funnel — Is This Investment Profitable
LTV:CAC Ratio
Customer Lifetime Value ÷ Customer Acquisition Cost. The gold standard is 3:1. Below 1:1, the business loses money on every customer. Above 5:1, they’re probably underinvesting in growth. Don’t confuse this with ROAS vs ROI—LTV:CAC measures the full customer relationship, not individual campaign returns.
Lead Velocity Rate (LVR)
Formula:
LVR is a forward-looking metric. It predicts revenue 12–18 months out. If qualified leads grow 15%+ month-over-month, revenue growth follows. If it’s flat, no amount of bottom-of-funnel optimization will fix the pipeline.
Pipeline Velocity
Formula:
This distills the entire funnel into one number: how much revenue moves through the pipeline per day. Real estate leads at $2,456/day, financial services at $2,134/day, SaaS at $1,847/day. Improve any of the four inputs and velocity goes up.
What a Lead Actually Costs Right Now, by Channel
CPL is the metric clients ask about most. It’s also the one most likely to mislead. A “low” CPL means nothing if those leads never convert. But the benchmarks help you set expectations. These numbers come from First Page Sage’s 2026 CPL report and HubSpot’s CPL and CAC research.
Cost per lead, 2025–2026
What a lead actually costs, by channel
CPL is the metric clients ask about most — and the one most likely to mislead. The spread runs from under $30 to over $800.
Facebook Lead Ads
Cheapest paid · watch quality
SEO / Organic Best value
Lowest sustained CPL · 748% ROI
Email Marketing
$36–$45 ROI per $1
Google Ads (Search)
Highest intent · up 5.3% YoY
LinkedIn Ads
80% of B2B social leads
Trade Shows off this scale →
Priciest · but 40% close rate
A “low” CPL means nothing on its own. Always pair it with cost per qualified lead — a $50 lead that rarely qualifies can cost more than a $100 lead that usually does.
Linear scale capped at ~$115; the trade-show bar is shown clipped. Sources: First Page Sage 2026 cost-per-lead report; HubSpot CPL & CAC benchmarks.
| Channel | Avg CPL (2025–2026) | Context |
|---|---|---|
| SEO / Organic | ~$31 | Lowest CPL, 748% ROI |
| Facebook Lead Ads | $27.66 | Cheapest paid but watch quality |
| Email Marketing | ~$53 | $36–$45 ROI per $1 |
| Google Ads (Search) | $70.11 | Up 5.3% YoY, highest intent |
| LinkedIn Ads | $100–$110 | 80% of B2B social leads |
| Trade Shows | $800+ | Expensive but 40% close rate |
One trend to note: customer acquisition costs have risen roughly 60% over the past five years. If your client’s CPL is rising but qualification rates and revenue are also up, that’s acceptable. If CPL rises while quality stays flat, that’s a problem that needs attention right now.
| 💡 Always pair CPL with Cost Per Qualified LeadA $50 lead with a 10% qualification rate costs $500 per qualified lead. A $100 lead with a 50% qualification rate costs $200 per qualified lead. The “cheap” lead is 2.5× more expensive where it matters. |
Try it with your own numbers
The cheap lead that costs more
Cost per lead hides the truth. Cost per qualified lead reveals it. Drag the sliders — watch which source actually wins.
Source A
Cost per qualified lead
$500
Source B
Cost per qualified lead
$200
Formula: cost per lead ÷ qualification rate. Defaults match the example in this guide.
Industry-Specific Benchmarks — Because “Average” Means Nothing Without Context
A 2.9% conversion rate is meaningless if your client is in healthcare (where 4% is realistic) or enterprise SaaS (where 1.5% might be great for the deal sizes involved). This table pulls from The Digital Bloom’s funnel benchmarks, SerpSculpt’s industry conversion data, and First Page Sage’s SaaS KPI analysis.
| Industry | V-to-L % | MQL>SQL | Win Rate | Cycle | CPL | Pipe Vel |
|---|---|---|---|---|---|---|
| SaaS / Tech | 1–3% | 15–21% | 21% | 67d | $188 | $1,847/d |
| Healthcare | 3–4% | 13% | 25% | 72d | $285+ | $1,523/d |
| Financial | 3–4% | 19% | 22% | 89d | $461 | $2,134/d |
| Manufacturing | 2–5% | 15% | 19% | 124d | $250+ | $1,200/d |
| Prof. Services | 4–6% | 18% | 28% | 51d | $150 | $876/d |
Pull up this table the next time a client asks “is our 15% conversion rate good?” The answer always depends on the industry.
The Three-Layer Reporting Stack — How to Organize Lead Gen KPIs So Nothing Falls Through
Most agencies treat reporting as one job. It’s actually three—and mixing them up is why important signals get buried in client-facing PDFs that nobody reads carefully. If you’ve ever wondered about the real difference between dashboards vs reports or monitoring vs reporting, this framework makes it clear.
We call this the Three-Layer Reporting Stack:
The framework
The Three-Layer Reporting Stack
Reporting isn’t one job — it’s three. Separate them, and each layer does its job without burying the others.
Reports
Polished, branded, scheduled. 5–7 KPIs with targets, period-over-period change, and plain-English commentary.
“Is this actually working?”
↗ You send it
Boards
Internal dashboards across every client. Pipeline velocity, lead velocity, CPL by channel, MQL-to-SQL by source.
“Where do we need to act?”
↻ You check it
Alerts
Automated triggers that fire the moment something breaks — a CPL spike, a conversion drop, a dead data connection.
“What needs attention right now?”
↙ It finds you
When you separate these three layers, each one does its job better. The client report stays clean because operational detail lives in the board. The board stays useful because one-off emergencies are handled by alerts. And alerts don’t overwhelm you because they only fire when something actually needs attention.
Here’s how to set up each layer in Swydo.
Layer 1 — Build a Lead Gen KPI Report for Clients
The goal: a single report that answers your client’s core question—“are our leads turning into revenue?”—without burying them in data they don’t need. If you’re not sure where to start, our guide on what to include in a KPI report covers the principles. But for lead gen specifically, here’s the setup:
Here’s how to set it up:
1. Open Reports → +Create Report → select the client → pick a template from the Template Gallery. Swydo has 29+ presets across PPC, SEO, social, and analytics—but for lead gen, start with a blank report so you control the KPI hierarchy.
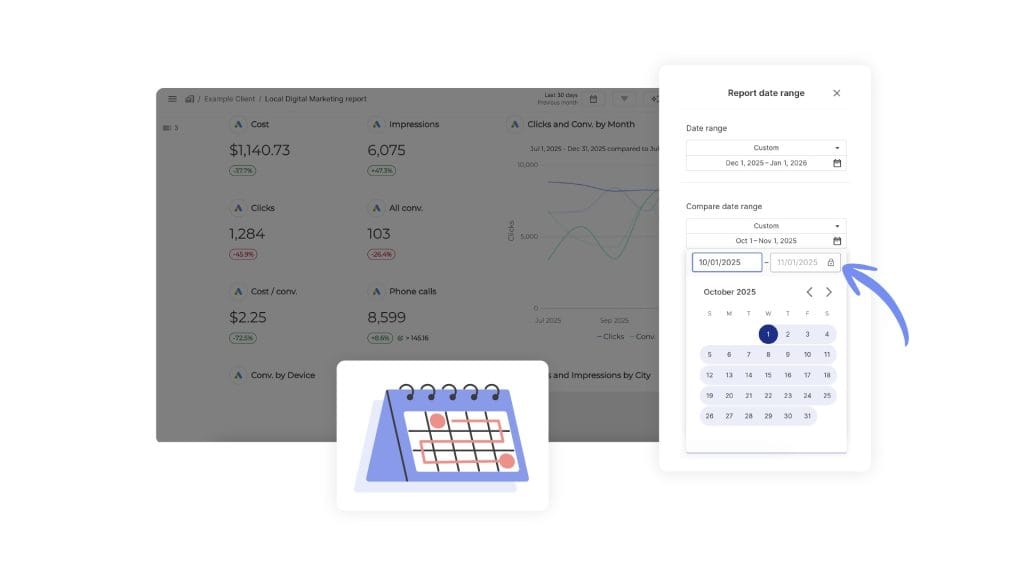
2. Add a KPI Scorecard section at the top. Drag in these widgets: Total Leads, Cost Per Lead, MQL-to-SQL Conversion Rate, and Lead Velocity Rate (month-over-month). Set the comparison period to prior month. The client sees exactly four numbers—red or green—before scrolling.
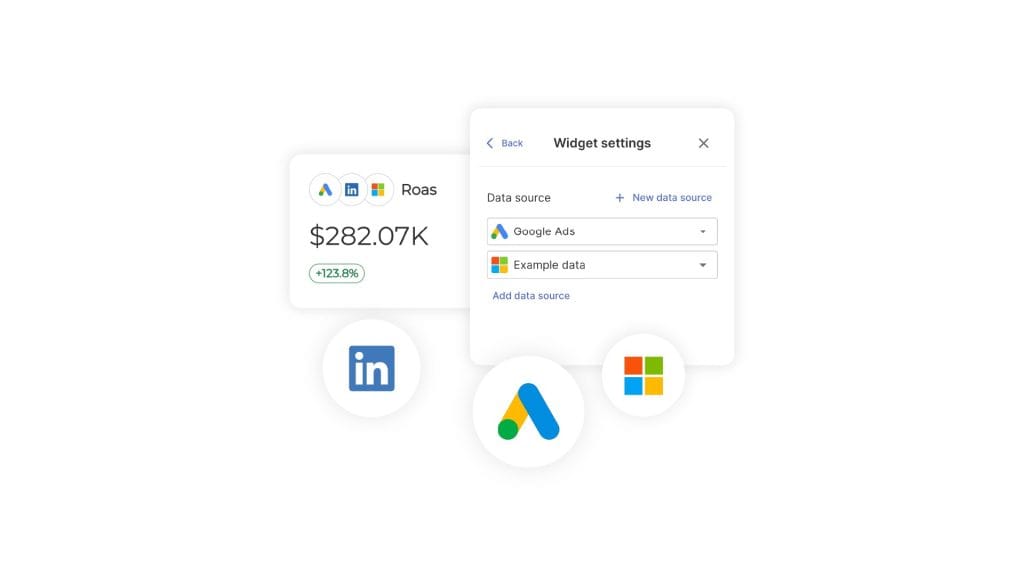
3. Add a Combined Data Sources widget to show cross-channel CPL. This is where it gets useful. Data blending across platforms is usually a spreadsheet job, but in one Swydo widget you can blend Google Ads + Meta + LinkedIn Ads + Microsoft Ads data to see total cost, total conversions, and blended CPL side by side. Swydo supports up to 5 ad platforms in a single widget.
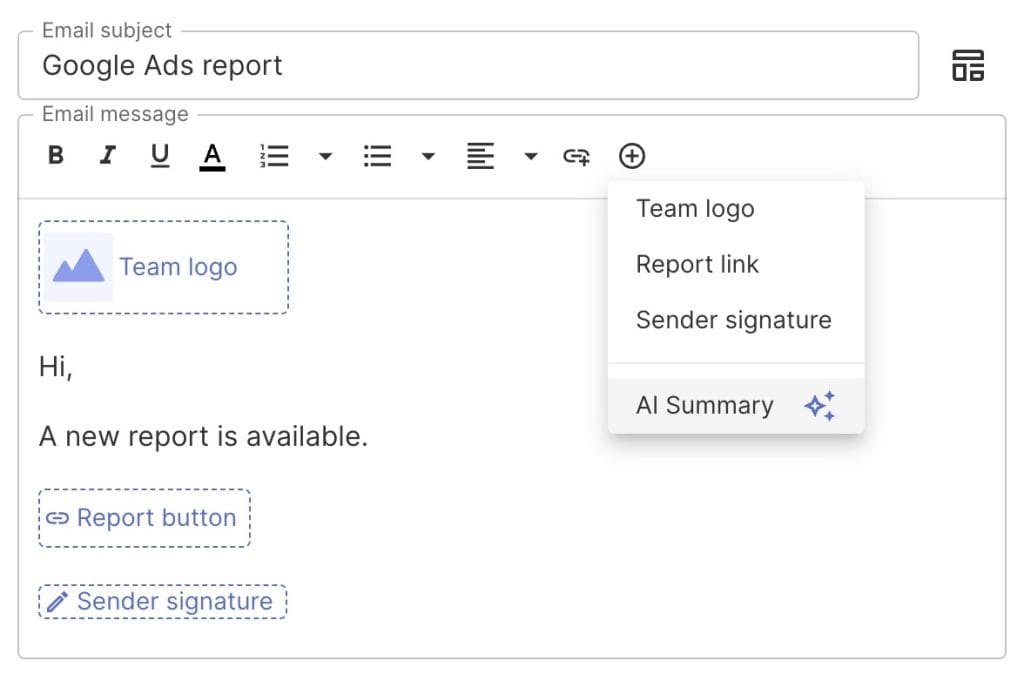
4. Add a Swydo AI summary block. Go to the email editor for scheduled delivery and drag in the AI Summary widget. Swydo AI reads the report data and generates a plain-English summary—wins, issues, and recommendations—that gets inserted at the top of the scheduled email. It’s essentially an automated executive summary that your client reads in their inbox before they even open the report.
5. Schedule delivery. Reports → Schedule → set frequency (monthly for most lead gen clients) → add recipients. Swydo tracks open rates and click rates in the Send Log, so you can see whether the client actually opened the report—and follow up if they didn’t.
6. Save as a Report Template. Once you’ve built this for one client, save it as a linkable master template. There’s a reason marketing report templates save agencies so much time—when you onboard the next client, connect their data sources and the report structure populates automatically. Swydo calls this the One-Build-Many-Sends approach. One template powers reports across 10, 50, or 200 clients. It also makes client onboarding dramatically faster because reporting is ready within minutes of connecting a data source.
| SidenoteIf you want to send reports from your own domain (reports.youragency.com instead of a Swydo URL), you can set up a custom domain in Account Settings. It’s a small detail that makes a real difference in how professional the delivery looks. |
| → Try itWant to test this on your own data? You can set up a Swydo trial in about two minutes—no credit card. The trial includes 10 data sources, which covers most agencies’ first 2–3 clients. → Start your 14-day free trial |
Layer 2 — Set Up an Internal Monitoring Board for Your Team
Client reports show the highlights. Boards show everything.
A Monitoring Board is an internal dashboard you build per client (or across clients) that tracks the full KPI stack—including metrics too detailed for a client report. Pipeline velocity by channel, CPL trends over 90 days, lead response time, win rates by source. Your account managers check these weekly. The key is choosing the right data visualization for each metric so patterns are obvious at a glance.
Here’s how to set one up:
- Open Monitoring → Boards → +New Board. Select the client and connect relevant data sources.
- Add widgets for your Tier 2 and Tier 3 KPIs—CTR by channel, landing page conversion rates, email engagement, sales cycle length. These are the metrics you check weekly but wouldn’t put on page one of a client report.
- Use Present mode for team standups. Hit the “Present” button and the board goes full-screen—perfect for Monday morning account reviews. You can also export it as a scrollable PDF if the team prefers async check-ins.
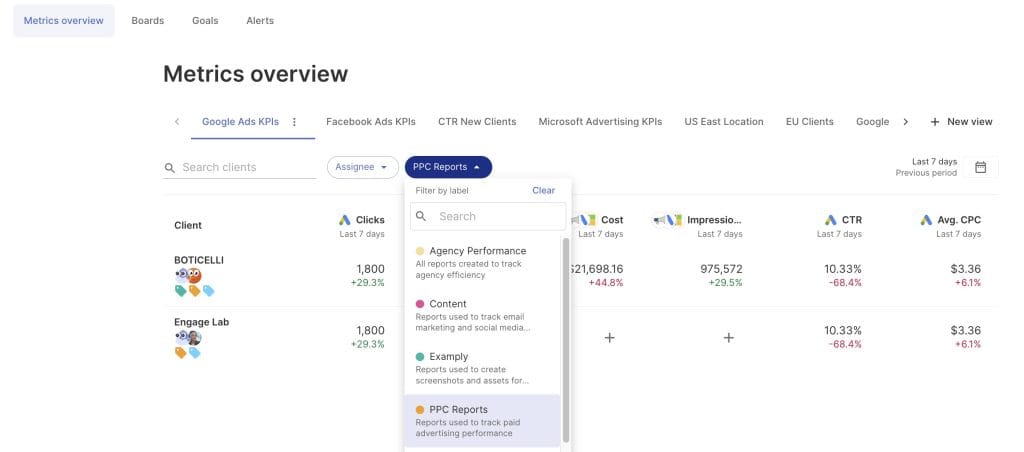
For agencies with 20+ clients, the Metrics Overview screen is a faster alternative. It shows up to 6 KPIs across all clients in a single view—so you can spot which accounts need attention without opening each board individually. Swydo includes 8+ ready-made templates (CPL overview, conversion overview, spend overview), or you can create unlimited custom views.
Layer 3 — Set Up Alerts So Problems Find You
Reports and boards require you to look. Alerts don’t. They fire the moment a KPI crosses your threshold.
Spot a CPL spike before your client’s finance team does. Get notified when an MQL-to-SQL rate drops below 10%. Know within hours—not weeks—if a Google Ads connection breaks.
Here’s how to set them up:
- Open Monitoring → Alerts → +New Alert.
- Pick the client and data source. Select the metric (CPL, conversions, spend, CTR—anything available from the connected platform).
- Set the trigger. You can configure alerts to fire based on 1-day, 7-day, 30-day, or 90-day periods. For CPL monitoring, a 7-day trigger catches trends without overreacting to daily noise. For spend caps, use a 1-day trigger.
- Choose your notification channel. Alerts go to email by default, and you can also push them to a Slack channel if your team lives there. Each alert keeps a color-coded history so you can see at a glance whether it’s been firing consistently or was a one-off blip.
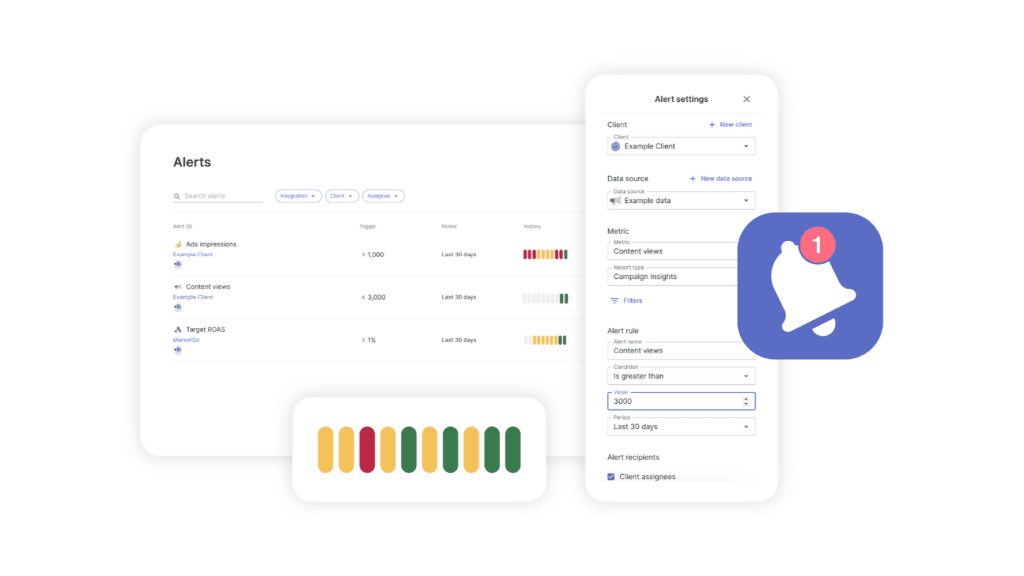
| 📷 SCREENSHOTAnnotated screenshot of Swydo Alert configuration screen showing metric selector, trigger period dropdown (1/7/30/90 days), and threshold input field; red-box callout on the “Slack notification” toggle. |
One thing worth mentioning: Swydo monitors data connection health daily and sends a red-dot alert plus an email the moment a token expires or a connection breaks. This is separate from your KPI alerts—it’s automatic, always on, and catches the kind of silent data failure that would otherwise corrupt every report downstream.
| Sidenote If you run seasonal campaigns, you can pause specific alerts on quiet days (weekends, holidays) so they don’t fire on expected dips. Pause individual alerts rather than deleting and recreating them. |
How to Set KPI Targets Your Clients Can Actually Track
Benchmarks tell you what “good” looks like for an industry. Goals tell you what “good” looks like for a specific client, right now, with their budget and their market. If you’re not sure how to structure these, our guide to goal setting frameworks covers the main models agencies use.
Most agencies set goals informally—a target CPL mentioned in a kickoff call, a conversion rate discussed in passing. Then nobody tracks whether they’re on pace until the quarterly review, when it’s too late to course-correct.
Swydo’s Goals feature automates this. Here’s how to set it up:
- Open Monitoring → Goals → +New Goal. Select the client and metric.
- Set the target value and the time period. For lead gen, a monthly MQL target or a CPL ceiling are the most common starting points.
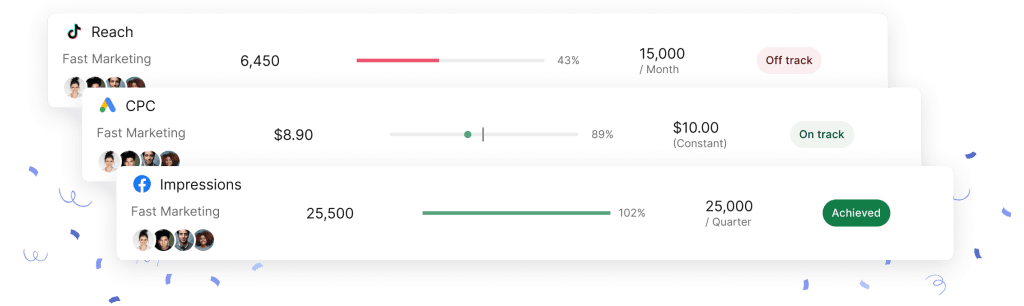
- Swydo tracks pacing automatically. Each goal shows as On Track (green), Off Track (yellow), or Achieved (blue), with a Recent Periods Overview so you can see performance over the last several months at a glance.
- Turn on Goal Notifications. When a goal goes off track, you get an email—before the client notices.
You can also copy goals between clients and pause them during off-seasons, which saves setup time when you’re managing 20–50 accounts.
5 Mistakes That Quietly Wreck Lead Gen Measurement
KPIs are only as good as the system behind them. These are the errors we see most often.
1. Too many KPIs on the client report. When everything is a KPI, nothing is. Keep client reports to 5–7 core metrics. Put the rest on your internal board.
2. Marketing and sales define “qualified” differently. Marketing celebrates 500 MQLs. Sales says 10 were real. This is a definition problem, not a performance problem. Fix it with a shared SLA before you build any dashboard. Only 11% of organizations have an effective lead management SLA.
3. Chasing low CPL without watching quality. A $50 lead at 10% qualification = $500 per qualified lead. A $100 lead at 50% qualification = $200 per qualified lead. The “cheap” lead costs 2.5× more. Track Cost Per Qualified Lead alongside CPL in every report.
4. Pulling the plug too early. If the sales cycle averages 90 days but you judge campaigns at 30 days, you’re cutting programs that haven’t had time to work. Use LVR as a leading indicator while the lagging indicators catch up.
5. No visibility past the handoff. Many agencies track top-of-funnel well but have zero insight into what happens after the lead enters the client’s sales pipeline. Without closed-loop reporting—connecting marketing touches to actual revenue—you can’t prove ROI. Pair this with the right marketing attribution models and UTM parameters so every touchpoint has a traceable source. Negotiate CRM access during onboarding—or at minimum, connect the CRM to your reporting tool.
In Swydo, the HubSpot integration gives you closed-loop visibility on contacts, deals, and pipeline—so you can track leads from first click to closed deal in one report. Swydo’s HubSpot integration makes this possible out of the box.
Lead Generation KPIs FAQ
Direct, no-fluff answers to the questions marketers and agencies search most about measuring lead gen
Lead generation KPIs are measurable values that show whether your marketing is producing leads that turn into revenue — not just clicks, opens, or raw lead volume. Each one ties to a business goal, has a target, and prompts a decision when it moves.
The quickest test of a real KPI: if this number changed tomorrow, would you do anything differently? If yes, it belongs on the report. If no, it’s just a metric.
A metric is any data point you can measure, such as page views, impressions, or email opens. A KPI is a metric tied to a specific goal and target that drives a decision when it changes — so every KPI is a metric, but not every metric is a KPI.
The distinction matters because tracking everything buries the few numbers that actually tell you whether the business is moving.
A vanity metric is a number that looks impressive but doesn’t connect to revenue or guide a decision — total followers, page views, and raw lead count are common examples. It can make a report feel successful while hiding whether anything is actually working.
The fix is to pair every big number with an outcome: raw leads with conversion rate, impressions with cost per qualified lead.
An MQL (Marketing Qualified Lead) is a lead that has shown enough interest — downloads, repeat visits, form fills — for marketing to nurture it. An SQL (Sales Qualified Lead) is a lead that sales has vetted and accepted as ready for a direct sales conversation.
The handoff between them is where most funnels leak, because marketing and sales often define “qualified” differently. A shared, written definition (an SLA) keeps both teams measuring the same thing.
You measure lead generation success by how leads move toward revenue, not by how many you collect. The clearest signals are conversion rate at each funnel stage, cost per qualified lead, MQL-to-SQL rate, and pipeline generated over time.
A program producing thousands of cheap, low-quality leads is failing; one producing fewer leads that consistently close is winning. Always judge lead gen by what reaches the bottom of the funnel.
The most important lead generation KPIs are visitor-to-lead conversion rate, cost per lead, cost per qualified lead, MQL-to-SQL conversion rate, lead velocity rate, LTV:CAC ratio, and pipeline velocity. Together they show whether you’re attracting the right people, qualifying them efficiently, and turning them into profitable customers.
You don’t need all of them for every client — pick the 5 to 7 that match that client’s goals. More than that and the signal gets lost.
Pipeline velocity is how much revenue moves through your pipeline per day. You calculate it as (open opportunities × average deal size × win rate) ÷ sales cycle length in days.
It’s the single most useful KPI for many teams because it combines four levers into one number. Improve any of them — more opportunities, bigger deals, a higher win rate, or a shorter cycle — and velocity rises.
Lead velocity rate (LVR) measures the month-over-month growth in your qualified leads. The formula is (qualified leads this month – qualified leads last month) ÷ qualified leads last month, shown as a percentage.
It’s a leading indicator — steady LVR growth predicts revenue 12 to 18 months out. If it’s flat, no bottom-of-funnel tweak will fix the pipeline.
You should respond to a new lead as fast as possible — ideally within five minutes. Responding in five minutes can make a lead roughly 21× more likely to qualify than waiting 30 minutes.
Yet the average B2B response time is around 47 hours. Closing that gap is one of the cheapest ways to lift conversion without spending more on ads.
Yes — if you capture leads through a chatbot, track Chatbot Qualified Lead Rate (qualified leads ÷ total chatbot conversations) as its own KPI. It shows whether the bot is producing real prospects or just chatter.
Chatbots are now common in B2B and many teams report more qualified leads from them, so the metric deserves its own line rather than being buried in general web stats.
A good visitor-to-lead conversion rate is around 2.9% as an all-industry median, but it varies widely by field — legal pages convert near 7%, healthcare around 4%, and SaaS often 1–3%. Beating your own industry’s median is the real goal.
Channel matters too: organic-search visitors convert to leads at roughly 2 to 3 times the rate of paid traffic, which is part of why SEO leads are so valuable.
A good MQL-to-SQL conversion rate is roughly 15%, with most teams falling between 12% and 21%. The source matters a lot — SEO-sourced leads can convert to SQLs at around 50%, far above paid search.
It’s the biggest bottleneck in most funnels, so it pays to focus there: a 5-point gain can lift revenue by double digits with no extra ad spend.
There’s no single good cost per lead — it ranges from under $30 on some paid social to over $800 for trade shows. Here’s roughly where the major channels land:
| Channel | Avg CPL | Notes |
|---|---|---|
| SEO / Organic | ~$31 | Lowest sustained CPL, strongest ROI |
| Facebook Lead Ads | $27.66 | Cheapest paid — watch quality |
| Email Marketing | ~$53 | $36–$45 ROI per $1 spent |
| Google Ads (Search) | $70.11 | Highest buyer intent |
| LinkedIn Ads | $100–$110 | ~80% of B2B social leads |
| Trade Shows | $800+ | Priciest — but ~40% close rate |
A low CPL means little on its own, though. A cheap lead that rarely qualifies can cost more than an expensive one that usually does, so always read CPL next to cost per qualified lead.
Cost per qualified lead is what you pay for each sales-ready lead, calculated as cost per lead ÷ qualification rate. It reflects quality, not just volume, which makes it the truer efficiency measure.
The math is striking: a $50 lead that qualifies 10% of the time costs $500 each, while a $100 lead that qualifies 50% of the time costs $200. The “cheap” lead is 2.5× more expensive where it counts.
A good LTV:CAC ratio is 3:1 — a customer is worth three times what it costs to acquire them. Below 1:1, you lose money on every customer; above 5:1, you’re probably underinvesting in growth.
Unlike campaign-level ROAS, LTV:CAC measures the entire customer relationship, so it’s the clearest read on whether acquisition is sustainable.
Lead generation ROI is (revenue generated – cost to generate it) ÷ cost, shown as a percentage. The formula is easy; the hard part is tying closed revenue back to the marketing that created it.
That’s what closed-loop reporting solves — without it you can prove activity, not profit. For reference, SEO tends to deliver the strongest channel ROI by a wide margin.
Track 5 to 7 core KPIs on the client-facing report, with another 10 to 15 supporting metrics on an internal dashboard and 3 to 5 automated alerts. The client sees a focused picture while the detail stays behind the scenes.
The rule of thumb: when everything is a KPI, nothing is. A few well-chosen numbers communicate more than a wall of charts.
Report to clients monthly for most accounts, backed by a live dashboard they can check any time. High-touch clients benefit from a short weekly summary and a full strategic review each quarter.
Match the cadence to the sales cycle — judging a 90-day cycle on 30-day results leads to cutting campaigns before they’ve had time to work.
A report is a polished, point-in-time summary made for someone else to read, usually a client and usually on a schedule. A dashboard is a live, always-on view for your own team to spot what needs attention.
They answer different questions: a report answers “is this working?” and a dashboard answers “where do we act right now?” Mixing them buries important signals in PDFs nobody reads closely.
Closed-loop reporting connects each marketing touch to the revenue it eventually produces, by linking marketing data back to the CRM and the closed deal. It closes the gap between a first click and a signed contract.
Without it, you can prove activity but not profit — so it’s what makes ROI real. Securing CRM access and using proper attribution and UTM tracking during onboarding is what makes it possible.
The most common reporting mistakes are tracking too many KPIs, letting marketing and sales define “qualified” differently, chasing a low cost per lead while ignoring quality, judging campaigns before the sales cycle finishes, and having no visibility past the lead handoff.
The most damaging is the last one — without a closed-loop view of what happens after a lead reaches sales, you can’t prove ROI.
What to Do Next
You don’t need to overhaul your entire reporting stack this week. Start with three actions:
- First, pick 5–7 KPIs from this guide for your most important client. Use the industry benchmark table to set realistic targets.
- Second, separate your reporting into the Three-Layer Reporting Stack: client reports, internal boards, and automated alerts. Most agencies mash all three together. Separating them makes each one dramatically more useful.
- Third, set up at least one alert for each client—a CPL threshold or a conversion rate floor—so you catch problems before the client brings them to you.
If you want to see this in action on your own client data, the 14-day Swydo trial doesn’t require a credit card and includes 10 data sources—enough to test it on your top 2–3 clients.
Track the right lead generation KPIs and prove ROI to your clients today.
Start Your Free Trial Today