
Looker Studio turns raw data into interactive dashboards, which makes it a go-to tool for marketing agencies. But no reporting tool is perfect, and Looker Studio is no exception. Slow load times, data blending issues, and missing values can turn a simple report into a frustrating mess.
This guide lays it all out – we pinpoint the most common problems you’re likely to run into and what to do when they happen. You’ll find clear, practical fixes for Looker Studio’s biggest headaches, so you can focus on building great reports instead of wasting hours on troubleshooting forums.
Key Features of Looker Studio
Looker Studio (formerly Google Data Studio) allows marketers to track key metrics and make informed decisions to boost campaign success.
The platform offers a large range of features, which can overwhelm new users. Below are the core Looker Studio features all users should know.
1. Intuitive Web Interface
Looker Studio’s web-based report editor makes building eye-pleasing dashboards easy and efficient. The drag-and-drop interface lets users add charts, tables, and filters onto a snap-to-grid canvas.
2. Pre-Built Report Templates
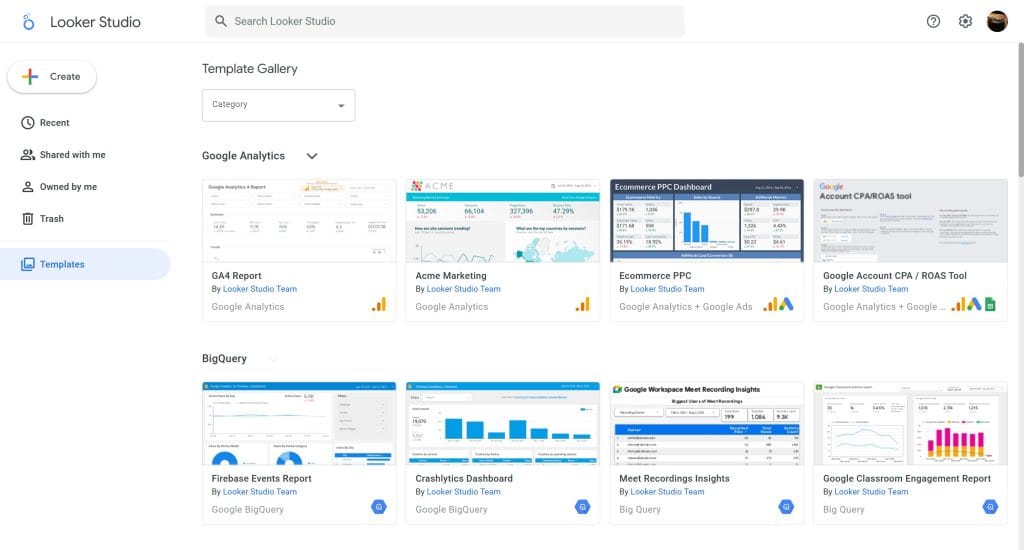
Looker Studio provides a gallery of pre-built templates to save agencies time on report creation. Users can select from Google’s templates or create custom layouts.
Some easy go-to templates are also available under the Templates tab on the right-hand sidebar, once you sign in to your Looker Studio account.
3. Data Connectivity
Looker Studio supports over 1,000 data sources through pre-built connectors, including Google Analytics, Google Ads, and third-party platforms. These connectors are basically pipelines that link data to reports, which eliminates manual data entry and streamlines reporting.
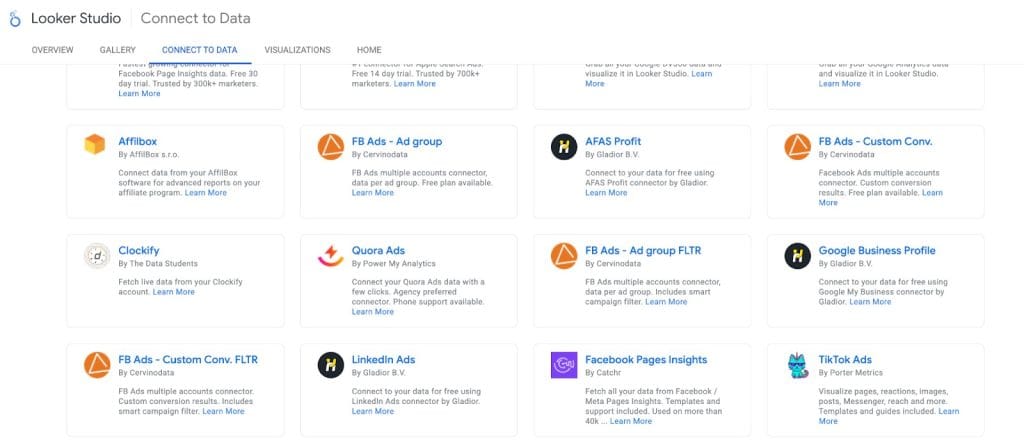
Just a heads up – only a handful of data sources (mainly within Google’s ecosystem) are free. If you need a source that’s not directly affiliated with Google, get ready to pay for a third-party data connector – from $29 to several thousand dollars per month.
4. Customizable Visualizations
Looker Studio offers a variety of chart types, including:
- Line charts
- Bar graphs
- Pie charts
- Scatter plots
- Heat maps
Style your reports with custom fonts, colors, gridlines, and legends to match your client’s brand image.
Looker Studio Limitations
Despite its powerful features, Looker Studio has key limitations that can hinder agencies’ ability to creat and manage reports efficiently. Below are the most common problems users run into and how to solve them.
#1 Data Blending Limitations
Looker Studio’s data blending feature lets you merge multiple datasets into a single view – but it comes with drawbacks that can disrupt your reporting process.
Limited Number of Data Sources
Looker Studio restricts data blending to five sources per dataset. For agencies managing multi-channel campaigns, the limit forces less-than-ideal tradeoffs or hacks.
Example Scenario:
A digital agency may want to blend data from:
- Google Ads (PPC performance)
- Facebook Ads (social media campaigns)
- Google Analytics (website traffic)
- HubSpot (lead tracking)
- Shopify (conversion insights)
Hit the five-source ceiling? You’ll need to cut vital platforms or split analysis across multiple reports, which makes it harder to give clients an overall performance picture.
Quick Fix: Pre-Blend with Google Sheets
Bypass the five-source limit with this workaround:
- Create a Google Sheet with separate tabs for each data
- Structure the sheet with consistent date formats and column labels.
- In Looker Studio, connect the dataset by selecting Add Data → Google Sheets.
- Use the unified dataset to build dashboards.
Learn how to integrate Google Sheets to Looker Studio.
No Cross-Report Data Reuse
Agencies cannot reuse blended datasets across multiple reports. When different teams need similar blended data for their dashboards, they must recreate the entire blended dataset from scratch – wasting hours doing the same work.
Best Solution: Create a master dataset. Store your blended data in BigQuery or Google Sheets, then import as a single source:
- Standardize your metrics, data formats, and calculations in one central location.
- Import this master dataset as a single data source in Looker Studio.
- Connect all your reports to this same dataset.
- Build consistent reports from this pre-blended foundation.
Handling Missing Data in Blended Sources
Looker Studio provides no protection against missing values in blended datasets, which can lead to inaccurate performance reporting. Missing data, such as nulls or unknowns, can arise from various sources, including:
- Incomplete data entry by team members
- System errors during data collection
- Data-formatting differences across platforms
You must manually hunt down and clean these missing values – a slow, error-prone process that eats hours of valuable time. And if you miss them? Your reports could mislead clients and cause them to lose trust in your agency.
Quick Fixes for Missing Data:
- Auto-repair values with Google Sheets formulas like IFERROR and COALESCE before importing to Looker Studio.
- to automatically replace missing values before importing data into Looker Studio.
Filter out incomplete records using Looker Studio’s Data Control feature. - Pre-clean your data with third-party tools or scripts like OpenRefine or Trifacta.
Learn more about client reporting with Google Sheets.
Performance Issues with Blended Data
Adding more data sources to a blend can result in dramatic slowdowns in Looker Studio.
Looker Studio users complain that dashboards with multiple blended data sources load slowly may freeze during use. This slowdown frustrates users and forces agencies to make an impossible choice: comprehensive data or usable reports?
Performance problems can ultimately limit the depth of analysis. Teams may trade inclusive data for ease of use, which means clients get less in-depth insights.
Quick Fixes for Performance Issues:
- Ruthlessly eliminate unnecessary fields and metrics
- Remove unnecessary fields and metrics.
- Pre-aggregate data (use monthly instead of daily data where possible)
- Move data blending work outside Looker Studio entirely.
- Upgrade to BigQuery to handle large datasets.
#2 User Interface and Experience Roadblocks
Looker Studio markets itself as user-friendly, but real use shows its user interface isn’t the easiest for client reporting.
Limited Custom Options
Looker Studio provides basic formatting options for dashboards and visualizations. But its lack of advanced customization features may disappoint agencies with demanding clients.
Marketing agencies often need to tailor reports to display client branding or unique visuals. Looker Studio’s modest options for custom colors, fonts, and layouts make it a challenge to create truly professional, client-branded dashboards.
Quick Fixes for Customization Limits:
- Get the most from existing options by accessing the Style tab in the left sidebar for each widget.
- Add client branding by inserting logos with the image widget.
- Consider alternatives that offer full white-labeling capabilities.
Lagging Interface
Looker Studio’s interface can slowdown, freeze, or stutter when tasked with multi-channel reports or complex calculations. For agencies juggling data from dozens of campaigns or platforms, this is more than annoying – it can disrupt or shutdown workflows. What’s worse, data sources may disconnect entirely, meaning you’ll have to restart from scratch.
Quick Fixes for Interface Lag:
- Apply filters to fetch only the data strictly needed for daily reporting.
- Combine data and do calculations outside Looker Studio with Excel or Google Sheets.
- Sum up data points instead of showing raw values when possible.
- Remove unneeded widgets that drain processing power.
Complex Workflow Even for Advanced Users
Looker Studio requires a lot of manual steps for setting up charts and blending data – tedious even for power users. Marketing agencies often need to create detailed dashboards that combine data from various sources, such as SEO tools, PPC platforms, and social media analytics. The platform lacks the automation features of advanced modern business intelligence tools. Teams have to recreate the same parts from scratch for multiple reports.
Bottom line: Looker Studio’s workflow can steal hours from a marketer’s day – all for grunt work that other tools automate.
Quick Fixes for Workflow Inefficiency:
- Create reusable dashboard templates, charts, and settings to speed up new client reports.
- Save custom widgets to speed up custom feature creation.
- Use third-party automation tools to reduce manual work.
#3 Data Analysis Challenges
Let’s get one thing straight: Looker Studio is primarily a visualization tool. Even with newly introduced features for improved data analysis, it still trails reporting platforms made for marketing agencies.
Surface-Level Analytics
Looker Studio is great for basic reporting. But for advanced calculations or forecasting, agencies usually need another tool to pick up the slack.
Quick Fix for Limited Analytics:
Couple Looker Studio with advanced data processing platforms for complex analyses and predictive modeling:
- Choose a platform like BigQuery, Amazon Redshift, or Snowflake for your needs and budget.
- Connect your data sources to the chosen platform.
- Set up the platform and run calculations directly within it.
- Import analyzed data to Looker Studio with its native data connectors.
- Present these deeper insights in client-facing dashboards.
Lack of Real-Time Analysis
Real-time insights help to keep marketing agencies on top of their game. They allow them to closely watch and adjust campaigns based on the freshest metrics. A big drawback of Looker Studio is that it doesn’t natively support real-time dashboard updates. For campaigns where every minute counts, this data delay can cost clients thousands in wasted ad spend before problems show in your reports. As a result, agencies may ultimately lose momentum in highly competitive markets.
Looker Studio Data Refresh Limits:
- Looker Studio Free: Auto-refreshes every 15 minutes (manual refreshes allowed).
- Looker Studio Pro: Auto-refreshes as frequently as every 5 minutes (for supported connectors, like BigQuery).
Learn the difference between Looker Studio free vs pro.
Note: Updates for third-party connectors as well as data sources themselves vary. Don’t expect them all to refresh on the same schedule.
Quick Fixes for Refresh Limitations:
First, optimize your current settings:
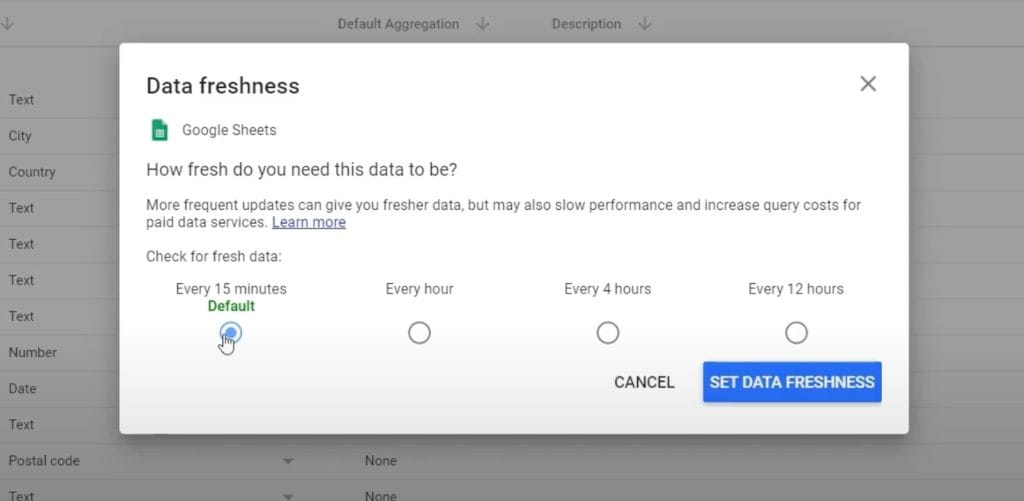
- Select the data source on your report.
- Open Data freshness settings.
- Choose the fastest refresh option available.
- Set your refresh interval to the minimum allowed (15 or 5 minutes).
For more frequent updates:
- Manually refresh – a good idea before client calls.
- Pull data to Google Sheets more often with Google Apps Script.
- Use BigQuery’s scheduled queries (available in free tier) for faster refreshes.
- Consider alternatives with built-in real-time reporting.
Year-Over-Year Comparisons Are Complicated
When setting the comparison period, Looker Studio defaults to comparing against the same dates the previous year. This becomes problematic because every year, weekdays differ. For example, 2025-11-27 (a Thursday) would compare against 2024-11-27 (a Wednesday). For businesses where weekdays matter—some companies sell extra well on Mondays and have their worst day on Sundays—comparing this year’s Monday to last year’s Sunday produces misleading insights.
The same issue applies to weekly data: this year’s week 47 (Monday to Sunday) would compare against last year’s same dates (Sunday to Saturday), skewing the analysis.
Quick Fixes for YoY Comparison Issues:
- Create calculated fields that format dates by week number and weekday to ensure proper alignment
- Use advanced comparison periods with custom date formulas
- Pre-calculate YoY metrics in Google Sheets or BigQuery before importing
- For blended data, create separate calculated fields for ‘this year’ and ‘last year’ metrics using CASE WHEN statements
#4 Performance Bottlenecks
Performance issues are common when working with Looker Studio, especially when handling the data volumes typical in marketing agencies.
Slow Loading Times
Dashboards with multiple data sources or complex queries often slow down What’s worse, it’s more prone to happen at times performance matters most – like when presenting to clients. These delays stem from Looker Studio’s inherent architecture limitations rather than your network speed. The issue is mainly due to Looker Studio’s infrastructure, but network latency or resource limits can worsen it.
Quick Fixes for Slow Loading:
Optimize data handling and dashboard design:
- Reduce the number of widgets and tables on each page to speed up rendering.
- Organize your dashboard so each tab uses a single data source.
- Are daily data-checks a must? If not, use Looker Studio’s Extract Data connector to create a cached data subset.
More tips on how to speed up Looker Studio.
Slow Loading with Filters and Long Date Ranges
If you request data for more than 1-3 months and apply many filters, you may wait for 10-30 seconds until you see the data. This is particularly problematic for SEO reporting, where historical trend analysis is essential. The combination of multiple filters (by device, query, country) with extended date ranges can bring dashboards to a crawl—or worse, cause them to time out completely.
Quick Fixes for Filter/Date Range Slowdowns:
- Limit queries to 1-month chunks and use parameters for dynamic filtering
- Create separate report pages for different time periods instead of one massive view
- Pre-aggregate filtered data in BigQuery or Google Sheets before connecting
- Use the Extract Data connector to create cached snapshots for commonly-used filter combinations
Crashes When Working With Large Datasets
When they work with larger datasets in Looker Studio, agencies may face an issue that seriously disrupts workflows: frequent crashes and errors. The easiest solution is to avoid importing bigger datasets to reports and dashboards – obviously not ideal. Luckily there are other ways to prevent crashes.
Quick Fixes to Prevent Crashes:
- Combine data at the source level (or your data warehouse) before importing.
- Apply strict filters to include only must-have data points.
- Save your work frequently to prevent complete loss during crashes.
Collaboration Errors
Looker Studio users often complain about errors when multiple users access and edit the same report. Although Looker Studio advertises its collaboration features, experience shows that multi-user real-time report editing can become glitchy to downright chaotic.
Quick Fix for Collaboration Issues:
- It’s not ideal, but try to limit users accessing reports at the same time.
- Implement a check-out system where team members notify others before editing.
- Schedule editing windows during off-peak hours to reduce server strain.
- Create separate working copies for each team member, then merge changes manually.
#5 Data Volume and Row Limits
Looker Studio has limits on data volume that may conflict with the reporting needs of marketing agencies in the real world.
Row Limits
Looker Studio generally supports up to 1 million rows per dataset, but in practice, limits may be much lower depending on the data connector. For example, connectors like SQL Server limit datasets to 150,000 rows – a bit tight for agencies managing lots of campaign data across multiple platforms.
Best solution:
- Combine data directly at the source (e.g., in BigQuery or your database) to lower row count before importing.
- Use time-period or other filters to focus on the most relevant data segments.
- Use Looker’s Extract Data connector to create smaller, cached subsets of your dataset for reporting.
- Divide up your data into a few related reports.
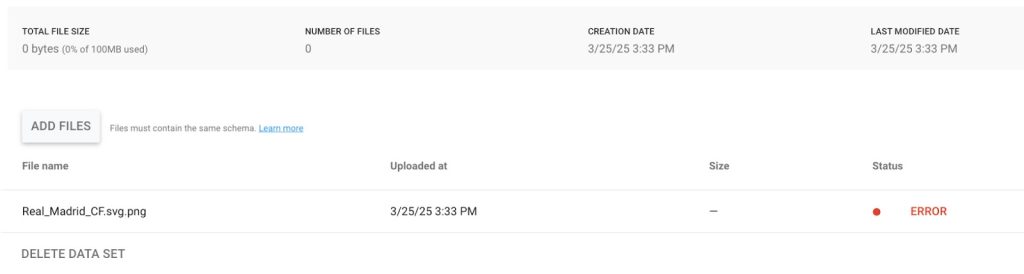
File Size Limitations
When uploading CSVs or other formats directly into Looker Studio, you’ll hit hard size limits: 100MB per dataset and 2GB total storage per user.
For agencies handling lots of campaign data, these limits aren’t hard to exceed within just a few client reports. This means tough choices about which data to keep and which to leave out.
Quick Fixes for File Size Issues:
- Remove unneeded columns before uploading files.
- Move to cloud storage like Google Cloud Storage or BigQuery for larger datasets.
- Remove unused datasets and connections to free up storage space.
#6 Connectivity and API Limits
Agencies often face connectivity issues, like API limitations, when integrating Looker Studio with other tools or dealing with large-scale reporting workflows.
One hidden bottleneck in Looker Studio isn’t the platform itself – it’s the restrictive API quotas for connecting to data sources like Google Analytics 4 and other platforms.
Quota Limits on API Calls
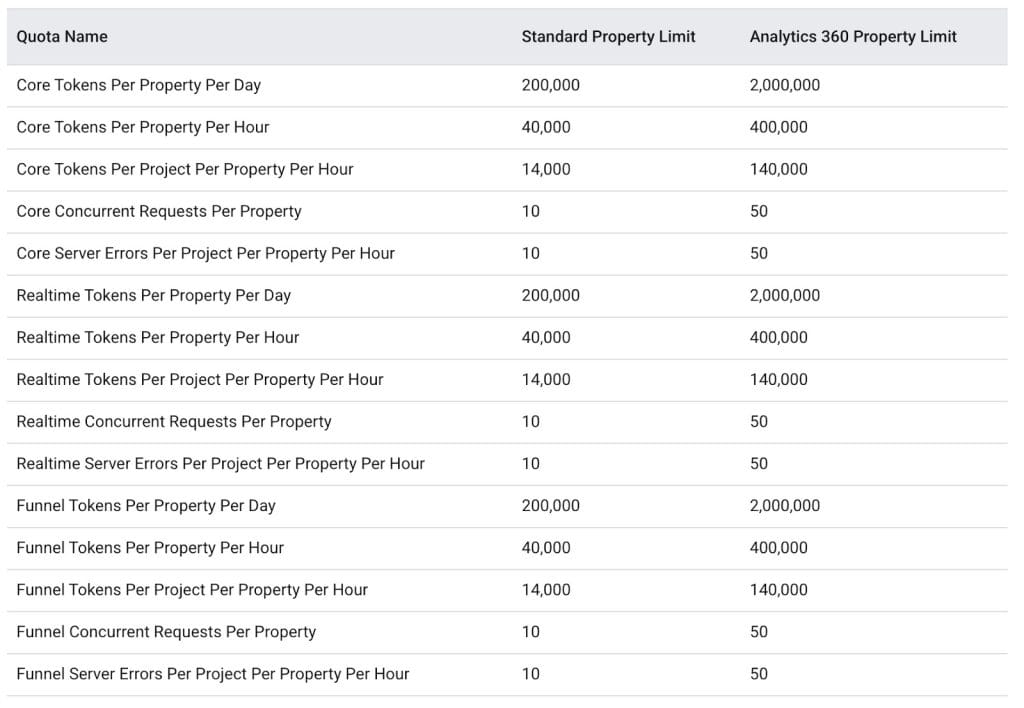
Looker Studio relies on APIs to connect with data sources like Google Analytics 4. These APIs have quotas on hourly and simultaneous usage, and once used up, data refreshes come to a halt. Users really feel it with GA4, which offers significantly lower API quotas than Analytics 360, causing agencies to hit limits rapidly when multiple team members access reports at the same time.
Quick Fixes for API Limitations:
- Create cached snapshots with the Extract Data connector.
- Don’t update all reports at the same time. Spread it out.
- Watch your quota usage and set up alerts when near limits.
- Consider upgrading to Analytics 360 for key reporting needs.
Severe GA4 API Quota Limits
Since the limit for making Concurrent Requests to the GA4 API is only 10 for free properties, the quota can easily be exceeded. A single report page with anything more than 5 charts or scorecards connected to GA4 will hit the concurrent request quota almost immediately for a single viewer, let alone if multiple viewers try to access it at the same time.
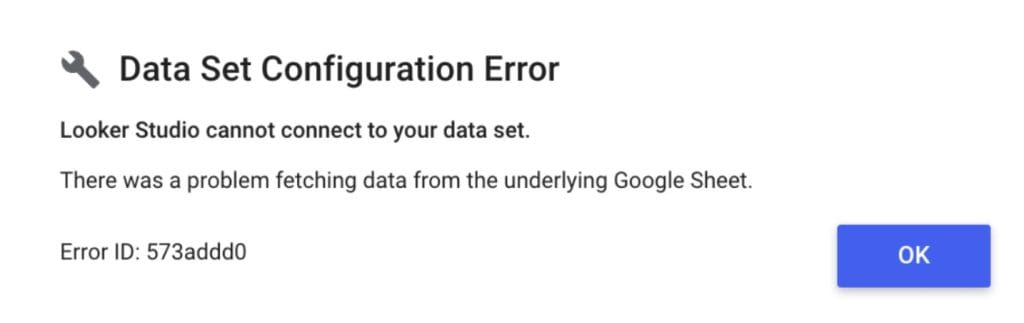
Error messages like “Looker Studio cannot connect to your data set”, “Exhausted concurrent request quota”, and “Data Set Configuration Error” are common when quotas are exceeded. When GA4 quotas are hit, every chart goes dark until the limit resets—sometimes for 10 minutes, sometimes for an entire day.
Quick Fixes for GA4 Quota Issues:
- Reduce the number of charts per page to stay under concurrent request limits
- Use BigQuery export to bypass GA4 API quotas entirely
- Create Extract Data snapshots that don’t consume API calls when viewed
- Stagger report viewing times across team members
- Consider Google Analytics 360 for significantly higher quota limits
Connector Stability
Looker Studio supports a wide range of connectors, but how reliable are they? The truth is, it varies quite a bit. For example, platforms like HubSpot or Mailchimp might frequently disconnect or fail to pull data during peak usage periods – like right before client presentations or during key reporting windows.
Quick Fixes for Connector Issues:
- Test all connectors before adding them to client dashboards
- Keep backup snapshots of important reports with the Extract Data connector.
- Regular disconnect and reconnect data connectors
- Have backup PDFs ready for emergency situations.
#7 Mobile Viewing Issues
The world is becoming increasingly mobile-first world. Unfortunately, Looker Studio’s dashboards are not keeping up. Looker Studio doesn’t function well on mobile screens – where busy executives often need to access them. Reports are often cluttered and difficult to navigate.
Quick Fixes for Mobile Limitations:
- Design primarily for desktop but test on mobile devices.
- Use large font sizes and simple charts for better mobile viewing.
- Use Looker Studio’s mobile preview when building a report.
- Consider mobile viewers like Looker Studio Viewer app.
- Create separate mobile-first versions of critical dashboards.
#8 Known Bugs and Common Issues
Just when you think your Looker Studio report is up and running – here comes an error message. Luckily, power users have found fixes for the most common bugs and issues agencies face in day-to-day reporting flows.
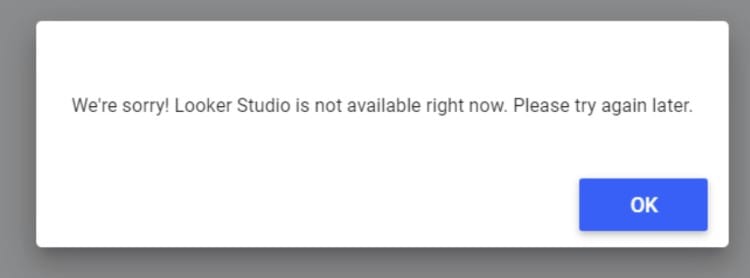
Unresponsive Pages and System Errors
Users sometimes run into unresponsive pages or error messages, like System error or Looker Studio is not available. They are usually due to temporary network glitches or backend issues.
Best solution:
- Close and reopen your browser window.
- Clear browser cache and cookies.
- Switch to a different browser.
- Restart your device as a last resort
Error still there? Check the Google Cloud status page to see if the system is facing any outages.
Access Issues
Many users encounter the frustrating “We are sorry, but you do not have access to Looker Studio” error – even when they certainly should have access. At worst, they can happen during important meetings or work periods, affecting client reviews and team collaboration.
Best solution:
- Ask your agency’s Google Workspace admin to enable Looker Studio for your account.
- Make sure your Google Workspace or Cloud Identity settings include permissions for Looker Studio.
- Create separate service accounts for important reports to avoid permission issues.

The “Bus Factor” and Ownership Transfer
A major structural flaw in Looker Studio is how it handles asset ownership. Reports and data sources are tied to the specific Google account of the creator. If an employee leaves your agency and their Google account is suspended or deleted, every report and data source they created will break. Transferring ownership of data sources is often restricted or requires complex permissions, forcing teams to rebuild dashboards from scratch whenever staffing changes occur.
Quick Fixes for Ownership Issues:
- Always create reports using a generic “master” account (e.g., reports@youragency.com) rather than personal employee accounts
- Share edit access with a backup account immediately upon creation
- Document which account owns which reports and data sources
- Regularly audit ownership and transfer assets before employees leave
Data Connection Issues
Error messages like “Missing data source,” “No data set access,” or “Database connection error” appear regularly in Looker Studio. These issues are due to deleted data sources, broken connectors, or outdated authorizations. They’re frustrating and break your dashboards, but there are solutions.
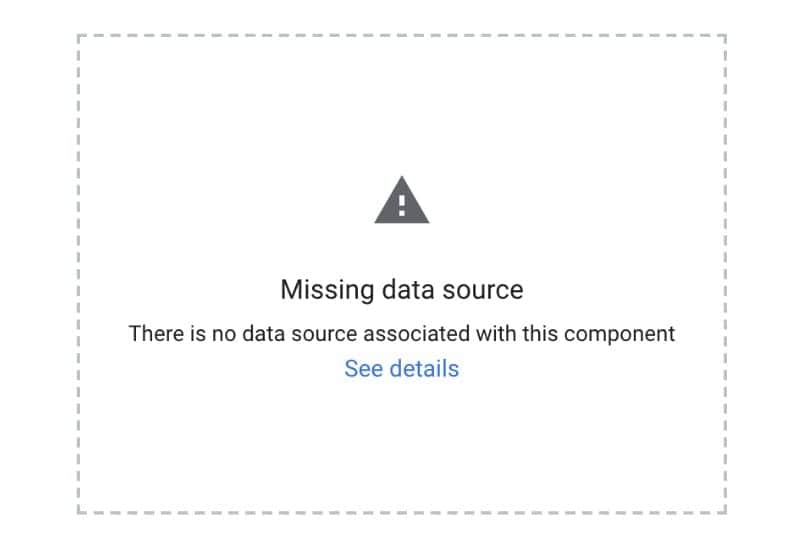
Quick Fixes for Connection Failures:
- Edit broken components and reconnect to valid data sources.
- Refresh data source fields with the refresh button.
- Remove and re-add the data source.
- Revoke Looker Studio’s access to your Google account, then restore it.
- Make sure connector authorizations haven’t expired.
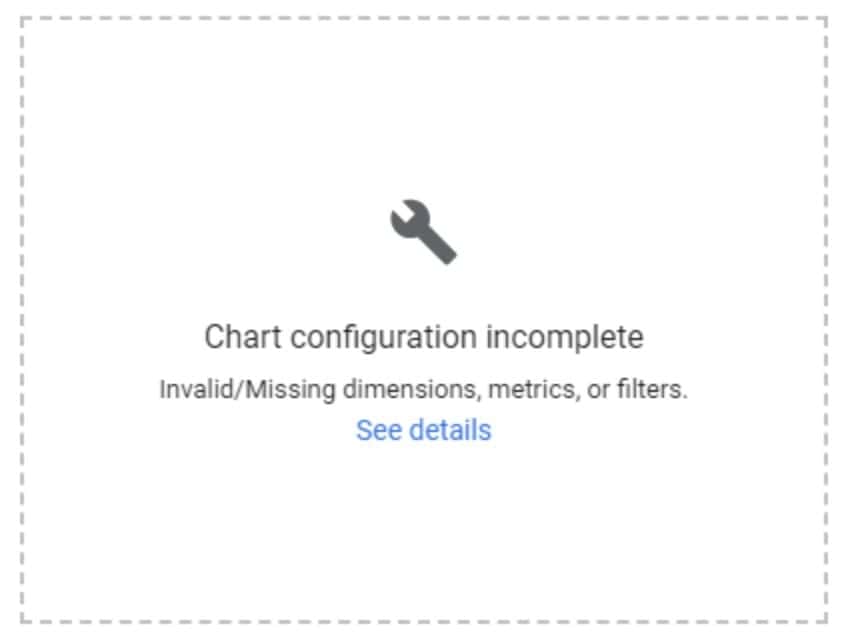
Chart Settings Errors
If you see a Chart configuration incomplete or Invalid combination of metrics and dimensions error, there’s a big chance that you’re using incompatible fields or the calculated fields contain errors.
Quick Fixes for Chart Errors:
- Fix or remove invalid calculated fields in your reports.
- Select different fields that are compatible with your chart type.
- Refresh or reconnect data sources used in the charts.
User Interface Errors
Looker Studio users sometimes face UI issues such as missing elements, broken features, or error messages like Sorry! We can’t save this report right now. These errors are usually due to browser extensions or software versions that are outdated or incompatible. At worst, they can cause total loss of whatever you were working on.
Quick Fixes for UI Problems:
- Update your browser to the latest version.
- Update your operating system.
- Disable all browser extensions and add-ons when using Looker Studio.
- Clear cache and cookies.
- Work in incognito/private mode to avoid extension conflicts.
- Use Chrome exclusively, as it tends to have fewer compatibility issues.
#9 Reporting and Deliverability Issues
For agencies, the job isn’t done until the client sees the report. Unfortunately, Looker Studio’s export and delivery features leave much to be desired.
PDF Export and Pagination Problems
Looker Studio’s native PDF export feature is notoriously buggy. The biggest issue: if you have a table displaying keyword rankings that contains 50 rows, but the visual widget only shows 10 rows at a time (with a scroll bar), the exported PDF will only show the visible 10 rows. It does not automatically span data across multiple pages. This makes it impossible to share complete keyword lists or backlink data via static reports.
Quick Fixes for PDF Export Issues:
- Manually expand table heights to show all rows before exporting (though this ruins dashboard design)
- Direct clients to the live dashboard link instead of sending PDFs
- Use third-party PDF export tools or browser extensions
- Create separate “export-ready” report pages with fully expanded tables
- Export data to Google Sheets first, then create PDF from there
#10 Support and Pricing
Platform limitations and errors are not the only issues that could disrupt reporting workflows in marketing agencies. A lot of users feel that Looker Studio’s support is not as helpful as it should be. They also point to unexpected costs that can add up in real-world use.
Limited Support Options
The Pro version of Looker Studio offers direct customer support. However, free-tier users lack direct access to support and have to deal with technical issues themselves. Free users have access to:
Agencies that can’t solve technical issues in-house typically hire Looker Studio experts or developers to fix data-integration problems or common errors.
Additional Costs
Even though most Looker Studio features are free, fast-growing agencies with dozens of clients may find that free in theory doesn’t mean free in practice. They may feel forced to switch to Pro or buy additional tools for performance reporting.
Third-party integrations
Marketing agencies can use Looker Studio’s free integrations with Google products and various databases. However, when it comes to third-party data connectors, like Facebook Ads, LinkedIn Ads, or CRMs, price points can range from $29/month up to a few thousand dollars, depending on the integration and the database size.
There’s really no way out of it: Looker Studio users who want third-party connectors, will have to pay extra for them – and the costs can climb fast. Alternatively, they can look into other reporting platforms that offer a larger range of integrations with their monthly subscription. For example, Swydo offers over 35 integrations with various platforms, and its subscription starts at just $69.
Conclusion
Looker Studio works well for basic data visualization. But its promise of forever-free, easy reporting shows its cracks in the experiences of real-world users. Its performance bottlenecks and limited features make complex analysis challenging. While fixes and workarounds exist for some issues, they’re often temporary, and the same bugs, glitches, lags, and Looker Studio is not available errors will likely return again.
Choosing the right reporting tool is important for marketing agencies. It has a major impact on the insights they provide, their campaign success, client happiness, and continuing growth. How do you want to invest – In bits and pieces that add up over time, or in a more complete solution made for marketing agencies’ specific reporting needs? Besides Looker Studio, test alternatives like Swydo that offer simple yet powerful data analysis, more built-in data integrations, and reliable support, all in one.
Looker Studio Limitations FAQ
Expert solutions for overcoming Looker Studio’s most frustrating constraints
Looker Studio has several critical limitations that frustrate marketing agencies. These include a 5-source limit for data blending, slow performance with large datasets, restricted customization options for client branding, poor mobile experience, and expensive third-party connectors for non-Google platforms.
While Looker Studio is free and integrates well with Google products, these constraints often force agencies to use workarounds or consider paid alternatives like Swydo, Databox, or Supermetrics that offer better reliability, more integrations, and superior client-facing reporting capabilities.
Looker Studio restricts data blending to a maximum of five sources per blended dataset, which is insufficient for comprehensive marketing reporting across multiple channels and platforms.
The most effective workaround is to use Google Sheets as an intermediary. Create a sheet with separate tabs for each data source, ensuring consistent date formats and column headers across all tabs. In Looker Studio, connect to this single Google Sheet instead of multiple original sources. This method also improves performance by pre-processing the data.
Looker Studio has various row limits depending on the connector—generally up to 1 million rows, but as low as 150,000 for some connectors like SQL Server. These limits are easily reached when reporting on high-volume campaigns.
Pre-aggregate your data before importing it to Looker Studio. Use BigQuery to combine and summarize data, reducing row counts. Apply filters at the data source level to include only necessary time periods. For very large datasets, create separate reports divided by time period or campaign segment.
While Looker Studio is free and integrates well with Google products, its limitations include slow performance, basic customization, and data connection issues. Marketing agencies often need more reliable and comprehensive reporting solutions.
Alternatives include Swydo (starting at $69/month with 30+ built-in integrations), Databox (strong visualization capabilities), and Supermetrics (excellent data connectors but requires separate visualization tool). These paid alternatives offer better reliability, more integrations, and often superior client-facing reporting capabilities than Looker Studio.
Looker Studio reports are designed primarily for desktop viewing and often appear cluttered and difficult to navigate on mobile devices—a significant issue when clients need to check metrics on their phones.
Design mobile-specific reports with fewer, larger visualizations per page. Use responsive text and number cards instead of detailed tables. Preview your report on mobile devices during design using Looker Studio’s mobile preview feature. Consider creating separate mobile-optimized versions of critical dashboards that focus only on the most important KPIs.
Looker Studio’s free version initially appears sufficient, but agencies quickly discover hidden costs and limitations. While basic reporting is free, third-party data connectors for non-Google platforms like Facebook, LinkedIn, or HubSpot can cost $29-$1000+ monthly. Additionally, the free version has slower refresh rates and lower API quotas.
Small agencies with few clients may find Looker Studio adequate, especially if they work primarily with Google products. However, growing agencies supporting dozens of clients across multiple platforms typically find the limitations too restrictive and end up investing in paid alternatives that offer better reliability, customization, and integration capabilities.
Looker Studio dashboards slow down when they contain too many widgets, complex calculations, or multiple data sources. The problem usually isn’t your internet connection—it’s how the dashboard is built.
Fix this by reducing the number of charts per page, organizing tabs by data source, and removing unnecessary metrics. For essential but slow dashboards, use the Extract Data connector to create cached versions that load much faster.
Looker Studio crashes when handling large datasets because it has limits on processing capacity. When this happens, you’re losing valuable work and wasting time.
The simplest fix is to filter your data before it reaches Looker Studio. Pre-aggregate your metrics (use monthly instead of daily data), remove unnecessary dimensions, and apply date range filters at the data source level. For very large datasets, use BigQuery to pre-process your data first.
Data blending in Looker Studio is resource-intensive and often causes freezing, especially when combining 3+ sources. This happens because Looker Studio must process all records from each source, even if you only need a small subset.
Instead of blending directly in Looker Studio, combine your data in Google Sheets or BigQuery first, then import it as a single source. This approach is faster, more reliable, and avoids the 5-source blending limit altogether.
Missing data in Looker Studio reports happens when data sources disconnect, API limits are reached, or fields are incompatible. This problem leads to incomplete metrics and potentially misleading client reports.
First, check your data source connection status. If it’s connected but data is still missing, refresh field definitions. For periodic missing data in GA4 sources, you’re likely hitting API quotas—create an extract connector with a scheduled refresh instead of querying GA4 directly.
Connecting non-Google data sources (like Facebook Ads, LinkedIn, HubSpot) to Looker Studio requires third-party connectors that can cost $29-$1000+ monthly. These connectors often have stability issues, particularly during peak usage times.
For a more cost-effective approach, export your non-Google data to Google Sheets or BigQuery first, then connect that to Looker Studio. While manual, this method avoids recurring connector fees. For fully automated connections, SuperMetrics and Funnel.io are reliable but premium options.
Looker Studio’s free version only refreshes data every 15 minutes at best, with third-party sources potentially updating even less frequently. This delay can be problematic for time-sensitive reporting.
Configure each data source to use the shortest refresh interval available (under Data freshness settings). For real-time data needs, BigQuery’s scheduled queries refresh more frequently. Always manually refresh dashboards before client meetings by clicking the refresh button in the top right corner.
Looker Studio relies on APIs to connect with services like Google Analytics 4, which have usage quotas. When multiple team members access reports simultaneously, these quotas are quickly exhausted, causing reports to stop refreshing.
To prevent this, create cached snapshots with the Extract Data connector that don’t require API calls for viewing. Stagger report update schedules instead of refreshing all at once. For high-traffic reports, consider upgrading to Google Analytics 360 which has significantly higher quotas.
These generic error messages usually indicate temporary issues with your browser or Looker Studio’s servers. They often appear at the worst possible moment—right before client presentations.
Try these quick fixes in order: refresh the page, clear your browser cache and cookies, use incognito/private mode, or switch browsers (Chrome works best with Looker Studio). If problems persist, check Google Cloud Status Dashboard for system-wide outages. Always keep PDF exports of critical reports as backup for presentations.
These errors appear when Looker Studio can’t access the underlying data sources, breaking your dashboards. This typically happens when data connections expire, permissions change, or source files are renamed/moved.
Fix these issues by editing each affected component, reconnecting to valid data sources, and refreshing the data source fields. For persistent problems, remove and re-add the data source completely. If using Google Sheets, ensure proper sharing permissions are set for the Looker Studio service account.
This error appears when your visualization is missing required dimensions/metrics or contains incompatible field combinations. It’s common when working with custom fields or after data source changes.
Check if you’re using the right field types for your chart (e.g., don’t use text fields in line charts). Verify your calculated fields contain no syntax errors. Sometimes, simply removing and re-adding the dimension or metric resolves the issue. As a last resort, recreate the chart from scratch.
“Access denied” or “You do not have access to Looker Studio” errors occur even when you should definitely have access. These permission issues can prevent entire teams from accessing critical reports.
First, verify you’re signed in with the correct Google account. If that’s not the issue, ask your Google Workspace admin to enable Looker Studio for your account. For shared reports, check if the owner has explicitly granted you access. Creating service accounts for important reports can prevent permission problems when team members change.
Frustrated with Looker Studio’s limitations?
Switch to a Tool Built for Agencies