
Google Analytics 4 gives you three attribution models.
Most guides on this topic still walk you through seven.
Marketing attribution is the practice of assigning credit for a conversion across the touchpoints that came before it. An attribution model is the rule that decides how the credit gets split.
First-touch hands everything to the channel that made the introduction. Last-touch hands everything to the channel that closed. Everything else sits somewhere between those two.
All of them are reporting choices rather than measured facts.
That distinction is doing more work now than it used to. Three things changed:
- Four of the seven models most agencies learned on were pulled out of Google’s products in November 2023.
- Buyers research inside AI assistants that strip referrer data before the click ever reaches your analytics.
- The channel that closes a deal has never been less likely to be the channel that caused it.
We build reporting software at Swydo, not an attribution engine. Swydo shows you what the platforms report, side by side, in a form a client will actually read.
Deciding which numbers deserve trust is still your job. This article is about how to do that part well.
The rest sorts out which models still exist, what none of them can see, how to read three signals against each other, and how to put all of it in front of a client without overpromising.
What Is Marketing Attribution?
Marketing attribution assigns credit for a conversion to the touchpoints that preceded it.
A model is the rule that does the assigning. Different rules produce different answers from identical data.
Take one buyer.
She sees a LinkedIn ad in March. Reads two blog posts in April. Asks an AI assistant to compare three vendors in May. Searches your brand name, lands on your pricing page, and books a demo.
Six touchpoints. Here’s what each model does with them:
- First-touch credits LinkedIn with the whole demo.
- Last-touch credits organic search.
- Linear splits it six ways.
- The AI conversation gets nothing under any model, because it never generated a trackable session.
None of those answers is wrong. They answer different questions.
First-touch answers what introduced her. Last-touch answers what she did immediately before converting.
Neither answers what caused the demo. No rule-based model can, because rules describe order rather than cause.
Hold onto that gap. It’s the source of almost every attribution argument an agency has with a client. Attribution is one input into marketing measurement, not the whole of it.
Where the Credit Comes From
How the credit gets split matters less than whether the touchpoint was visible in the first place.
Attribution runs on tagged links, cookies, logged-in identity, and referrer headers.
When any of those go missing, the touchpoint doesn’t get reassigned to a different channel. It disappears. Credit lands wherever the model finds its next observable touch.
Your report still shows a full pie.
The pie is smaller than it looks.
Why Attribution Still Matters When It’s Getting Harder
Attribution is how an agency turns spend decisions into an argument a client can follow. It’s also what tells you when to move budget, which is the only reason to run it at all.
Four things it earns you when the tracking holds up:
- Budget movement with a reason attached. A channel that looks flat under last-touch and strong under first-touch is doing awareness work. That’s a spend argument, not a spreadsheet observation.
- A defensible answer to “what did we get for this.” Clients ask that quarterly. Attribution lets you answer with a number instead of a narrative.
- Early warning on channel decay. A channel losing assisted conversions before it loses last-touch conversions is starting to fail. You see that in a model comparison months before you see it in revenue.
- A shared vocabulary with the client. Once a client understands that first-touch and last-touch tell different stories, most of the awkward reporting conversations get easier.
Sean Kerr, COO and cofounder of Cause Inspired Media, puts the setup cost plainly:
Identifying all the goals in a customer journey and identifying which attribution model should be applied to each is necessary from the beginning. If any of these steps isn’t set in an effective manner, each data point analyzed will push you further away from an effective campaign instead of closer.
He’s describing a compounding error.
Bad attribution isn’t neutral. It moves budget in the wrong direction with confidence, which is worse than moving no budget at all.
An agency that reports last-touch only, then cuts the top-of-funnel channels last-touch undervalues, will watch pipeline dry up two quarters later without knowing why.
The Attribution Models That Still Exist and the Ones That Don’t
GA4 offers three reporting attribution models:
- Data-driven attribution
- Paid and organic last click
- Google paid channels last click
First click, linear, time decay, and position-based were retired from GA4 and Google Ads in November 2023. Google’s attribution settings documentation lists only the three that remain.
Any strategy deck recommending a position-based model cannot be executed inside GA4.
One exception saves an argument.
First click is gone from the reporting-model dropdown. A first-touch view is not gone from GA4.
The user-scoped dimensions First user source, First user medium, and First user campaign still record how each user originally arrived. The User acquisition report is built on them, and they don’t change when you switch the reporting attribution model.
You can’t assign first-click credit to a key event. You can still see which channel introduced the user.
The retired models also still matter as concepts. They describe real ways credit can be split, they exist in HubSpot, Adobe, and most standalone attribution platforms, and you can rebuild any of them in BigQuery from a GA4 export.
What you can’t do is pick them from a dropdown in Google’s products, which is where most agency reporting actually happens.
Which attribution models you can still select
Google retired four rule-based models from GA4 and Google Ads in November 2023. They remain valid concepts and still run in other platforms.
Model
In GA4
Where else you can run it
Data-driven
Available
GA4 default. Google Ads. Weighting is not published.
Paid and organic last click
Available
GA4, Google Ads, and effectively every analytics tool.
Google paid channels last click
Available
GA4 only. Credits Google ad channels exclusively.
Last non-direct click
Partial
Not a separate option. GA4 last click skips direct by default.
First click
Retired
HubSpot, Adobe Analytics, BigQuery export.
Linear
Retired
HubSpot, Adobe Analytics, BigQuery export.
Position-based (U-shaped)
Retired
HubSpot, Adobe Analytics, BigQuery export.
Time decay
Retired
Adobe Analytics, BigQuery export.
W-shaped
Never in GA4
HubSpot and CRM-native attribution. Needs a lead-creation stage.
Source: Google Analytics attribution settings documentation.
Single-Touch Models
Single-touch models give one touchpoint 100% of the credit.
They’re easy to explain and easy to misuse. Last-touch remains the default assumption behind most client conversations whether anyone names it or not.
| Model | Credit rule | Best for | Still in GA4? |
|---|---|---|---|
| Last interaction | All credit to the final touchpoint, including Direct | Short cycles, direct response, transactional ecommerce | No, not in this exact form |
| Paid and organic last click | All credit to the last touchpoint, skipping Direct unless the whole path is Direct | Short cycles where you don’t want Direct absorbing credit | Yes, this is GA4’s rule-based option |
| Last non-direct click | All credit to the last non-direct touchpoint | Sites with heavy direct traffic | Yes, this is what paid and organic last click does |
| First interaction | All credit to the first touchpoint | Awareness campaigns, top-of-funnel budget arguments | No, retired Nov 2023 |
Two of those get used interchangeably, and they shouldn’t be.
Classic last interaction credits whatever came last, Direct included. GA4’s paid and organic last click skips Direct unless the entire path is Direct, which makes it a last non-direct click model wearing a new name.
Every GA4 model behaves this way. Direct almost never receives credit in a GA4 report, even when it was the final session.
First-touch is worth running for one specific job. It tells you which channels bring strangers in, and no other model does.
For a client spending on brand awareness, running first-touch against last-touch is the fastest way to show that a channel with zero last-touch conversions is still feeding the pipeline.
Last-touch is the model most clients arrive already believing.
It’s defensible for a coffee subscription with a two-day consideration window.
It’s actively misleading for a B2B software client with a four-month cycle, where the last touch is almost always branded search. Branded search is a symptom of demand, not a cause of it.
Multi-Touch Models
Multi-touch models split credit across several touchpoints.
All four of the classic rule-based versions were removed from Google’s products. Running any of them means a third-party tool, a CRM, or your own BigQuery work.
| Model | Credit rule | Best for | Where you can run it |
|---|---|---|---|
| Linear | Equal credit to every touchpoint | A neutral baseline before you weight anything | HubSpot, Adobe, BigQuery |
| Position-based (U-shaped) | 40% first, 40% last, 20% split across the middle | Journeys where introduction and close both matter | HubSpot, Adobe, BigQuery |
| W-shaped | 30% each to first touch, contact creation, and deal creation, with 10% split across the rest | B2B with defined lead and opportunity stages | HubSpot, Adobe, CRM-native |
| Time decay | Credit weighted toward touchpoints nearer the conversion | Long nurture cycles, recency-sensitive offers | Adobe, BigQuery |
The same five touchpoints, five different answers
One B2B buyer, one demo request, touches spaced a week apart. Every model below reads identical data and produces a different budget recommendation.
Touch 1LinkedIn adday −28
Touch 2Blog postday −21
Touch 3Email nurtureday −14
Touch 4Retargetingday −7
Touch 5Branded searchday 0
First clickRetired from GA4
Touches 2 to 5 receive 0%.
Paid and organic last clickAvailable in GA4
Touches 1 to 4 receive 0%.
LinearRetired from GA4
Position-basedRetired from GA4
Time decayRetired from GA4
Time-decay weights use a 7-day half-life against the day offsets shown above, so touch 1 lands at 3%. Change the gaps and every bar in that row changes. Read the bottom rows against the top one. Under last click you would cut LinkedIn. Under first click you would fund it. Branded search wins under three of the five models despite being a symptom of demand rather than a source of it.
Linear is the most useful of the four and the least popular, because it’s boring.
Equal credit makes no claim about importance. That makes it the cleanest baseline for spotting channels that appear nowhere in your last-touch report.
Run linear once against last-touch and the assisted channels announce themselves.
Position-based and W-shaped are the same idea at different resolutions. Both assume you already know which moments matter.
W-shaped weights three milestones at 30% each:
- First touch
- The interaction that created the contact
- The interaction that created the deal
The remaining 10% gets spread across everything in between.
Note what isn’t on that list. The closing touch gets nothing.
That’s the line between W-shaped and full-path attribution, where first touch, lead creation, deal creation, and close each take 22.5%.
W-shaped needs clean contact-creation and deal-creation timestamps in the CRM. Without those, it’s guesswork with extra steps.
Time decay suits long nurture cycles where recency tracks intent.
It also systematically starves brand and content spend. Pair it with a first-touch read if the client funds any awareness work.
Data-Driven and Algorithmic Models
Data-driven attribution uses machine learning to compare converting paths against non-converting paths, then distributes credit based on what actually differed.
It’s GA4’s default. It’s also the only multi-touch option Google still ships.
The appeal is that it stops you from picking a rule.
The cost is that you can no longer explain the number.
GA4 describes a counterfactual approach and doesn’t publish the weighting. A client asking why Facebook got 22% this month and 14% last month gets no answer beyond “the model changed its mind.”
That’s a real problem in a client meeting. It’s also the honest reason many agencies still report last-touch alongside it.
Sean Kerr frames the tradeoff this way:
Along with the increased nuance of attribution options, AI requires agencies and marketers to give up significant specific control, and it also takes a much more qualified marketer to use these strategies to their full effect.
That’s the deal with every algorithmic model.
You trade explainability for a number that’s probably closer to the truth. You also need someone on the team who can tell the client why that trade was worth making.
Data-driven models need volume. A client running forty conversions a month will see the numbers swing for reasons that have nothing to do with their campaigns.
For those accounts, last click plus a first-touch comparison from another tool is more useful than a black box.
Enterprise algorithmic attribution, the kind Adobe and specialist platforms sell, is the same idea with more inputs and more setup.
It earns its cost when a client has clean cross-device identity, offline conversion data, and enough volume for the model to learn from.
Below that bar, it produces confident numbers from thin data. That’s the most expensive kind of wrong.
Where Attribution Breaks
Every attribution model needs a touchpoint it can observe.
The fastest-growing part of the buying process produces none. That’s the shift making older attribution advice unreliable rather than merely incomplete.
How AI Assistants Erase the Source
A buyer asks ChatGPT, Perplexity, Gemini, or Copilot to compare vendors in your category.
The assistant answers, cites a few sources, and names three companies. She reads it, forms a shortlist, and never clicks anything.
Days later she types your brand name into a browser and lands on your pricing page.
Your analytics records one session. Source: direct.
The comparison that built the shortlist, and every competitor who was in it, left no trace.
What your report sees and what actually happened
The research that built the shortlist produces no session, no referrer, and no row in any attribution model.
Invisible to analytics
Partial or no signal
Recorded in GA4
Conversion
When the buyer does click a citation, whether the source survives depends on the surface she was using.
Desktop web usually passes something. ChatGPT appends utm_source=chatgpt.com to citation links. Perplexity passes perplexity.ai as an ordinary referrer. Both typically arrive as identifiable sessions.
Mobile apps are the opposite case. The ChatGPT iOS and Android apps hand external links to the system browser, and the referrer often doesn’t survive the handoff. Claude frequently serves citation links with the referrer stripped entirely.
GA4 handles more of this natively than it used to.
Google added an AI Assistant channel to the Default Channel Group, so qualifying sessions from recognized assistants now get medium ai-assistant and their own row alongside Organic Search. No regex required.
Two gaps are worth knowing before you show a client that number:
- Perplexity isn’t on Google’s recognized list and still lands in Referral.
- The channel doesn’t reclassify sessions from before it reached your property.
A custom channel group closes both. Our guide on how to track AI traffic in GA4 covers the regex and the setup.
The part no regex can reach is the majority. Sessions that end inside the assistant, answer delivered and no click at all, generate nothing to track.
That isn’t a gap in your tag manager. It’s a research surface sitting entirely upstream of every web analytics tool.
The Rest of the Dark Funnel
AI is the newest hole. It isn’t the only one.
Agencies running B2B accounts already know the older ones:
- Private sharing. A link forwarded in Slack, sent as an email attachment, or dropped in a WhatsApp thread arrives with no referrer. Analytics files it as direct.
- Podcasts and video. A listener hears your client’s name in an interview and searches it three weeks later. No trackable touchpoint exists at any point.
- Review sites and communities. G2, Reddit, and industry Slack groups shape shortlists constantly. Some of that clicks through and gets tagged. Most of it converts into a branded search.
- Offline conversation. A peer recommendation at a conference is still the highest-converting touchpoint in most B2B categories, and it has never been measurable.
Call tracking closes one piece of this, and it’s the piece most agencies underrate.
Dynamic number insertion connects a phone conversation back to the session that produced it, which recovers offline conversions for clients whose deals close by phone.
If that’s your client base, the best call tracking apps are worth the line item.
What Direct Traffic Is Actually Telling You
Direct traffic used to mean bookmarks and typed URLs.
It now means “we could not determine a source.” It’s absorbing the AI research layer, the private-sharing layer, and the offline layer all at once.
Treat direct as a signal rather than a residual. Two readings belong in your reporting.
Watch the direct-to-branded-search ratio over time. A client whose branded organic search volume climbs without a campaign behind it is being recommended somewhere you can’t see.
That’s the closest thing to a dark funnel measurement standard tooling offers. It also moves before revenue does.
Then watch direct as a share of total sessions. A steady climb with no site changes and no offline campaigns usually means AI-assisted discovery growing underneath the report.
Set that up as a tracked metric rather than something you notice in a quarterly review.
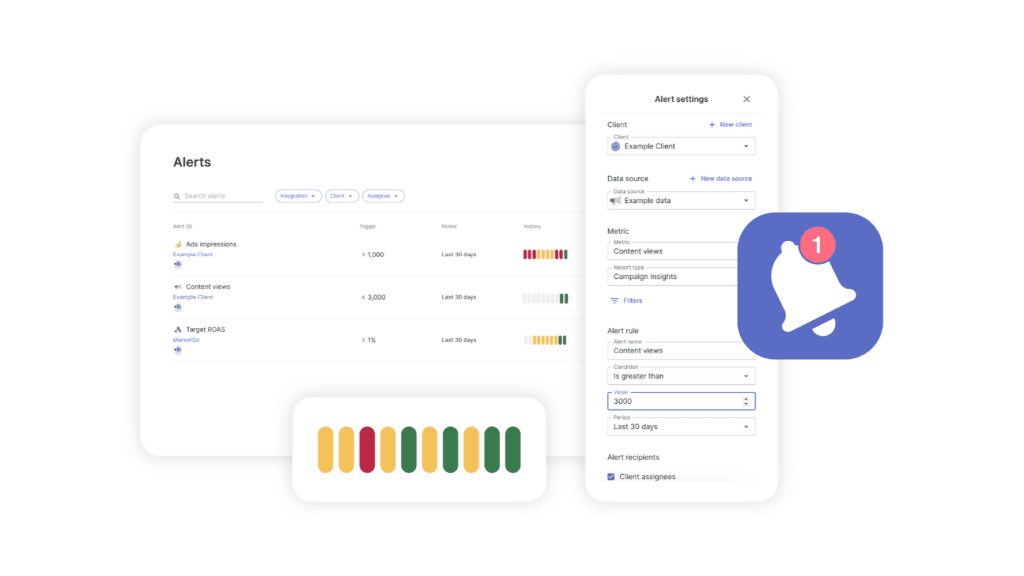
Inside Swydo you can put a threshold on it. Open Monitoring → Alerts → +New Alert, pick the client’s GA4 property, choose Direct sessions or branded impressions from Search Console, and set a percentage-change trigger on a 30-day window.
The notification arrives by email or Slack when the pattern breaks.
Nobody checks eleven clients for this by hand every month, which is how it stops happening by March.
The Three-Signal Read
No single number answers “what caused this conversion.” Stop presenting one.
The read that holds up in a client meeting combines three signals that fail in different directions. The useful information sits in where they disagree.
The Three-Signal Read
Three measurements that fail in different directions. The useful information sits in where they disagree.
SIGNAL 1
Modeled credit
Which observable touchpoints were involved, and in what order.
From: GA4, ad platforms, CRM attribution. Run two models, not one.
Fails on: causation, and anything it could not observe.
SIGNAL 2
Self-reported source
Where the buyer believes they first heard about the client.
From: a “How did you first hear about us?” field on demo and signup forms.
Fails on: recall bias, and options you forgot to list.
SIGNAL 3
Demand movement
Whether total demand moves when spend moves.
From: branded search volume, direct session share, inbound volume against spend, holdout tests.
Fails on: channel-level detail. It sees the aggregate only.
HOW TO READ IT
When signals 1 and 2 agree, act on it. When they disagree, signal 2 usually points at the origin and signal 1 is showing you the path. When signal 3 contradicts both, trust signal 3 and go find what your tracking is missing.
Signal One, Modeled Credit
This is your attribution model output. It answers one question well: of the touchpoints we could observe, which were involved and in what order.
Run two models rather than one. Last click plus a first-touch or linear comparison.
The delta between them is the assisted-conversion story.
What modeled credit can’t tell you is causation. A channel with high credit might be one buyers pass through on their conversion path while converting for entirely different reasons.
Branded search is the standing example.
Signal Two, Self-Reported Source
Add a “How did you first hear about us?” field to demo requests and signup forms.
Include named options: ChatGPT, Perplexity, a podcast, a colleague.
It captures the source at the one moment the buyer is willing to tell you, and it works regardless of which referrer headers got stripped along the way.
Self-reported data is biased. People forget, people pick the most recent thing, and the option list shapes the answers.
It’s still the only mechanism that recovers a channel your analytics never saw. For AI-influenced pipeline, it’s currently the only one at all.
The plumbing is the awkward part.
Swydo has no public REST API, so a direct pipe from your form tool isn’t available. The route that works is the Google Sheets integration:
- Push form responses to a sheet with Zapier or Make.
- Connect the sheet as a data source.
- The self-reported breakdown sits in the same report as the modeled numbers.
One extra hop, and it’s the honest version of how this gets built today.
Signal Three, Demand Movement
The third signal ignores individual conversion paths and watches aggregate demand.
Branded search volume. Direct session share. Total inbound lead volume against spend.
When you increase awareness spend and branded search climbs six weeks later with no other change, that’s evidence attribution will never produce.
This is also where a holdout test belongs if the client’s budget allows one.
Pause a channel in one region for four weeks, compare conversion rates against an untouched region, and you’ve measured cause directly. No model does that.
It’s the reason causal analysis keeps beating attribution when the two disagree.
Read the three together:
- When modeled credit and self-reported source agree, act on it.
- When they disagree, self-reported usually points at the real origin and the model is showing you the path.
- When demand movement contradicts both, trust demand movement and go find out what your tracking is missing.
How to Choose an Attribution Model for a Client
The model should match the client’s cycle length, conversion volume, and what they’ll actually do with the answer.
Four questions settle it in most cases. The third is the one agencies skip.
How Long Is the Sales Cycle?
Cycles under a week rarely have enough touchpoints for a multi-touch model to say anything interesting.
Last click is fine, and everyone can explain it.
Cycles over a month need at least two models. The gap between first-touch and last-touch is where the actual budget conversation lives.
Report only one of them and you’re arguing from half the data.
How Many Conversions Per Month?
Data-driven attribution needs volume to stabilize.
Under a few hundred conversions a month, the model’s swings will be noise you end up explaining in client calls.
Low-volume accounts do better with a transparent rule, even a crude one.
A client who understands last click and trusts it is in a better position than a client watching a black box reallocate credit every month.
What Will the Client Actually Change?
A client who will move budget between channels needs a model that distinguishes channels.
A client who only wants to know whether the retainer is working needs total pipeline against total spend and no model at all.
This question kills more attribution projects than it should, and killing them is usually correct.
A W-shaped model built for a client who will never reallocate anything produces a nicer-looking report and zero decisions. Ask what changes based on the answer before you build the thing.
What Data and Budget Exist?
Advanced attribution needs clean tracking, cross-device identity, and often a CRM connection.
It also needs someone to maintain it, which is the cost that gets left out of the pitch.
Most agency clients are better served by three cheap things:
- Disciplined UTM parameters
- Two models compared against each other
- A self-reported field on the form
If you’re deciding between Google Ads model options specifically, our breakdown of which Google Ads attribution model to use goes deeper on that one decision.
The Tools Agencies Use for Attribution
Attribution work splits across three tool categories:
- The platform that models the credit
- The tools that capture touchpoints the platform misses
- The reporting layer that puts it in front of a client
Most agencies need something from each.
| Tool | Price | What it does for attribution |
|---|---|---|
| Google Analytics 4 | Free | Three reporting models: data-driven, paid and organic last click, Google paid channels last click. The four rule-based models are gone. |
| CallRail | Starting at $45/month | Dynamic number insertion ties phone conversations back to the session and campaign that produced them. |
| CallTrackingMetrics | Contact for pricing | Call and text attribution down to campaign, keyword, and ad. Useful for clients running SMS as a channel. |
| HubSpot | Varies, free plan available | Multi-touch models Google removed, including linear, position-based, and W-shaped, calculated against CRM contact records. |
| Adobe Analytics | Contact for pricing | Algorithmic attribution across large datasets, with cross-device identity. Enterprise volume required. |
| Swydo | $69/month | Reporting layer. Pulls modeled numbers from 38 integrations into one client report, alongside self-reported and demand-signal data. |
GA4 is still the right starting point for most clients, with the caveat that its model menu is a third of what it was.
The comparison report lives under Advertising → Attribution → Attribution models, which Google renamed from Model comparison. You’re comparing three options rather than seven.
HubSpot is the practical answer for agencies wanting linear, position-based, or W-shaped attribution without building it themselves.
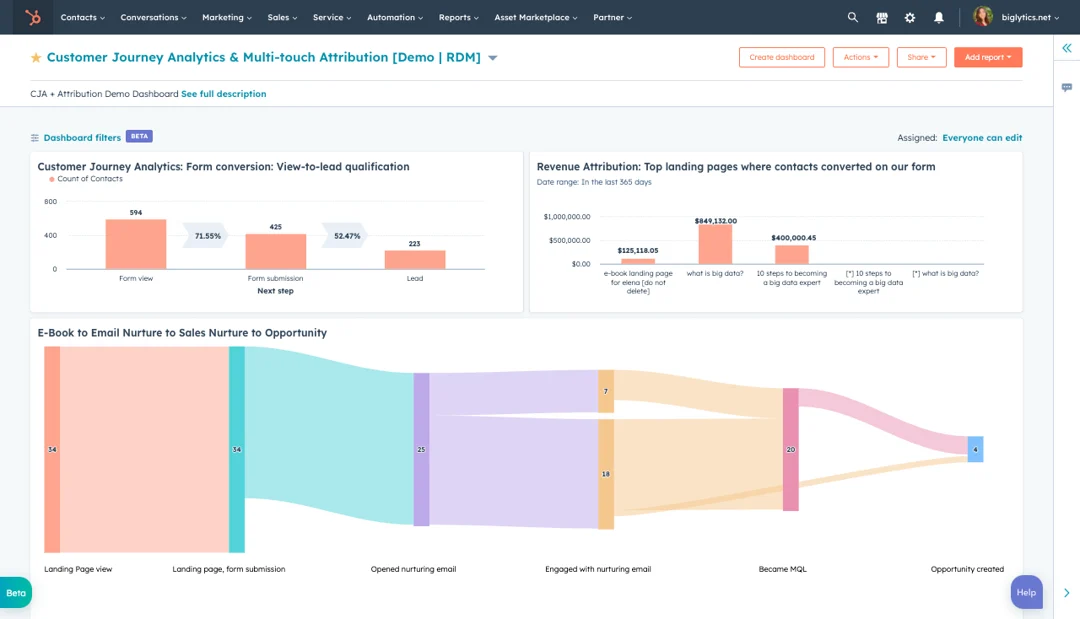
HubSpot Advanced Marketing Reporting
Because it calculates against CRM contact records rather than sessions, it also survives the cookie problems that break session-based models.
The catch: it only sees touchpoints that reached a known contact. It’s blind to the same anonymous research layer everything else is.
Adobe earns its price at enterprise scale and almost nowhere else.
If your client isn’t already running Marketo or Adobe Experience Platform, the setup cost outweighs the modeling gain.
How to Report Attribution Without Overpromising
The reporting job is to show the client which channels are involved, how confident you are, and what you want to change, in a format they’ll read in four minutes.
Precision they can’t act on is worse than a rounded number with a recommendation attached. Same reason the marketing KPIs your client really cares about are rarely the ones on your dashboard.
Three things belong in every attribution report you send.
A cross-channel view with consistent metrics.
Each ad platform reports its own conversions using its own attribution window, and counts the same conversion more than once across platforms.
Add the platform numbers together and you get a total larger than the client’s actual revenue. Clients notice.
This is a data blending problem before it’s an attribution one.
A Combined Data Sources widget in Swydo pulls Google Ads, Meta, LinkedIn, TikTok, Microsoft, and Reddit into one widget with shared metrics, so spend and conversions are compared on the same basis rather than summed across incompatible ones.
One constraint to know upfront: custom metrics don’t work inside combined widgets. Any blended calculation you’ve built has to live in a separate widget.
The model you used, named.
One line at the top of the section. “Credit assigned using last click across paid and organic channels.”
Five seconds to write. It prevents the argument where a client compares your number to their Shopify dashboard and finds a different one.
Different models, different answers, no mystery.
The gap, stated.
Direct traffic as a percentage, and what you think is inside it.
Clients handle “roughly a fifth of conversions have no traceable source, and here’s what our form data says about that fifth” far better than a pie chart that quietly implies full coverage.
That third part is where this falls apart in practice, because nobody writes it fresh for twelve clients every month.
Swydo AI drafts it from the report data using the Summary, Wins, Issues, and Recommendations prompts, so you edit rather than start blank.
Your plan includes 4,000 AI credits a month. An average summary runs about 95 credits, and unused credits aren’t billed. Usage past the balance runs against a spending limit you set.
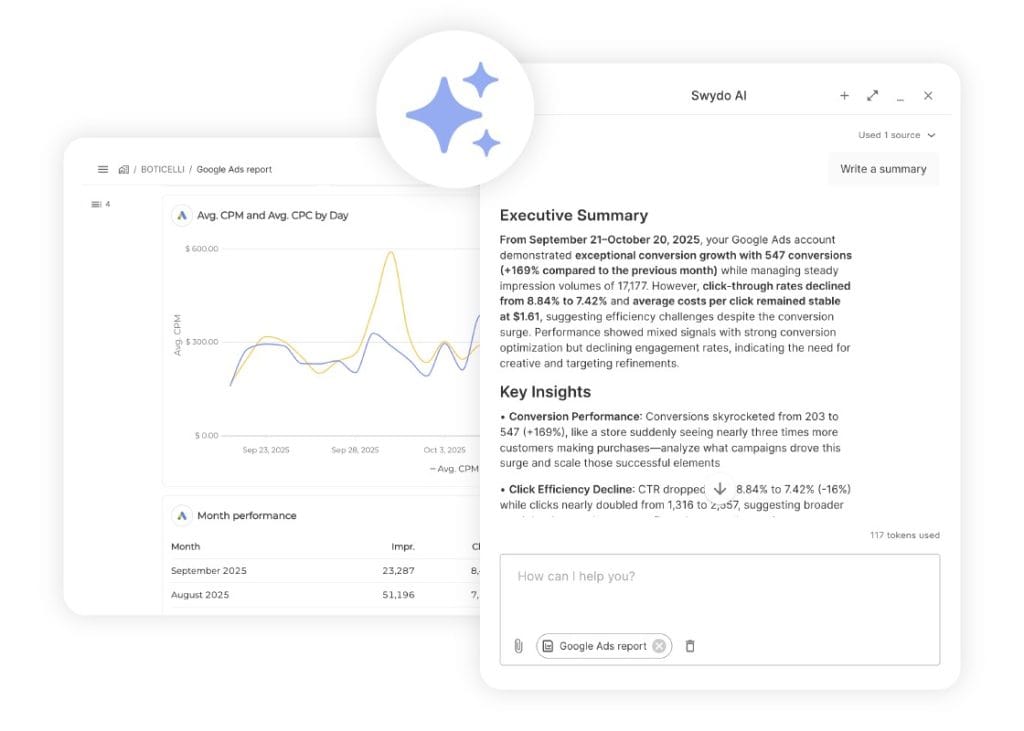
For delivery, the Client Portal replaces the pile of separate links most agencies send.
Open the client’s account, go to the Portal tab, enable it, and select which Reports, Boards, and Goals that client can see. Preview it to check what they’ll actually get, add a password if the data warrants one, and send the single generated link.
If access needs to end, regenerate the link and the old one dies immediately.
For attribution work specifically, the useful part is that the modeled report, the KPI board, and the goal progress all sit in one place. A client checking a number on the 18th doesn’t email you to ask which link had it.
Attribution reporting also breaks silently, which is the failure mode worth designing against.
A LinkedIn token expires after the client enables two-factor authentication. The widget stops returning data. Nobody notices until a client asks why a channel went to zero.
Data Health Check Alerts flag broken connections and expired tokens with a red dot under Settings → Connections and an email to the connection owner. That turns a bad client conversation into a fix on a Tuesday morning.
If you’re setting up the reporting side properly, our guide to client reporting best practices covers the structural decisions underneath all of this.
Common Attribution Mistakes
Most attribution failures come from treating a model output as a measurement.
Five specific versions of that show up repeatedly in agency accounts.
One Model Presented as the Answer
A single model gives a single story, and clients treat single stories as facts.
Report two and the comparison does the teaching for you.
The fix costs nothing. Run last click and one other model, show both, and put the difference in a sentence:
Last click gives paid search 60% of conversions. Linear gives it 38%. The 22-point gap is work other channels are doing before the final click.
Direct Traffic Treated as No Source
Direct is the largest unexamined bucket in most reports. It’s growing for structural reasons rather than random ones.
Break it apart instead of ignoring it:
- New versus returning users inside direct
- Which landing pages receive direct sessions
- Whether direct is growing faster than branded search
A direct session landing on a deep comparison page is not a bookmark.
Models Built on Broken Tracking
Attribution runs on tagged links.
A campaign with inconsistent UTM parameters produces output that looks precise and is wrong in ways nobody can see.
Audit tagging before you audit models. Mismatched capitalization alone splits one campaign into three rows in your report, and that error survives every model you apply on top of it.
Channels Cut for Looking Weak
A channel with no last-touch conversions and strong first-touch involvement is doing awareness work.
Cut it and you get a clean short-term efficiency gain plus a pipeline problem one cycle later.
Check assisted conversions before recommending a cut.
If the channel disappears from first-touch too, cut it. If it doesn’t, you’re about to remove the top of the funnel to improve a metric that only measures the bottom.
Optimization Toward Metrics Nobody Buys
Attribution makes it easy to optimize toward whatever the model rewards, which is not always what generates revenue.
A channel credited with impressions-heavy assisted conversions can absorb budget for a year without producing a customer.
Tie every attribution conclusion back to revenue or qualified pipeline. Be precise about which one you mean, because ROAS vs ROI is the most common place agencies and clients talk past each other.
Our piece on vanity metrics covers which numbers routinely fail that test.
Attribution Best Practices
Good attribution is mostly discipline applied before the modeling starts.
Five practices carry most of the weight.
Standardize UTM tagging first. Write the convention down, lowercase everything, use hyphens, and make tagging part of campaign launch rather than something you fix during reporting.
Every model downstream inherits the quality of this step.
Add the self-reported field now. A “How did you first hear about us?” question on demo and signup forms takes an hour to add.
It’s the only mechanism that catches AI-influenced and word-of-mouth pipeline. Include named AI assistants in the option list.
Compare two models, always. One model is an opinion presented as a fact. Two models is an analysis.
Track the demand signals separately. Branded search volume, direct session share, and total inbound volume against spend belong on a monitoring board, not buried in a monthly PDF.
Set a Goal in Swydo with a target and a period, and the client’s progress stays visible between reports instead of surfacing once a month.
Bring offline data in where it exists. Call tracking, promo codes, unique landing pages for print, and CRM close data.
For clients with meaningful phone or in-person conversion, attribution without these is measuring a fraction of the business and reporting it as the whole.
Communication matters as much as the modeling.
Clients don’t want to hear about Shapley values. They want to know which channel to fund next quarter and how confident you are.
Lead with the recommendation. Support it with the model comparison. Name the uncertainty in one sentence rather than hiding it.
Marketing Attribution FAQ
Direct answers on which models exist, which one to pick, and why your numbers never match
Marketing attribution decides which of your channels gets credit when someone buys. An attribution model is the rule that splits that credit up, and swapping the rule changes the answer without changing anything the customer did.
One buyer sees a LinkedIn ad, reads a blog post, searches your brand name, and books a demo. First-touch says LinkedIn earned the sale. Last-touch says search did. Both are reading identical data. Neither is measuring what caused the purchase.
There are three families: single-touch, multi-touch, and data-driven. Single-touch hands everything to one touchpoint. Multi-touch splits it by a fixed rule. Data-driven lets an algorithm decide the split.
| Model | How credit is split |
|---|---|
| First touch | 100 percent to the first interaction |
| Last touch | 100 percent to the final interaction |
| Linear | Split evenly across every interaction |
| Position-based | 40 percent first, 40 percent last, 20 percent to the middle |
| Time decay | More credit the closer a touch is to the purchase |
| W-shaped | 30 percent each to first touch, contact creation, and deal creation |
| Data-driven | An algorithm assigns fractional credit from your own data |
None of them, because attribution models do not measure accuracy, they apply a rule. Data-driven is usually the closest to reality when you have enough conversion volume, and it is the hardest to explain to a client.
Accuracy is the wrong test. A model can only distribute credit among touchpoints it could see, and it says nothing about cause. The question worth asking is which model produces a decision you would actually act on, then whether a second model contradicts it.
Single-touch gives one touchpoint all the credit. Multi-touch spreads it across several. Single-touch is easier to explain and easier to act on wrongly.
The gap between them is the useful part. A channel with zero last-touch conversions looks like waste under single-touch and looks like the top of your funnel under multi-touch. Running both and reading the difference beats agonizing over which one is right.
Attribution tells you which channels appeared on the path to a sale. Incrementality tells you whether the sale would have happened without them. Only one of those is a measure of cause.
Incrementality needs a test, not a report. Pause a channel in one region for four weeks, compare against an untouched region, and the difference is real. When a holdout test disagrees with an attribution report, the test wins.
Yes, as long as you stop treating one model’s output as the truth. Attribution is strong for comparing channels you can observe and weak for proving cause.
The failure mode is not running attribution. It is running one model, calling it a measurement, and cutting a channel that only looked weak because the rule was set to undervalue it.
Match it to your sales cycle length and your conversion volume. Short cycles with high volume can use last click. Long cycles need at least two models compared against each other. Low volume should avoid data-driven entirely.
| Situation | Start with |
|---|---|
| Cycle under a week, transactional | Last click on its own |
| Cycle over a month | Last click plus first touch, and read the gap |
| Under a few hundred conversions a month | A rule you can explain, not data-driven |
| Defined lead and opportunity stages in a CRM | W-shaped inside the CRM |
| Client will not reallocate budget either way | No model. Report pipeline against spend. |
Two models, not one, and W-shaped if the CRM supports it. Long cycles have too many touchpoints for a single-touch model to say anything useful, and last touch in B2B is almost always branded search.
Branded search is a symptom of demand, not a source of it. A model that keeps crowning it is telling you people already knew the brand, which is a fact about your awareness spend rather than an argument for cutting it.
Last click for impulse and repeat purchases, data-driven once you clear a few hundred conversions a month. Short consideration windows genuinely do concentrate influence at the end of the path.
The exception is high-ticket ecommerce with a research phase, furniture or electronics rather than consumables. Those behave like B2B, and last click will systematically starve the content and social spend that built the consideration.
It changes your reported results dramatically and your actual results not at all, until you act on it. The same five touchpoints can hand one channel 100 percent under one model and zero under another.
That is exactly why it matters. The model does not change performance, it changes which channel you defund next quarter. Pick the wrong one for a long sales cycle and you will cut the top of the funnel to improve a metric that only measures the bottom.
Use it if the account has enough conversion volume for the numbers to hold steady month to month. Data-driven compares converting paths against non-converting paths and assigns credit based on what differed.
The cost is that you cannot explain it. Google does not publish the weighting, so when a channel drops from 22 percent to 14 percent, you have no answer for the client beyond saying the model changed its mind. On low-volume accounts those swings are noise, and a transparent rule beats a black box.
Three: data-driven, paid and organic last click, and Google paid channels last click. First click, linear, time decay, and position-based were retired from GA4 and Google Ads in November 2023 and have not returned.
If a strategy doc recommends a position-based model in GA4, it cannot be executed. Compare the three that remain under Advertising, then Attribution, then Attribution models.
Admin, then Data display, then Events, then Attribution settings. You need Editor or Marketer level permissions on the property to change it.
Two settings sit on that screen, and most people change one and ignore the other. The reporting attribution model decides how credit is split. The lookback windows decide which touchpoints are eligible for credit in the first place. The second one is usually doing more damage.
A lookback window sets how far back GA4 will look for touchpoints when a conversion happens, and anything older than the window gets no credit at all. Set it to at least your typical sales cycle.
GA4 defaults to 30 days for acquisition key events and 90 days for everything else. Engaged-view events are fixed at 3 days. If your client’s sales cycle runs four months, a 90-day window means every campaign that introduced the buyer is invisible. The conversion still happened. The measurement just stopped looking far enough back to see it.
| Event type | Default | Options |
|---|---|---|
| Acquisition key events | 30 days | 7 or 30 days |
| All other key events | 90 days | 30, 60, or 90 days |
| Engaged-view | 3 days | Not adjustable |
Yes for the model, no for the lookback window, and that difference catches people out. Switching the reporting attribution model reprocesses your history, so past reports will show different numbers than they did last month.
Lookback window changes only apply going forward. Extend from 30 days to 90 and nothing improves immediately, because the longer window needs time to accumulate touchpoints. Two practical consequences: tell a client before you change the model, and never change either setting in the middle of a reporting period you are about to present.
Yes, through the First user source, First user medium, and First user campaign dimensions, even though First click is gone from the model dropdown. The User acquisition report is built on them.
Those dimensions are user-scoped, so they do not change when you switch the reporting attribution model. You cannot assign first-click credit to a conversion, and you can still see which channel introduced each user.
Every GA4 attribution model skips direct visits unless the entire path is direct. That is by design, and it is why GA4’s paid and organic last click is really a last non-direct click model.
It also means GA4 quietly reassigns credit that a platform crediting direct would have kept. If your GA4 number and another tool’s number disagree on a channel, this rule is one of the first places to look.
GA4 has an AI Assistant channel in the Default Channel Group that catches recognized assistants automatically, with a custom channel group to fill the gaps. How much you capture depends on the device.
Desktop sessions usually survive. ChatGPT tags citation links with a campaign parameter, and Perplexity passes its own referrer. Mobile apps are the problem, because links handed to the phone’s browser often lose the referrer and land in Direct. Two known gaps: Perplexity is not on Google’s recognized list and still shows as Referral, and the channel does not reclassify sessions from before it reached your property.
No. A click from an AI Overview carries a google.com search referrer, so it lands in Organic Search exactly like a normal blue-link click. There is no reliable way to separate the two in GA4.
This matters more than the ChatGPT question for most clients. If organic sessions fall while impressions hold steady in Search Console, AI Overviews are probably answering the query without the click. That pattern shows up as an organic decline rather than an AI line item, so nobody attributes it correctly.
Because direct no longer means bookmarks and typed URLs. It means the source could not be determined. AI assistants, links shared in Slack or email, and mobile app handoffs all strip the referrer and land there.
Check branded search volume alongside it. If both climb with no campaign behind them, buyers are finding the brand somewhere your analytics cannot see. A direct session landing on a deep comparison page is not somebody’s bookmark.
The dark funnel is every touchpoint that shapes a purchase without creating a trackable session, and you recover it by asking buyers rather than by tracking them. Podcasts, Slack groups, review sites, AI answers, and conference conversations all leave nothing behind.
Add a “how did you first hear about us” question to demo and signup forms, with named options including AI assistants, a podcast, and a colleague. It is biased data. It is also the only thing that catches a channel your analytics never saw.
They shrink the pool of touchpoints a model can see, and the missing touchpoints do not get reassigned to another channel. They disappear. Credit lands wherever the model finds its next observable touch.
Your report still shows a full pie. The pie is just smaller than it looks. Server-side tagging recovers some signal by moving collection off the browser, though it fixes the input rather than the causation problem.
They count different things on different days using different rules, so they are never supposed to match exactly. A gap of ten to twenty percent is normal.
Google Ads credits the conversion to the date of the ad click. GA4 credits it to the date the conversion happened, so a 20-day cycle puts the same sale in different weeks. Google Ads also counts view-through and cross-device conversions that GA4 cannot see, and each platform applies its own attribution window. Pick one as your source of truth per client and say so in the report.
Because each platform claims the same conversion for itself. Meta, Google, and LinkedIn all count a sale they touched, so summing their dashboards double counts every buyer who saw more than one channel.
Never add platform numbers together in a client report. Compare spend and conversions on a shared basis in one place, and name the model you used in a single line at the top of the section so nobody has to guess why your figure differs from their Shopify dashboard.
Attribution follows individual user paths. Marketing mix modeling ignores individuals and correlates total spend against total results. MMM needs no cookies, no tracking, and no user identity.
That independence is why MMM is coming back. It works on offline channels, privacy-restricted channels, and the AI research layer that produces no session at all. The tradeoff is that it needs two or three years of history and cannot tell you which campaign to pause tomorrow.
Most agency clients do not. Disciplined UTM tagging, two models compared, a self-reported source field on the form, and call tracking where deals close by phone will outperform a platform nobody has time to configure.
Paid tools earn their cost when you have clean cross-device identity, offline conversion data, and enough volume for a model to learn from. Below that bar they produce confident numbers from thin data, which is the most expensive kind of wrong.
Show the same customer twice under two different models and let the contradiction make the point. One journey, two answers, no argument needed.
Then give them three lines they can act on. The recommendation first, the model comparison as support, and one honest sentence on what you cannot see. Clients handle “about a fifth of conversions have no traceable source, and here is what our form data says about that fifth” far better than a pie chart that implies full coverage.
Use dynamic number insertion for calls, and give every offline channel its own trackable destination. Call tracking shows a different phone number per traffic source and connects the conversation back to the session that produced it.
For everything else: unique URLs and QR codes for print, dedicated landing pages per offline campaign, promo codes, and a recorded answer to how the buyer heard about you captured by whoever picks up the phone. None of it is precise, and all of it beats leaving offline out of the model entirely.
Conversions by source under two models, cost per conversion by channel, assisted conversions, direct session share, branded search volume, and self-reported source. Add revenue by channel wherever the CRM or ecommerce data supports it.
Two of those get skipped and they are the two that matter most. Direct session share tells the client how much of the report is guesswork. Self-reported source is the only line that catches channels the tracking never saw.
What to Do Next
Run the arithmetic on your own accounts.
Count the clients where you report a single attribution model. Then check what percentage of their conversions currently sit in direct traffic.
If direct is above 15% and you’re reporting one model, your attribution story is thinner than your client thinks it is.
The single strongest fix is the self-reported source field. An hour of work, no tracking infrastructure required, and the only method that recovers the AI-influenced pipeline every other approach misses.
Add it to one client’s demo form this week. Run a second attribution model alongside your default in the next monthly report. Compare the three signals.
You’ll know within one reporting cycle which of your channel assumptions were wrong.
Prove your agency’s impact with data-driven attribution.
Start Your Free Swydo Trial Today