
A parameter is a number that describes an entire population. A statistic is a number calculated from a sample of that population, used to estimate the parameter you cannot measure directly.
Google Analytics stops counting once a single query crosses 10 million events. Past that line it reads a slice, scales the result up, and shows you the percentage it used to get there. The session count in your Monday report might be an exact count. It might be an estimate set in the same font.
Confuse the two and it costs you in one specific way. You attach a client target to a number that was always an estimate, then spend the next quarter explaining why the number moved when nothing about the campaign did.
Here’s the order. What each term means with marketing examples of both, then a three-question test for classifying any number in front of you, then where both types turn up inside a client report, then the sample-size math for when you’re the one collecting the data.
What Is a Parameter?
A parameter is the true value for a complete group. Every member counted, nothing estimated, one fixed answer.
If your client has 12,543 email subscribers, that’s a parameter. Not approximately 12,543. Not 12,543 give or take. The list has a length and you can go read it.
Parameters marketers work with every week:
- Total ad spend. Google Ads bills for every click it charged you for. The invoice and the spend widget agree because both come from the same ledger.
- Subscriber count. Your ESP owns the list, so it can count the list.
- Transactions in your store. Shopify or your payment processor records every order. Nobody sampled anything.
- Customer lifetime value across closed accounts. Once a customer relationship ends, the revenue they generated is a finished number.
Notice what those four have in common. In each case, the system reporting the number is also the system that owns the record. That’s the practical signature of a parameter, and it holds far more reliably than the textbook definition does.
The catch is that most of the questions marketers actually care about sit outside any system’s ledger. Nobody owns a record of how many young professionals recognize your client’s brand. So you estimate.
What Is a Statistic in Marketing?
A statistic is a number calculated from part of a group and used to describe the whole group. It’s an estimate with math behind it, not a guess.
Say you want the average engagement rate for healthy-food posts on Instagram. Nobody finishes reading every such post. Pull 1,000 posts across a range of accounts, calculate the average engagement on those, and you have a statistic that estimates the parameter.
Statistics show up constantly in marketing work:
- Survey results. Four hundred responses standing in for a customer base of forty thousand.
- A/B test outcomes. A 25% open rate on a 1,000-person send, used to predict the full list.
- Reach and impressions on social platforms. Most of these are modeled from a panel, not counted head by head.
- Search volume and traffic estimates. Semrush and similar tools infer these from clickstream data.
- Attribution-modeled conversions. The attribution model assigns credit. It does not observe credit.
Here’s the useful table for matching a marketing goal to the statistic that answers it.
| Marketing goal | Statistic you collect | What it estimates | How to collect it |
|---|---|---|---|
| Raise email open rates | Open rate on a small test send | Open rate for the full list | Split-test subject lines on 5% of the list |
| Improve ad click-through | CTR on a limited-budget test campaign | CTR at full spend | Run a small campaign across two or three creative variants |
| Lift landing page conversions | Conversion rate on a page variant | Conversion rate for all traffic | A/B test the new page against the current one |
| Understand brand perception | Aided recall in a 400-person survey | Recall across the target market | Panel survey with quotas on age and region |
Every row estimates a parameter that exists but sits out of reach.
How Parameters and Statistics Differ
Parameters and statistics differ on five things: what they describe, what notation they use, whether the value is fixed, how hard they are to get, and what job they do. The table below covers all five.
| Parameter | Statistic |
|---|---|
| Describes an entire population | Describes a sample |
| Written with Greek letters, like μ for the population mean | Written with Latin letters, like x̄ for the sample mean |
| One fixed value | Changes depending on which sample you drew |
| Usually hard to get, because you need everyone | Calculated from data you already collected |
| The value you want | Your best estimate of the value you want |
Population and Sample
A population is the whole group you want to describe. A sample is the slice of it you can actually reach.
Population might mean every current customer, every potential buyer in a vertical, or every young professional in three metro areas. Sample means the 500 of them who answered your email.
The sample has to look like the population on the dimensions that matter for your question. Age, region, purchase history, channel preference. Skew any of those and the statistic stops estimating the parameter and starts estimating something else. A survey answered mostly by your happiest customers measures happiness among people willing to answer surveys.
Mean, Median, and Standard Deviation
Three summary numbers do most of the work in marketing analysis, and each one answers a different question about your data.
- Mean. The average. Add the values, divide by the count. Fine when values cluster, misleading when they don’t.
- Median. The middle value once you sort them. Better than the mean for money, because a handful of large purchases drag an average somewhere no real customer lives.
- Standard deviation. How spread out the values are. A satisfaction score of 7 with a small standard deviation means broad agreement. The same 7 with a large one means half your customers love you and half don’t.
Report the median alongside the mean for any revenue figure. If the two are far apart, the average is describing a few accounts rather than the client’s business.
How to Tell Whether a Number Is a Parameter or a Statistic
Three questions classify almost any number you’ll meet in a marketing report. Call it the Census Check. Run it in order and stop when you get a clear answer.
The Census Check
Three questions that classify any number in a marketing report. Run them in order and stop at the first clear answer.
Question 1
Who got counted?
Does the number cover everyone in the group it claims to describe, or a slice of them?
Everyone. “All 12,543 subscribers”
A subset. “Based on 500 responses”
Question 2
Where did it come from?
Does the reporting system own the underlying record, or observe it from the outside?
Owns it. CRM, billing, ad platform spend
Observes it. Panel reach, traffic estimates
Question 3
Does the number move?
Re-run the same query over the same date range tomorrow. Compare the two values.
Identical both times
Wobbles with no campaign change
Parameter. Counted. Safe to set a hard target against.
Statistic. Estimated. Set the target with a range.
Who Got Counted
Ask whether the number covers everyone in the group it claims to describe. Everyone means parameter. A subset means statistic.
“Total revenue: $1.2M” covers everyone who paid. “Average order value: about $85” hedges with a tilde, which is a tell. So does “based on 500 responses.” Language leaks the answer more often than you’d expect, and it’s free to read.
Where the Number Came From
Check whether the reporting system owns the underlying record or observes it from outside. Systems that own records produce parameters. Systems that observe produce estimates.
Your CRM, your payment processor, and your ad platform’s billing side own their records. Panel-based reach figures, third-party traffic estimates, and anything with “modeled” in the documentation do not. This one distinction resolves most of the ambiguous cases, because it doesn’t depend on how the vendor chose to word the label.
Whether the Number Moves
Re-run the same query over the same date range a day later. A parameter comes back identical. A statistic wobbles.
Marketers rediscover this every month without naming it. Last month’s sessions changed slightly. Attributed conversions shifted after the model reprocessed. Reach dropped by 3% with no campaign change. None of that is a bug.
Estimates move because the estimate got recalculated, and knowing which of your numbers behave that way saves the call where a client asks why last month’s report doesn’t match this month’s version of last month.
Google’s own documentation on data sampling is worth reading once if you report on GA4, because it tells you exactly when the platform switches from counting to estimating and how to see the sample percentage it used.
Where Parameters and Statistics Show Up in a Client Report
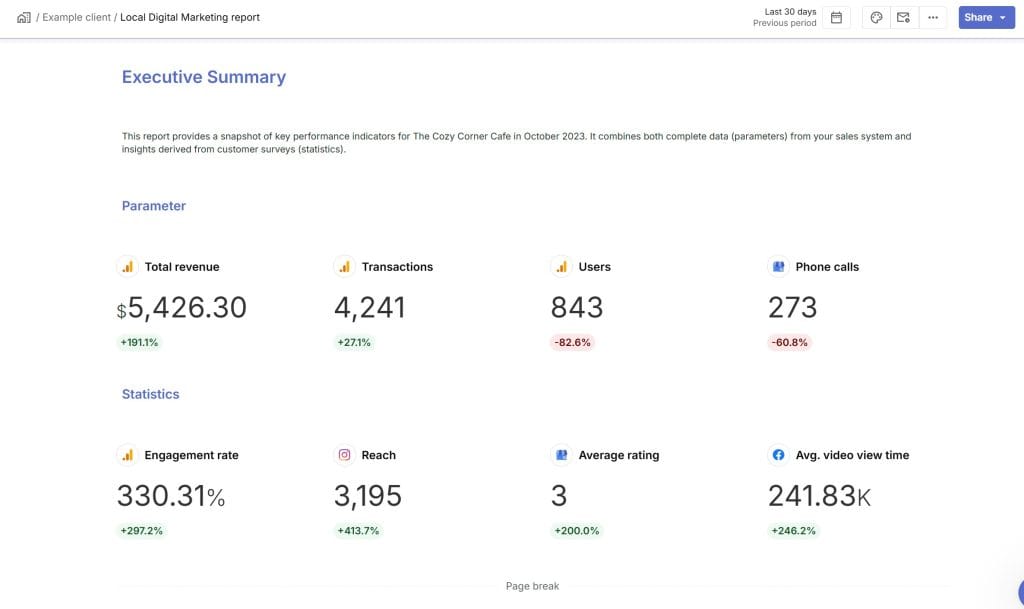
A single client report usually mixes both types on the same page, and the layout gives you no clue which is which. Spend and revenue widgets are counts. Reach, modeled conversions, and anything sourced from a research tool are estimates.
Counted or estimated, widget by widget
The same dashboard mixes both. The layout gives you no clue which is which.
| What you see in the report | What it is | What that means for your target |
|---|---|---|
| Google Ads spend | Counted | Billing record. Set a hard number. |
| Store revenue and orders | Counted | The processor owns every transaction. |
| Email subscribers and sends | Counted | The list has a length. Go read it. |
| GA4 standard report sessions | Counted | Unsampled, but only counts what the tag fired on. |
| GA4 exploration over 10M events | Estimated | Check the sample percentage before quoting it. |
| Social reach and impressions | Estimated | Modeled from a panel. Expect month-to-month drift. |
| Search volume and traffic estimates | Estimated | Inferred from clickstream. Use for ranking, not for forecasting. |
| Survey scores such as NPS | Estimated | Publish the sample size next to the score. |
| Attribution-modeled conversions | Modeled | Credit is assigned, not observed. Restates when the model reprocesses. |
A broken connection turns a counted row into a partial one without showing an error. The widget just gets smaller.
The mix is the reason data literacy pays off here. Most agencies already handle qualitative and quantitative data side by side without confusing the two. The counted-versus-estimated split is that same discipline applied to numbers that all look quantitative, and it gets far less attention.
Two practical consequences follow.
First, survey data and other sample-based numbers still belong in the report. A quarterly NPS score from 300 respondents tells the client something their ad platforms cannot. Manual KPIs in Swydo let you enter that number by hand and put it next to the platform data, so the estimate lives in the same view as the counts rather than in a separate slide nobody opens.
Second, a count is only a count if the pipe stayed open. A revoked token or an expired permission produces a widget that shows a smaller number rather than an error, and a smaller number looks like a bad month. Swydo’s Data Health Check monitors every connection across all 38 integrations and flags broken ones under Settings, with an email to whoever owns the connection. Most tools let you find out from the client.
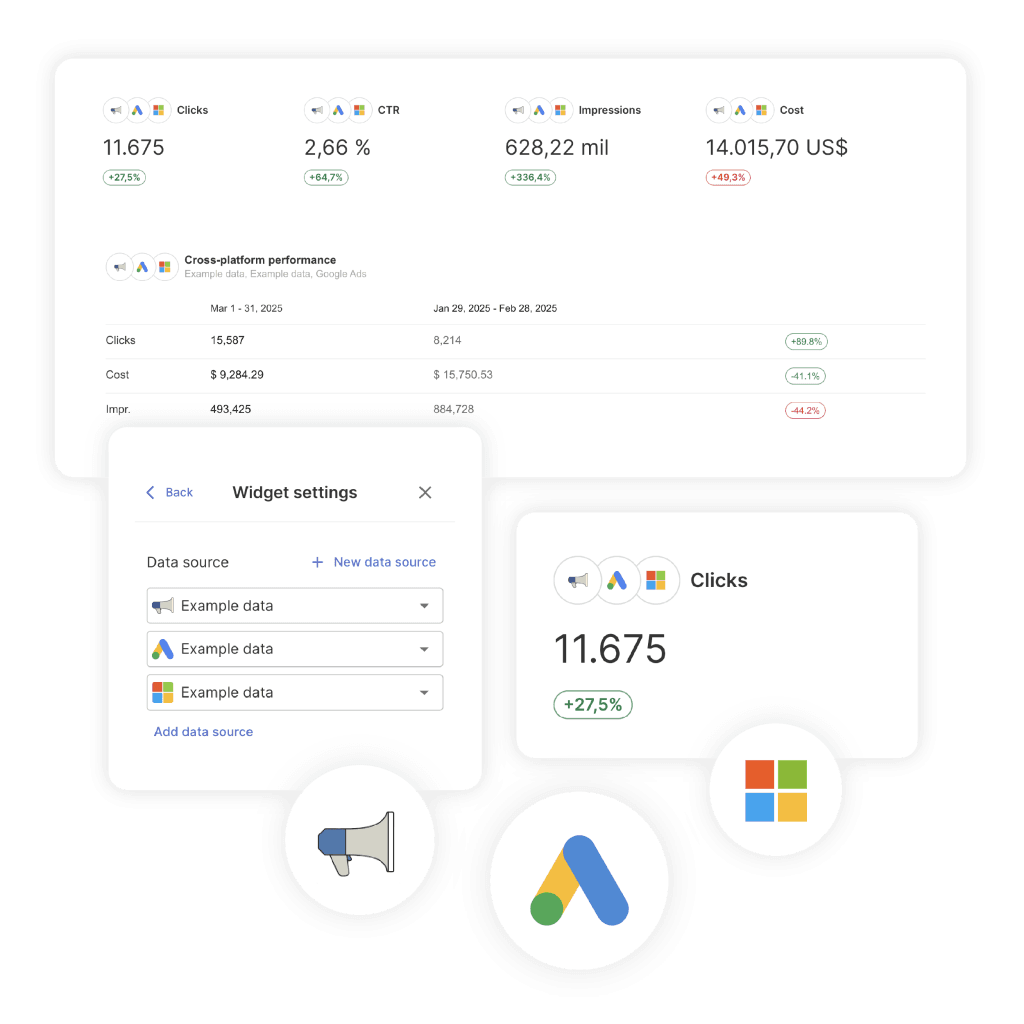
For cross-channel totals, Combined Data Sources adds spend, clicks, conversions, revenue, and ROAS across up to five ad platforms in one widget. Those totals stay parameters because every input is a billing record. One honest limit is worth knowing before you build it. Custom metrics don’t work inside a combined widget, so any calculated field you rely on has to sit in a separate one.
How to Read a Statistic Without Overreading It
Three numbers tell you how much confidence a statistic deserves: the sample size, the margin of error, and whether the difference you’re looking at clears statistical significance. Skip any of the three and you’ll act on noise.
Sample size drives the other two. The standard reference points for a large population:
| Margin of error | Responses needed | What it buys you |
|---|---|---|
| ±10% | About 100 | Rough direction only |
| ±5% | About 385 | Standard for marketing research |
| ±3% | About 1,000 | Tight enough to compare segments |
A 100-person survey is not useless. It just cannot tell you that 48% differs from 52%, because the margin of error swallows the gap whole. Run segment analysis and the same math applies inside each segment, which is why a 400-person survey split four ways gives you four unreliable answers instead of one solid one.
The same result, three levels of confidence
A test send returns a 25% open rate. How much that tells you depends entirely on how many people it went to.
Margin of error at 95% confidence for a large population. At n = 100, a 25% result and a 33% result are not distinguishable from each other.
Using a sample to make a claim about a population is the whole business of descriptive vs inferential statistics, and significance is where marketers misread it most. Statistical significance answers a narrower question than most people assume.
It tells you the difference you observed is unlikely to come from random chance, usually at a p-value under 0.05. It does not tell you the difference is large enough to care about. A 0.1% conversion lift on a million sessions clears significance easily and might not pay for the developer time.
Among client reporting best practices, this one costs the least and saves the most. State the margin of error whenever you present a statistic to a client. “42% prefer option A, plus or minus 4%” survives scrutiny. “42% prefer option A” invites a follow-up question you’d rather answer on your own terms.
How to Work With Both Types in Your Reporting
Four habits keep the distinction useful instead of academic: sample deliberately, pick metrics that predict, control for the biases you can name, and set targets against the right number type.
Sample deliberately. Use random selection so every member of the population has an equal shot. Where segments matter, use stratified sampling and hit the sample size in each segment, not just overall.
Pick metrics that predict. Pricing page visits usually forecast purchases better than total pageviews. Ratios beat raw counts for the same reason, which is why cost per acquisition against lifetime value tells you more than either number alone. Most of the work is telling the predictive metrics apart from the vanity metrics.
Control for known bias. Pilot your survey questions on a small group before sending, because terms that seem obvious internally often mean three different things to customers. Watch collection timing too. Feedback gathered only on weekends captures whoever is free on weekends.
Set targets against the right number. A target attached to a counted number can be hit or missed. A target attached to an estimate can only be hit or missed within a range. Goals in Swydo track progress with On Track, Off Track, and Achieved states and send notifications at the end of each period, which works cleanly for spend and revenue targets. For a goal built on modeled or sampled data, set the threshold with the margin of error already subtracted so a normal wobble doesn’t fire a false alarm.
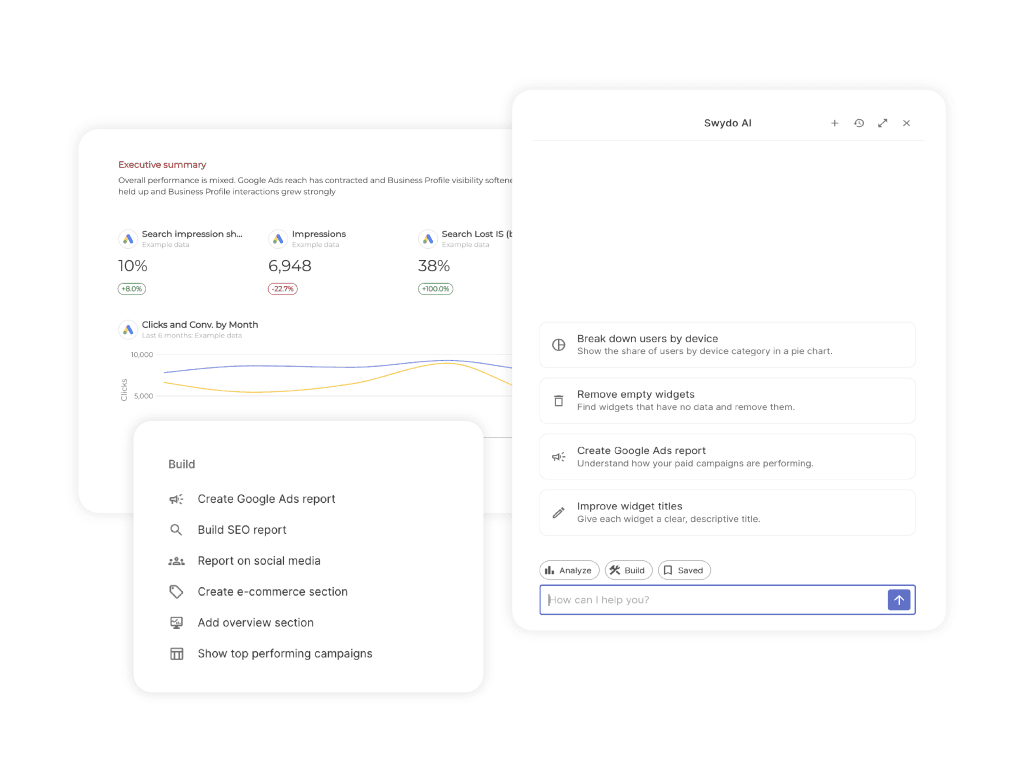
Where does the AI fit? Swydo’s AI Report Builder assembles and edits reports from a plain-English description, and Saved Prompts let you reuse the ones that work so a new hire’s first report matches everyone else’s. It won’t build everything. Custom Metrics, Combined Data Sources, Manual KPIs, text widgets, and filters all have to be created by hand, and the builder doesn’t run inside templates.
Once the report is built, Client Portal gives each client one link holding the Reports, Boards, and Goals you chose to share. Add a password where the data warrants it, and regenerate the link to cut off access to the old one. Clients stop emailing you mid-month for a number they could have opened themselves.
What does the eighteenth of the month look like at your agency right now?
Parameters vs Statistics FAQ
Direct answers on counted numbers, estimated numbers, and how much to trust each one
A parameter describes an entire population and has one fixed value. A statistic describes a sample and changes depending on which sample you drew. Statistics exist to estimate parameters you cannot measure directly.
Your client’s total revenue last year is a parameter. Every order counted, one right answer. The average satisfaction score from 400 surveyed customers is a statistic, because a different 400 customers would return a slightly different score.
Either one, depending on who got averaged. A mean calculated from an entire population is a parameter, written μ. A mean calculated from a sample is a statistic, written x̄.
The word “average” tells you the operation, not the scope. That is why averages get misread more often than any other number in a report. Average order value across every order in the database is a parameter. Average order value across a sample of orders is an estimate of it.
A parameter is something like “all 12,543 subscribers on the list.” A statistic is something like “62% of 1,000 people surveyed prefer the new design.” The first counts everyone. The second counts a slice and generalizes.
| Parameter | Statistic |
|---|---|
| Total ad spend last quarter | Estimated market share |
| All 12,543 email subscribers | Open rate from a 1,000-person test send |
| Every transaction in the store | Average satisfaction from 400 responses |
| Headcount at your agency | National agency salary benchmarks |
Parameters use Greek letters and capital letters. Statistics use lowercase Latin letters, some with a mark above them. The notation tells a reader at a glance whether a number covers everyone or a sample.
| Measure | Parameter | Statistic |
|---|---|---|
| Mean | μ (mu) | x̄ (x-bar) |
| Standard deviation | σ (sigma) | s |
| Proportion | p or P | p̂ (p-hat) |
| Size of the group | N | n |
| Correlation | ρ (rho) | r |
Yes, whenever the population is small enough or closed enough to count completely. A census produces a parameter. Textbooks treat parameters as unknown because they usually study populations nobody can reach, such as all voters or all consumers.
Marketing is friendlier than that. Your billing system, your subscriber list, and your transaction table already ran the census. Those numbers are parameters, exactly known, sitting in your dashboard right now. The estimates only start where your own systems stop.
Because most groups worth studying are too large, too expensive, or too unwilling to be measured completely. A full census would cost more than the answer is worth, and the market would shift before you finished counting.
Nobody owns a record of how many people recognize your client’s brand. So you survey 400 of them and estimate. A usable answer this week beats an exact answer you never get.
Ask three questions in order and stop at the first clear answer. Who got counted, where the number came from, and whether the number moves when you re-run the same query.
| Question | Parameter | Statistic |
|---|---|---|
| Who got counted? | Everyone in the group | A subset |
| Where did it come from? | A system that owns the record | A system that observes or models |
| Does the number move? | Identical every time | Wobbles with no real change |
A population is the whole group you want to describe. A sample is the slice of it you can actually reach. Parameters come from populations. Statistics come from samples.
A sample has to resemble its population on whatever matters to your question, such as age, region, or purchase history. Skew any of those and the statistic stops estimating the parameter you wanted. A survey answered mostly by your happiest customers measures happiness among people willing to answer surveys.
Estimated numbers move because the estimate got recalculated, not because performance shifted. Attributed conversions restate after the model reprocesses. Reach drifts because it comes from a panel. Sampled analytics queries return a slightly different scaled figure each run.
Counted numbers behave differently. Ad spend and store revenue come back identical every time, because a ledger recorded them once. Knowing which of your widgets sit in which group saves the call where a client asks why last month’s report no longer matches this month’s version of last month.
Usually because at least one of them is estimating rather than counting, or the two define the metric differently. Two estimates of the same thing are supposed to disagree slightly. That is not a bug.
Before you go hunting for a tracking problem, check whether either number is a count. Ad platform conversions and analytics conversions rarely match because the platforms use different attribution windows and different models. Ad spend and invoiced spend should match, and when they do not, something is genuinely broken.
Rule of thumb. Two counted numbers that disagree means a real problem. Two estimated numbers that disagree means two methods. Compare a count against an estimate and you are comparing different questions.
A point estimate is a single number from a sample used as the best guess for the population value. A 25% open rate on a test send is a point estimate of the open rate for the whole list.
Point estimates are easy to calculate and easy to overtrust. On their own they imply a precision they do not have, which is why a range belongs next to every one you report.
Sampling error is the gap between your sample result and the true population value, caused simply by measuring a subset instead of everyone. Every sample has it. It is not a mistake anyone made.
Draw ten different samples of 400 people and you get ten slightly different answers. All ten sit near the true value, none lands exactly on it. Margin of error is how you put a number on that spread, and larger samples shrink it.
Sampling error is random and shrinks as the sample grows. Bias is systematic and does not shrink at all. More responses fix the first problem and make the second one worse.
Survey only your most engaged customers and 10,000 responses give you a very precise measurement of the wrong group. Fix bias by changing who you ask, never by asking more of the same people.
The trap. A large biased sample produces a confident wrong answer, which is more dangerous than a small honest one, because nobody questions it.
It means that if you repeated the same study many times, about 95 out of every 100 intervals you built would contain the true value. The confidence describes the method, not your one specific result.
The common misreading is that there is a 95% chance the true number sits inside your particular range. In practice the distinction rarely changes a marketing decision, so the useful takeaway is simpler. A confidence interval is your point estimate plus and minus the margin of error, and the true number is probably in there somewhere.
No. Precision improves with size but the returns fall off fast, and size does nothing about a bad sample. Going from 100 to 400 responses roughly halves your margin of error. Going from 1,000 to 4,000 barely moves it.
Spend the extra effort on reaching the right people rather than more people. Four hundred well-chosen responses beat 4,000 from whoever happened to click.
About 385 responses buys a plus or minus 5% margin of error on a large population, which covers most marketing research. Push toward 1,000 when you need to compare segments against each other.
| Margin of error | Responses needed | What it buys you |
|---|---|---|
| ±10% | About 100 | Rough direction only |
| ±5% | About 385 | Standard for marketing research |
| ±3% | About 1,000 | Tight enough to compare segments |
Size each segment separately if you plan to analyze segments. A 400-person survey split four ways gives you four unreliable answers instead of one solid one.
No. Significance means the result probably is not random, which is a different claim from useful. It usually means a p-value under 0.05, and that is the whole of what it tells you.
With a large enough sample, tiny differences clear the bar easily. A 0.1% conversion lift across a million sessions is significant and might not pay for the developer time. Check the size of the effect and what it is worth in revenue before you act on it.
Anything billed or transacted is counted. Anything modeled, panel-based, or survey-based is estimated. A single dashboard usually mixes both, and the layout gives you no clue which is which.
| Metric | Type |
|---|---|
| Ad spend and clicks | Counted |
| Store revenue and orders | Counted |
| Email subscribers and sends | Counted |
| Sampled analytics queries | Estimated |
| Social reach and impressions | Estimated |
| Search volume and traffic tools | Estimated |
| Survey scores such as NPS | Estimated |
| Attribution-modeled conversions | Estimated |
| Industry benchmarks | Estimated |
Statistics, and often from a sample that looks nothing like your client. A published average click-through rate comes from whichever accounts the publisher had access to, which is rarely a random slice of the industry.
Read the methodology note before you put a benchmark in a client deck. Check the sample size, who got included, and what date range it covers. A benchmark drawn from enterprise accounts tells a local services client very little, however confident the number looks.
Put the sample size and the margin of error next to the number, every time. “42% prefer option A, plus or minus 4%” survives scrutiny. “42% prefer option A” invites a follow-up question you would rather answer on your own terms.
Use language that separates the two types out loud. “Total revenue rose 12% last quarter” is a count. “Across 500 surveyed customers, roughly 67% prefer the new design” is an estimate, and the phrasing says so. Then connect the number to a business outcome instead of leaving it as a percentage on a slide.
Yes, but subtract the margin of error from the threshold first so normal variation does not read as a miss. A target on a counted number can be hit or missed cleanly. A target on an estimate can only be hit or missed within a range.
Go through your current report and label every widget C for counted or E for estimated, then count how many E widgets carry a target. Those are the ones that will move on their own. Rebuild each on a counted metric, or widen the threshold until normal drift stops triggering it.
Look for three disclosures: the sample size, how people were selected, and the margin of error. A report that hands you a percentage with none of the three is asking for trust it has not earned.
Check the data source as well. Internal systems produce counts about your own customers. Third-party research tools produce estimates about a market. Reports that mix the two without labeling which is which are the ones that cause arguments later, usually on a call.
Next Steps
Open your most recent client report and label every widget C for counted or E for estimated. Count how many E widgets have a target attached to them.
Those are the targets that will move on their own, and each one is a client conversation you’ll have to explain your way out of. Fix each one by rebuilding the target on a counted metric, or by widening the threshold by the margin of error.
Twenty minutes on a report you already have.
See which numbers in your client reports are counted and which are estimated, in one place.
Start Your Free Trial Today