
Are you tired of spending hours creating PPC reports that fail to deliver meaningful insights? It’s time to simplify your reporting process and unlock the full potential of your PPC campaigns.
In this blog post, we’ll explore the best PPC reporting templates for digital marketers in 2024. These templates will help you:
- Customize reports to match your business requirements
- Track key metrics like CTR, conversion rate, CPA, and ROAS
- Streamline report automation for efficient analysis
Whether you’re managing paid search, display ads, or social media campaigns, we’ve got you covered with a range of adaptable templates.
Let’s dive in and discover how these top PPC reporting templates can recharge your marketing efforts.
Customizable PPC Reporting Templates for Quick Insights
- Save time and effort with pre-built, customizable PPC reporting templates
- Gain valuable insights into your campaigns’ performance at a glance
- Tailor reports to your specific needs and goals for maximum relevance
Essential Elements of a PPC Reporting Template
A well-designed PPC reporting template should include key performance metrics such as click-through rate (CTR), cost per acquisition (CPA), and return on ad spend (ROAS). These metrics provide a clear picture of how your campaigns are performing and help you identify areas for improvement.
Adapting Templates for Specific PPC Campaign Types
Swydo has different types of PPC campaign reporting templates to help marketers effectively track and analyze performance. Here are some examples:
Paid Search Reporting Template
A paid search reporting template focuses on metrics specific to search engine marketing, such as average position, quality score, and search impression share. It helps you monitor your keyword performance and identify opportunities to improve your ad rank and visibility.
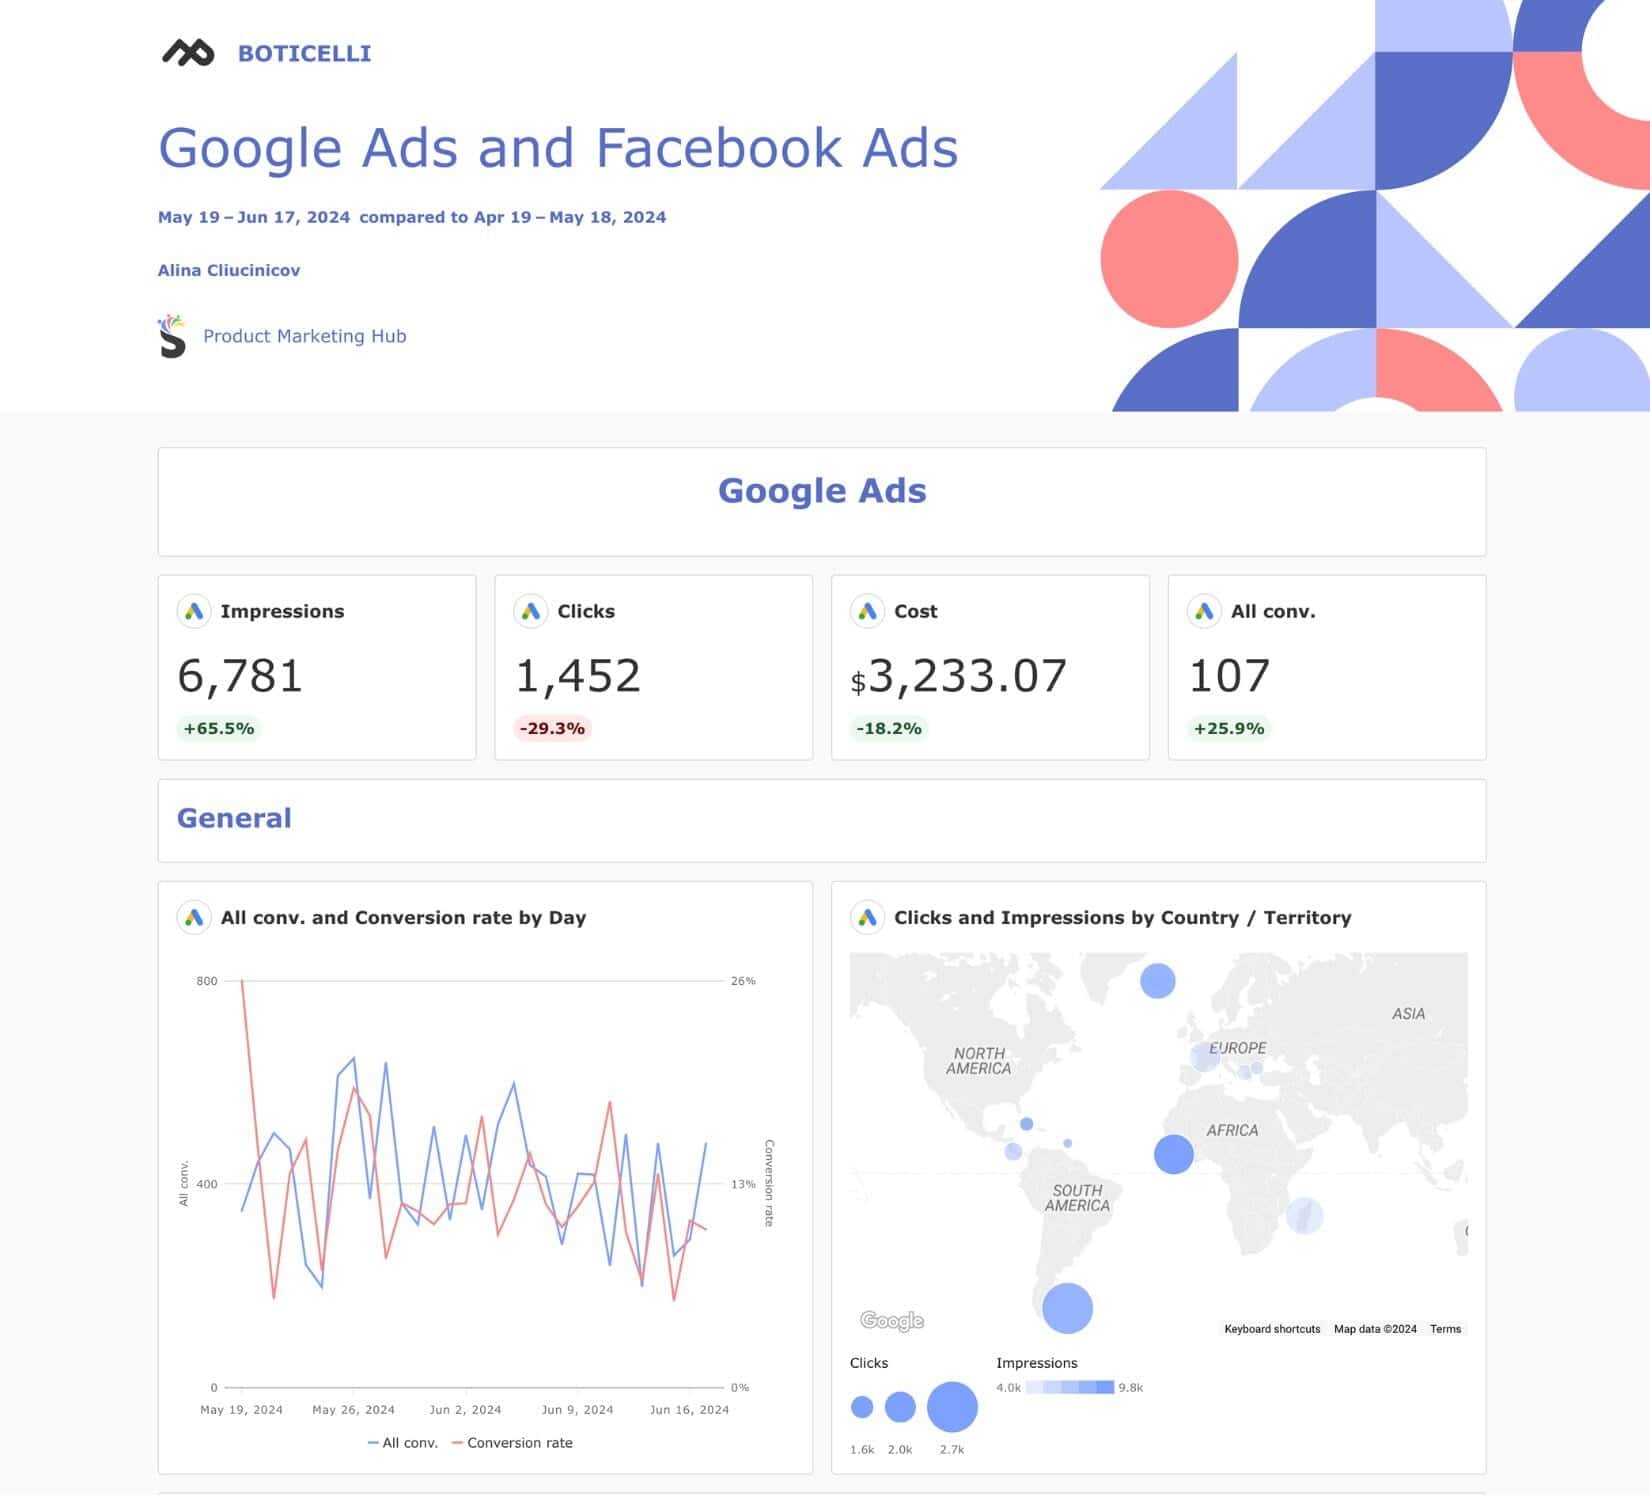
Google Ads and Facebook Ads Reporting Template
If you run PPC campaigns across multiple platforms, a combined reporting template can help you compare performance and allocate budgets effectively. This template includes metrics specific to each platform, as well as overall performance indicators.
PPC Monthly Reporting Template
A monthly reporting template provides a comprehensive overview of your PPC performance over a longer period. It includes metrics like total spend, total conversions, and average CPA, allowing you to identify trends and make strategic decisions for future campaigns.

Google Ads Display Reporting Template
A display reporting template emphasizes metrics relevant to visual ads, such as viewable impressions, view rate, and engagement rate. It enables you to assess the impact of your display ads on brand awareness and consideration.

Getting Started with PPC Reporting for Your Business
- Establish clear PPC reporting objectives aligned with business goals
- Select the most suitable PPC reporting tools and templates for your needs
- Continuously refine and improve your PPC reporting process based on feedback
Defining Your PPC Reporting Objectives
Before diving into the actual reporting process, it’s crucial to establish clear objectives for your PPC reports. Start by identifying the key stakeholders who will be using the reports, such as marketing managers, executives, or clients. Understanding their specific information needs will help you tailor the reports to provide the most relevant insights.
Next, ensure that your PPC reporting objectives align with your overall business goals. For example, if your primary goal is to increase brand awareness, your reports should focus on metrics like impressions, click-through rates, and reach. On the other hand, if your goal is to drive sales, you’ll want to prioritize metrics like conversions, cost per acquisition, and return on ad spend (ROAS).
Finally, determine the appropriate reporting frequency and format for your stakeholders. Some may prefer weekly or monthly reports, while others might require real-time dashboards. Consider the level of detail needed and the preferred delivery method (e.g., email, shared documents, or in-person presentations).
Choosing the Right PPC Reporting Tools and Templates
With your objectives clearly defined, it’s time to select the best PPC reporting tools and templates for your business. There are numerous options available, ranging from native advertising platform reports (e.g., Google Ads, Microsoft Advertising) to third-party reporting software that can consolidate data from multiple sources.
When evaluating PPC reporting software, consider factors such as ease of use, integration capabilities, customization options, and pricing. Look for tools that can automate data collection and report generation, saving you time and reducing the risk of manual errors. Examples of popular PPC reporting tools include Swydo, Looker Studio, and Tableau to name a few.
Once you’ve chosen your reporting tool, customize the templates to match your business requirements. Most tools offer pre-built templates that you can adapt to include your branding, specific metrics, and data visualizations. Swydo offers a range of pre-built reporting templates that are visually appealing, easy to understand, and highlight the most important insights for your stakeholders.
Related: How to Select a Marketing Report Automation Tool
Unlocking PPC Campaign Performance Insights: Key Metrics to Track
- Identify the most critical PPC metrics to monitor campaign success
- Learn how to calculate and interpret key performance indicators (KPIs)
- Discover advanced techniques for optimizing your PPC campaigns based on data-driven insights
Identifying the Most Critical PPC Metrics
When it comes to measuring the success of your pay-per-click (PPC) campaigns, there are several key metrics you need to track. These metrics provide valuable insights into how your ads are performing and help you make data-driven decisions to optimize your campaigns for better results.
Click-through Rate (CTR)
Click-through rate (CTR) is one of the most important metrics in PPC advertising. It measures the percentage of people who click on your ad after seeing it. A high CTR indicates that your ad is relevant and compelling to your target audience. To calculate CTR, divide the number of clicks your ad receives by the number of impressions (times your ad is shown) and multiply by 100.
For example, if your ad receives 100 clicks and 1,000 impressions, your CTR would be 10% (100 clicks ÷ 1,000 impressions x 100). According to WordStream, the average CTR across all industries is 1.91% for search and 0.35% for display ads. However, top-performing ads can achieve much higher CTRs, sometimes reaching double digits.
Conversion Rate
While CTR measures how many people click on your ad, conversion rate tracks how many of those clicks result in a desired action, such as a purchase, form submission, or phone call. A high conversion rate indicates that your landing page and offer are effective at persuading visitors to take action.
To calculate the conversion rate, divide the number of conversions by the number of total ad clicks and multiply by 100. For instance, if your ad receives 100 clicks and generates 10 conversions, your conversion rate would be 10% (10 conversions ÷ 100 clicks x 100).
According to HubSpot, the average conversion rate across all industries is 2.35%, with top performers achieving rates of 5.31% or higher. However, conversion rates vary widely depending on factors such as industry, product price, and the complexity of the conversion process.
Understanding Cost Metrics
In addition to tracking performance metrics like CTR and conversion rate, it’s crucial to monitor cost metrics to ensure your PPC campaigns are profitable. Two key cost metrics to focus on are cost per conversion (CPA) and return on ad spend (ROAS).
Cost per Conversion (CPA)
Cost per conversion, also known as cost per acquisition (CPA), measures how much you spend on average to acquire a new customer or lead. To calculate CPA, divide your total ad spend by the number of conversions generated.
For example, if you spend $1,000 on ads and generate 50 conversions, your CPA would be $20 ($1,000 ad spend ÷ 50 conversions). According to AdEspresso, the average CPA across all industries is $48.96 for search ads and $75.51 for display ads.
Return on Ad Spend (ROAS)
Return on ad spend (ROAS) measures how much revenue you generate for every dollar spent on advertising. To calculate ROAS, divide your total conversion value by your total ad spend and multiply by 100.
For instance, if you spend $1,000 on ads and generate $5,000 in sales, your ROAS would be 500% ($5,000 conversion value ÷ $1,000 ad spend x 100). A ROAS of 500% means that for every $1 you spend on advertising, you generate $5 in revenue.
According to several studies, the average ROAS across all industries is 287%, with top performers achieving rates of 400% or higher. However, like conversion rates, ROAS can vary significantly based on industry, product price, and other factors.
Related: The State of PPC – Global Report 2024: Insights from the PPC Community
Streamlining PPC Report Automation for Efficient Analysis
- Save time and resources by automating PPC reporting processes
- Gain valuable insights through customizable report templates
- Collaborate effectively with stakeholders using shared reports
Leveraging PPC Reporting Tools
Marketers can significantly improve their PPC reporting efficiency by taking advantage of the various tools available. Google Ads Report Editor is a built-in feature that allows users to create, schedule, and share custom reports directly within the Google Ads platform. This tool enables marketers to select specific metrics, dimensions, and date ranges, ensuring that reports are tailored to their unique needs.
Third-party PPC Reporting Software
In addition to Google Ads Report Editor, marketers can also benefit from using third-party PPC reporting software. These tools often offer more advanced features and integrations, allowing users to combine data from multiple platforms, such as Google Ads, Microsoft Advertising, and Facebook Ads, into a single, comprehensive report. A popular third-party PPC reporting tool is Swydo.
Sean Clough, President at Harmony Lab, shares his experience with using Swydo for PPC reporting:
“One tool that has been invaluable is Swydo, which allows me to easily pull granular PPC data directly from platforms like Google Ads and Microsoft Advertising into customizable reports and dashboards.”
Swydo integrates seamlessly with data visualization tools, ensuring my PPC reports contain accurate, real-time data pulled directly from the source. This eliminates any risk of manual errors from exporting and combining data across platforms. Within the reporting interface, I can also apply customized formatting, calculated metrics, and cohesive branding to create visually compelling reports tailored for different stakeholders.
To further ensure reporting consistency, I’ve built templatized report frameworks with core metrics, visualizations, and commentary sections that I can rapidly clone and populate each month. This drives efficiencies while maintaining a uniform structure for trend analysis across periods. Leveraging automated data connectors combined with templatized reporting workflows is a game-changer for generating timely, accurate, and insightful PPC reports at scale.”
Integrating Data from Multiple Platforms
To gain a holistic view of their PPC performance, marketers should integrate data from all the platforms they use. By combining data from Google Ads, Microsoft Advertising, Facebook Ads, and other platforms, marketers can identify trends, compare performance across channels, and make data-driven decisions to optimize their campaigns. Many third-party reporting tools offer seamless integrations, making it easy to consolidate data from multiple sources.
Related: Optimizing PPC Campaign via Report Automation
Scheduling Automated PPC Reports
One of the key benefits of automating PPC reports is the ability to schedule them at regular intervals. This ensures that marketers and stakeholders always have access to up-to-date information without having to manually generate reports each time.
Setting up Daily, Weekly, or Monthly Report Frequencies
Depending on the needs of the organization and the pace of their PPC campaigns, marketers can set up automated reports to be generated daily, weekly, or monthly. For example, a daily report might be necessary for high-volume, fast-paced campaigns that require frequent optimizations, while a monthly report may suffice for more stable, long-term campaigns.
Customizing Report Delivery Methods
Automated PPC reports can be delivered in various formats, such as email attachments, shared links, or through a dedicated reporting dashboard. Marketers should choose the delivery method that best suits their team’s preferences and workflows. Email attachments are ideal for sharing reports with a limited number of recipients, while a shared dashboard can be more effective for collaborating with larger teams or external stakeholders.
Collaborative Report Sharing with Stakeholders
Automating PPC reports not only saves time for marketers but also enables more effective collaboration with stakeholders. By collaborating and creating client-centric reports with team members, clients, or executives, marketers can keep everyone informed about the performance of their PPC campaigns and facilitate data-driven decision-making. Rahul Vij, Managing Director WebSpero Solutions, says, “We customize our PPC reporting templates by first understanding the unique goals and KPIs of each client. For example, an e-commerce client might prioritize sales volume and revenue, while a B2B client focuses on lead quality and cost per lead. We also incorporate client branding and adjust the detail level based on their familiarity with PPC. Some clients prefer high-level summaries with charts, while others want in-depth data.”
He offers some best practices for presenting PPC data to clients:
- Use clear, concise language and avoid jargon.
- Incorporate visual aids like charts and graphs to illustrate trends and comparisons.
- Highlight key insights and actionable recommendations.
- Summarize performance with an executive summary at the beginning of the report.
- Provide context by comparing current data with historical performance.
Granting Access to Shared Reports
To streamline collaboration, marketers should grant access to shared reports or dashboards to relevant stakeholders. This can be done by providing a shared link or by setting up user accounts with specific permissions. By controlling access levels, marketers can ensure that each stakeholder has access to the information they need without overwhelming them with unnecessary data.
Encouraging Feedback and Discussion
Shared reports can serve as a foundation for productive discussions and feedback sessions among team members and stakeholders. Marketers should encourage open communication and actively seek input from others to identify areas for improvement or new opportunities for optimization. By fostering a collaborative environment, marketers can leverage the collective knowledge and expertise of their team to drive better PPC results.
Related: Bridging PPC Gaps: Guide to Agency-Client Synergy in 2024
PPC Reporting With Swydo: Your Key to Marketing Success
CTR, CPA, ROAS – these metrics are your guiding light in the world of PPC. But without the right reporting tools and templates, you might as well be stumbling in the dark.
By leveraging automated reports and customizable templates, you can unlock the full potential of your PPC campaigns. You’ll gain crystal-clear insights into what’s working, what’s not, and where to focus your efforts for maximum ROI.
So, are you ready to take your PPC campaigns to the next level? Swydo is here to help, interested in learning how we can streamline your reporting and enhance your marketing reports and dashboards? Request a demo or sign up for a free trial to create a marketing report in just minutes.
8211