Swydo’s reporting platform helps you knit together all your crucial marketing data sources so you can report and share your results. But in a multi-channel marketing environment, how can you use it to make sense of complex customer interactions with your brand and digital channels? That is the challenge the team at Swydo laid down for me. I’ve been working in digital marketing for the last twenty years and have taught other marketers for the last six. What follows is the best solution I’ve found for charting progress and making smarter decisions… but understanding how to effectively do this has been a bit of a journey. Let me explain…
There is an old marketing adage that if I throw you one ball, you will catch it. If I throw you three balls, you will probably drop them all. The digital marketing world can feel like being pummelled with a continuous tennis ball launcher aimed right at you some days when you check in to see what’s new, what’s changed, what’s working and what needs attention. So how should you begin to take back control?
Know Where You Are Heading & How Fast
All too often digital marketers fail to set goals that can easily be connected back to business objectives. And all too often we fail to set objectives that can be effectively measured. And it’s so easy for business objectives to somehow live a different life from your marketing objectives, separated by different layers of team structure and meetings. This means we cannot judge the success of our campaigns and therefore it becomes impossible to calculate ROI and justify our digital marketing budgets and ongoing budget optimisation allocations.
To make your marketing dashboard truly useful, you need to start with your business objectives. What is it your business has set out to achieve? Bake this into your dashboard so it acts as a permanent reminder.
Your business objectives need to be nailed to the mast in front of your ship’s helm. Your marketing campaigns are the wheel your steer the ship by, but always with one eye on the business direction you have to steer towards. The channels and the marketing campaigns and tactics that will take your business to its required destination. Progress will be measured by the targets and KPI’s you set.
Why keep these elements so top of mind? Without regular reference to that compass the ship could soon end up on the rocks or in dire straights. Conditions in any market change. You will need to trim and adjust as you go. As any marketer knows it is never plain sailing. Bake both your business and marketing objectives into the very dashboard you look at continuously and keep things on track so you can adjust things as you go.
Your Marketing Dashboard
A well-designed marketing dashboard you can live, eat, and breath makes all the difference. When strategically focused it will enable you to face every ball aimed at you and catch it with confidence. What we will focus on in this article is sharing how we work through these issues using a Target Internet framework we call ‘The digital strategy measurement framework’ which your Swydo powered marketing dashboard can be based.
A good marketing dashboard brings with it many benefits. You get to monitor your progress but you do this with just the metrics and channel data that matter to you. You and your business objectives get to decide what needs to go into this work of art. There is no one size fits all, no cookie cutter template you can download. It’s a unique as your marketing and campaigns are and it will evolve as your marketing evolves. And it needs to be shared. Great or poor results need to be read, understood and action taken to improve any and every outcome.
Effective Measurement
To effectively measure the success of our campaigns, we need to start by deciding what we want people to do. For many online e-commerce businesses, it’s as simple as tracking the sales conversions directly from the marketing activity that lead to the sale. For sure, we also need to keep an eye on important micro conversions which will help us to fine tune and optimise our end results, but these should always be done with an eye on the bigger prize of conversions the business can calculate in bottom line terms. Using e-commerce tracking in analytics, you will be able to quickly build an end-to-end view of the marketing and purchase phases.
However, setting up conversion tracking for the activities which will align with our goals is not always so straight forward. You cannot always track the action of value for your business, but with analytics and call tracking solutions, you can get very close to good measurement.
For example, if our overall business objective is the sale of your product or service but the actual sales may well take place offline. Depending on how big a gap there is between what you can measure and what you need to achieve you may need to indulge in a bit of gap analysis to work out how best to report and measure results.
If this is you, we cover this in a bit more detail in our Digital Strategy Measurement framework.
We could still set an overall website objective to measure a lead filling in a form or picking up a phone and calling. Conversion data can then perhaps be tracked from our CRM system or call tracking system and tied back up with the first marketing activity that started the process. Swydo includes connectors for a couple of popular call tracking systems as well as for Salesforce CRM so there is a lot of flexibility you can work with here.
For a consumer brand, our overall business objective might be someone walking into a store or using an online store to buy the product. We may not own that website or bricks and mortar store. In this scenario, my primary objective might be to get prospective customers to engage with content to build awareness.
Every organization’s business and marketing objectives are of course different, but by understanding what our primary purpose is, we can then set up our analytics to measure this goal. Doing this gives us a direct measure of the success of any digital activities we are carrying out.
Channel Monitoring
The next stage in developing our reporting dashboard is considering each of the channels we are active in and find how that channel is driving these primary objectives. Your dashboard should be able to report on all of the channels you are engaged in, you just need to pick the metrics for the specific channels.
With 20 different connectors and growing, Swydo makes this process much easier by enabling you to pull in the metrics that matter to you and arrange them on a reporting dashboard, so they make sense and give you an indication of how well or poorly each channel has done in terms of contributing to your overall business success.
One of the key indicators will be how much traffic that channel is driving to your website or app, but there will also be several other indicators which you will want to include to create a full picture of how each channel is working. The following diagram gives you a little insight into the principal behind this model. The outline model below is arranged into three columns to provide you with a mental model of how it’s going to work, rather than an actual diagram of how it is physically laid out. (It also prints quite nicely on A4 when we produce handouts for our in-depth training courses for digital marketing).
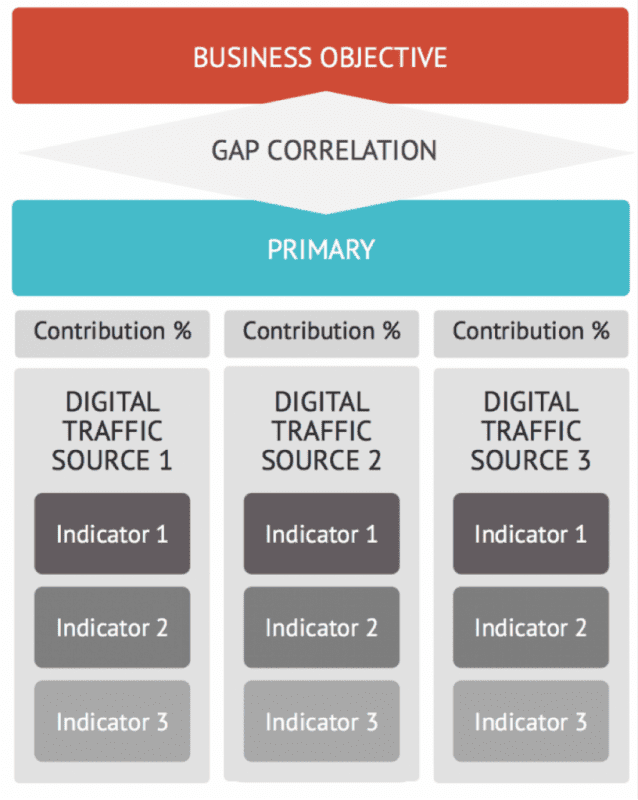
We tend to arrange each page of the report around a key channel we are tracking. However, it’s a great idea to also write out a few notes on strategy and objectives for each channel, so you stay focused on these every week and month. If the results you get are not what you need, you will need to change strategies and update these notes, so you have an ongoing picture to focus on.
If your dashboard reporting tool supports it, KPI target information can be extremely helpful to keep you on track. For any KPI box, you can set a target goal for that metric. These metric KPIs with goals give a great visual indication of how things are going. We are also a big fan of comparing like for like periods in our reports as a further indication of how things are performing. So for example, if I am running a report for April month to date, I can see how each metric compares to the same period last year and show how on track or off track things are for that channel. It’s super useful and gives you a quick view of which channels may about to result in dropped balls.
Monitoring & Optimising Using A Digital Strategy Framework
Let’s look at one channel in a bit more detail so you can understand how that looks in practice. If we look at our email marketing, we might investigate overall traffic driven by email as one of our performance indicators. However, we will also be measuring our open rate and click through rate as these are things we could improve to drive more traffic to our website from this channel. With a page for each channel, you will be able to build a very powerful email dashboard to monitor performance, pulling in lots of measurements and metrics to show how that channel is performing.
Be aware that as you drive more traffic from a digital channel, whether that is Twitter or email or anything else, it doesn’t mean that that traffic will convert into our primary objectives being completed. It would be relatively easy to gain lots of followers on Twitter, drive lots of traffic to our site and see no primary goal completed (because it was the wrong audience).
Therefore we need to build a contribution score into our model that tells us how much that channel has contributed towards our primary goals being completed. Thankfully, because we have set up our primary objectives as analytics goals, there is a report that does this for us, and that is the Google Analytics Multi-Channel Funnels report (MCF).
The MCF Report shows, of all the people that completed our analytics goals, which channels did they use on the way there (and it can look at this over some time, up to 90 days currently). Understanding what this is telling us is crucial, and the critical point is that the report shows all of the touchpoints that led to the goal, not just the last channel they interacted with. This is important because a journey through to completing a primary goal may include visiting the website many times and coming in from lots of different places. The report provides a contribution percentage so we can understand how each channel (or group of channels) is contributing toward the goals being completed.
To pull this data into Swydo, you have a couple of options. You could just simply take a screenshot and insert that into your report. Swydo supports custom text and graphics insertion.
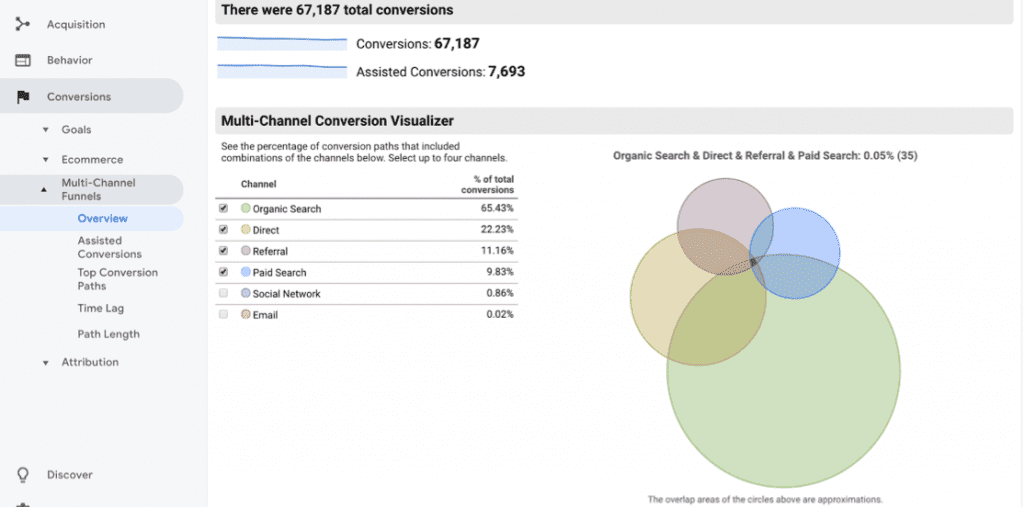
You can insert the Multi-channel Funnel Widget directly into your report which will give you an overall summary of which channels have contributed to both first click and Last click results.
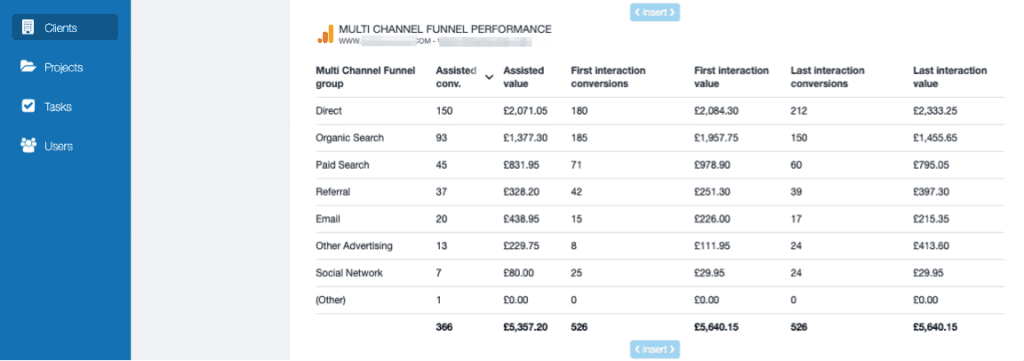
An example of the GA Multi Channel report widget for an e-commerce store pulled into Swydo.
However, sometimes it’s good to play with your data to fix it in your mind, so to include the % contribution as shown by the multi-channel funnel visualizer in Google Analytics, we opt for using manual KPI metrics and manually update these when we run the report. It only takes a few minutes, and the process of reading the data and inputting it into your report makes sure you don’t gloss over it.
As the percentage channel contribution needs to be manually updated in our dashboard, we also include a text note when we update the data. It’s a small but necessary step to make sure this process is never overlooked. You also get to input and see comparison data on performance which isn’t something Google Analytics reports can do. It does means running the multi-channel funnel report once for each period so you can grab the data, but it’s well worth doing because over time it’s so insightful. I’d also recommend it is something you shouldn’t delegate. This will force you to look at the results regularly and reflect on what they actually mean.
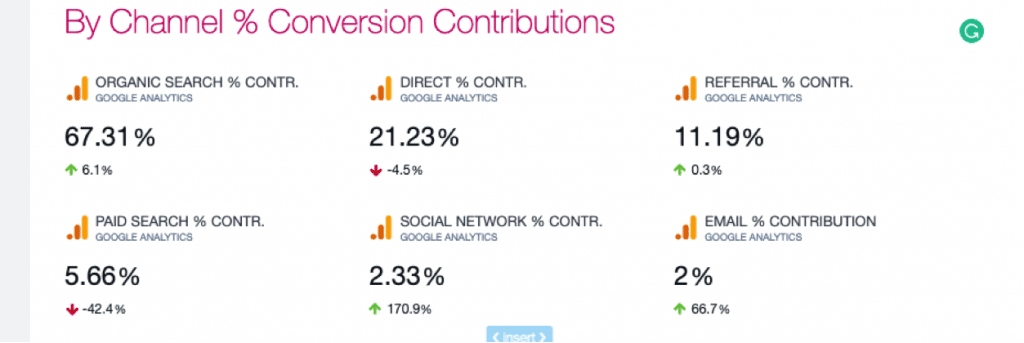
An example of Manual Metrics being used to compare % channel contribution for different channels this year vs same period last year.
Having this information means that we can now add a contribution percentage to our measurement framework. We can then measure not just amount of traffic each channel is driving, but how much of this traffic is contributing to our primary objectives. This contribution percentage taken directly from our MCF report allows us to look not only at how active a particular channel is, but also to look at how that channel impacts the overall picture of contribution and how channels are interacting together.
It’s valuable to compile this report every week and see how changes and adjustments to each week’s activity can have surprising effects on other seemingly unrelated channels. Running this regularly will help you to understand how audiences for different channels overlap. You begin to recognise that tweaks and adjustments to your campaigns on one medium can have a dramatic effect on other channels because each medium is reaching big swathes of the same people. Your audiences may be segmented up in analytics into different channels based on the last thing they clicked on, but in reality is that as customers our interactions with content on different channels are promiscuous.
Without the insights the MCF report gives, it’s very easy to get obsessed with channels which favour last click conversions and to ignore the important channels that reach a broader audience who later convert through those channels. Google Ads campaigns can be terrible goal hangers when it comes to racking up last click conversions that were started by other channels. If you don’t believe that, then take a look at how valuable your brand name Google ads are and ask yourself “How did those people know to search for my brand name?” A natural look at the multi funnel attribution report will help you stay grounded on what’s driving your marketing success and help you to learn when combinations of efforts across different channels drive success.
Fine Tuning Through Day To Day Use
Once we have our dashboard data being updated on a regular basis, we can now look at which channels seem to be contributing well or poorly to our objectives. Once we have focused in on a channel, we can look at which indicators we may be able to adjust to improve things. This will allow us to develop new tactical campaigns that may, for example, grow our email list, strengthen our open rate, get us more social media followers, or improve any of our channel’s indicators. Once we have done this, we can see what impact this has on the channel’s contribution percentage and then continue to iterate through this process.
Flexible Reporting
One of the great things about the Swydo reporting suite is that although you may have one master report you look at and consider each week, it’s very easy to create multiple reports that focus on different channels. Not everyone in a large team will be focused on cross channel marketing, and it’s great for them to get the measurements and results that mean something to them and track their progress towards the goals they are focused on. These can, of course, be automated and scheduled to go out to the right individuals, teams or departments. The beauty of this is that everyone will be looking at the same data as the reports hinge on the reporting timeframe you set, and this can be controlled when you schedule delivery.
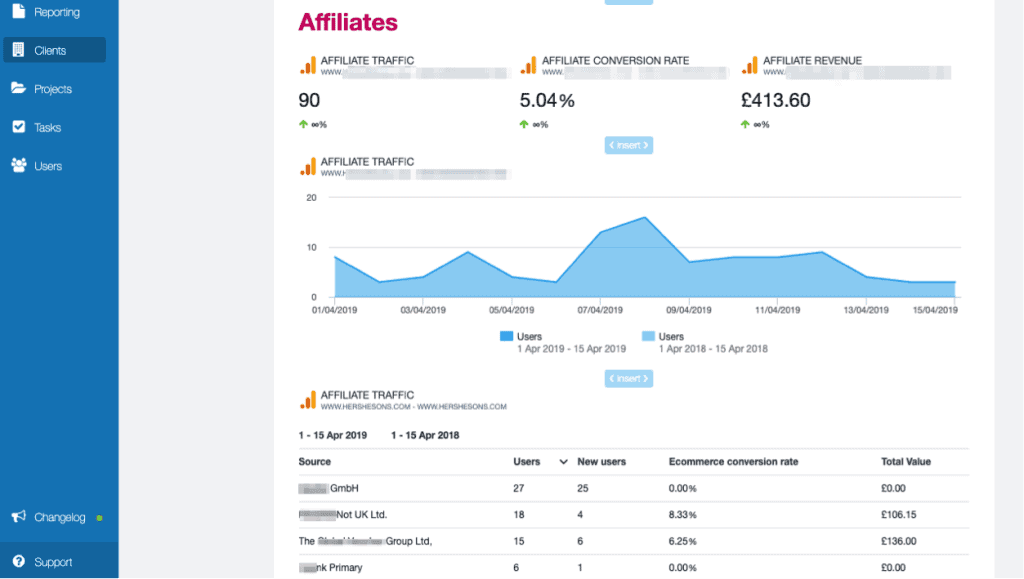
An example of an affiliate channel activity dashboard reporting year-on-year changes in results via the Swydo interface.
So get creating and start to fine-tune your ultimate marketing dashboard. If you haven’t done this before you will be amazed at how much time can be saved merely by having all the information you need sautomatically knitted into the right place. And once it’s built, you really can focus on your targets and continue week on week, month on month, quarter on quarter and year.
Would you like to see how easy it is to set up marketing dashboards using Swydo? Schedule a personalized demo today. Or, if you want to really dive into the features, try our 14 day free trial.
Read more about Target Internet’s Digital Marketing Strategy Framework.
Bio:

Experienced digital marketer and co-host of Target Internet’s Digital Marketing Podcast, Ciaran has been practising and developing digital marketing techniques and strategies for the last 20 years. He has helped organisations of all types to use digital marketing effectively, working with a wide range of businesses, from start-ups through to global clients. Ciaran’s career has covered work in both B2B and B2C markets as well as work for non profit organisations. He has worked for and trained a large number of international brands including Vodafone, The CIM, Elemis, Liz Earle, The Sustainable Food Trust, Hershesons, REN Skincare and FatFace. You can connect with him on LinkedIn.
