
Every minute counts in a marketing agency. But what if your reporting tool was quietly wasting hours of your team’s time each week? If you rely on Google’s Looker Studio to turn large amounts of data into performance reports, this may already be your reality.
Since 2016, Looker Studio — previously known as Google Data Studio — has become a preferred tool for marketing agencies. The platform connects with various data sources, such as Google Analytics, Google Ads, and Facebook Ads, to transform raw data into visual reports. It’s a popular option due to its flexibility, customization options, and cost-effectiveness.
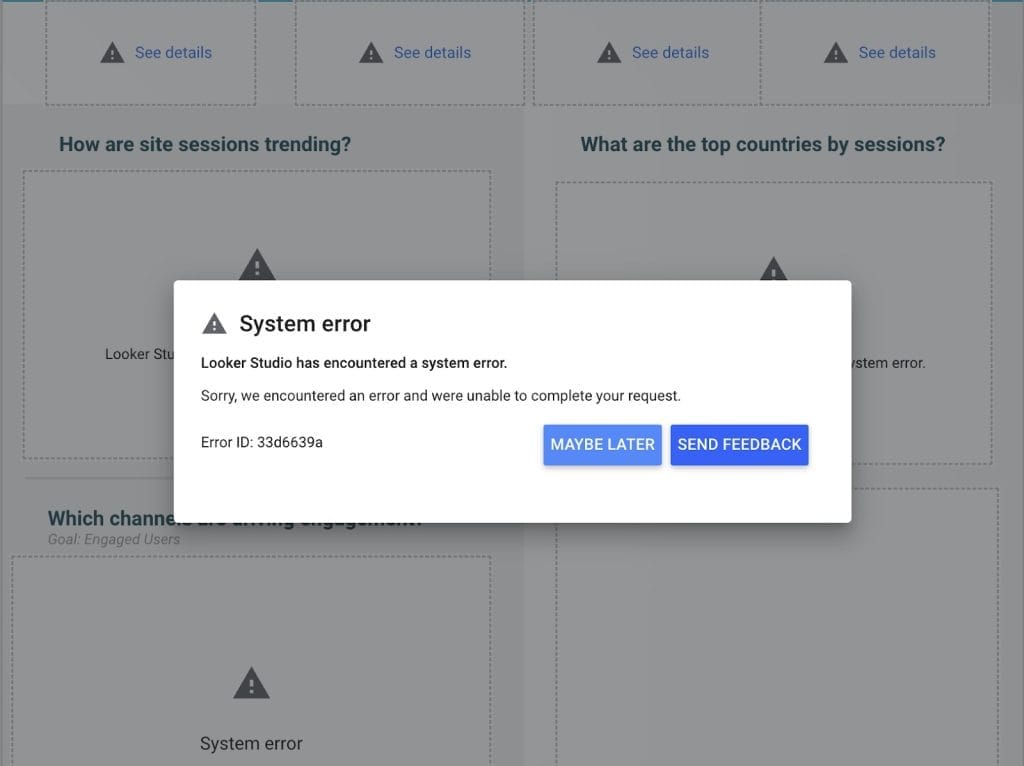
Despite wide adoption, Looker Studio was never the fastest reporting tool. Recent reports from users suggest it may be getting even slower, especially for large data volumes. This is a problem for marketing agencies scaling workloads and customers and generating more and larger performance reports.
Consider a report with 100+ entries. It must aggregate large amounts of data from many sources, draining computing resources and slowing down load and export times. Ultimately, this wastes valuable time and lowers productivity in marketing agencies.
In this post, we’ll provide an overview of Looker Studio, investigate why your reports may not be loading as fast as you desire, pinpoint the culprits, and show you how to optimize reporting in your organization.
Why Agencies Use Looker Studio
Looker Studio is Google’s free cloud-based platform for data visualization and reporting. Users can generate customizable, interactive dashboards and reports based on connected data sources such as Google Analytics, Google Ads, and Facebook Ads, along with custom databases.
Looker Studio offers several capabilities useful to marketing agencies:
- Customizable branding – Agencies can create white-labeled reports, adding a client’s branding elements with custom colors, logos, fonts, and layouts.
- Auto-refresh data updates – The platform supports automatic data refreshing at set intervals.
- Advanced analysis – Looker Studio allows the creation of custom-calculated fields and supports data blending from multiple sources.
- Cost-effectiveness – Agencies can utilize advanced reporting features without additional costs (as long as they stick to native Google connectors).
But despite these strengths, Looker Studio wasn’t built for agencies managing dozens or hundreds of client accounts. As reporting needs grow, so do the platform’s performance bottlenecks.
How Looker Studio Works
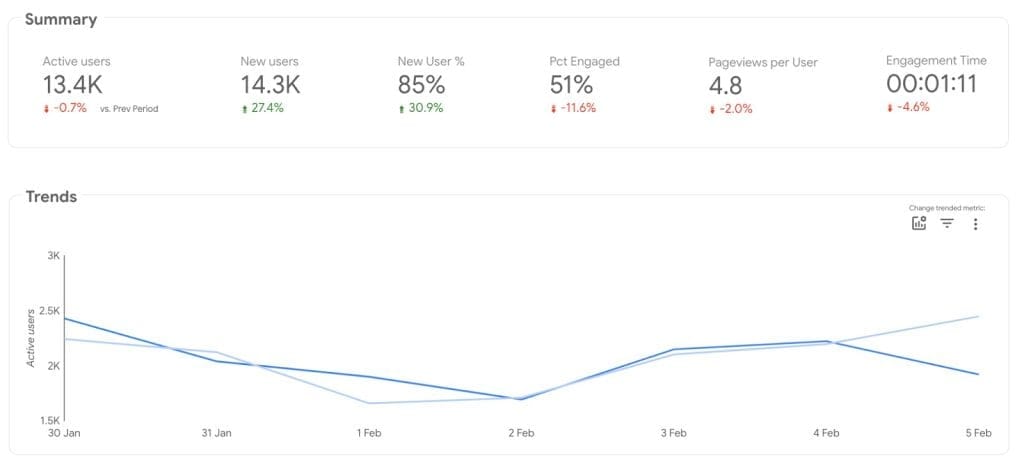
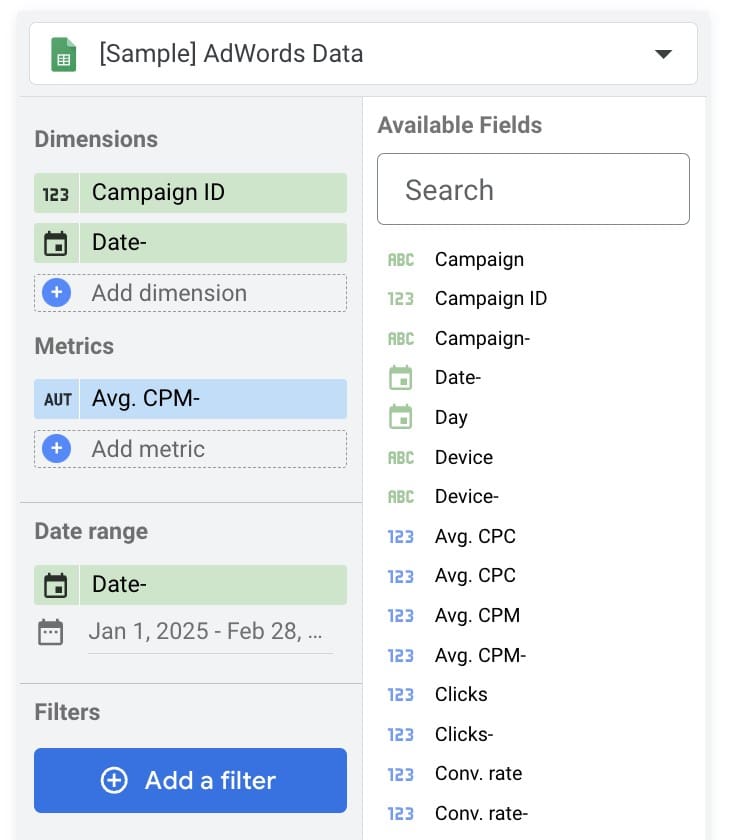
Looker Studio links to multiple data sources via built-in and third-party connectors, so users can visualize data from diverse platforms. Users can add this data to charts, graphs, and tables in customizable dashboards.
Real-time data analysis and reporting capabilities allow agencies to display key performance indicators with no manual work. However, as agencies scale, more frequent slowdowns and inefficiencies hinder workflows and hurt client services.
When The Pace Picks Up, Looker Studio Slows Down
While Looker Studio has a lot of useful features for creating data-driven reports, users have found that its performance varies. Here are the most common factors that can potentially degrade the platform’s speed and efficiency.
1. Data Size
Large datasets can significantly affect Looker Studio’s performance, requiring more processing power and slowing report loading times.
To process reports, Looker Studio runs multiple simultaneous SQL queries across data sources, retrieving, filtering, and aggregating data in real time. As query volume increases, competition for processing power slows recalculations, filter applications, and visual rendering, resulting in longer load times and delayed exports.
2. Dashboard Complexity
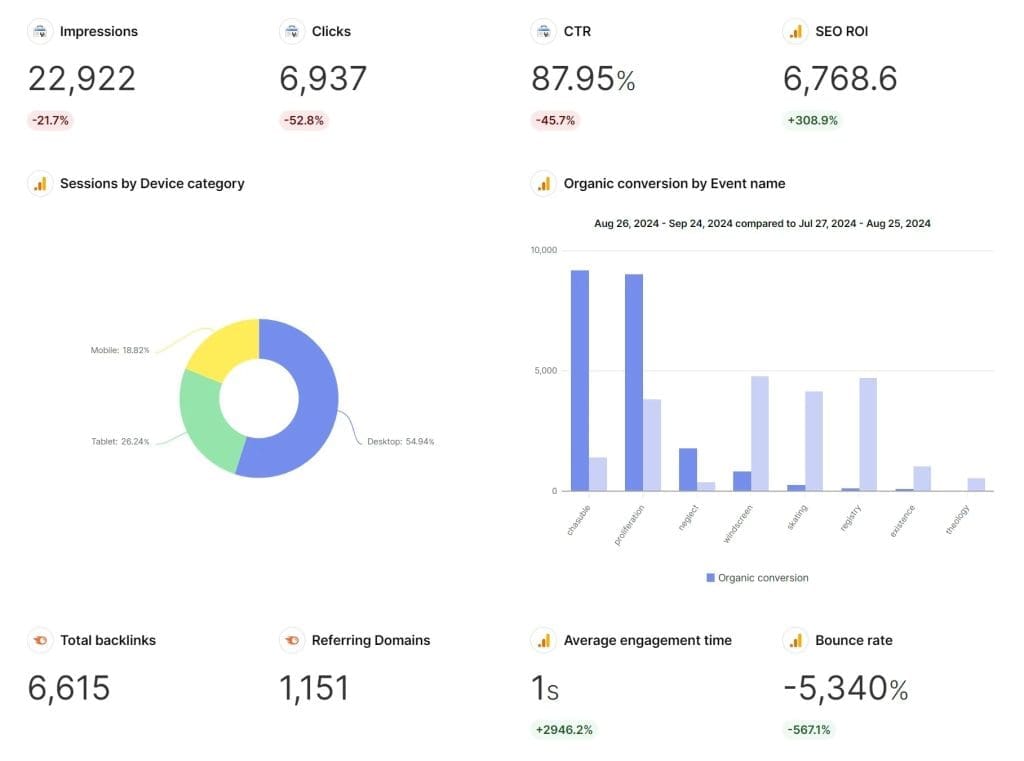
Complex dashboards featuring numerous visualizations, intricate calculations, or multiple filters can increase the processing load on Looker Studio. Such reporting complexity can also result in slower performance and longer loading times.
Google recommends limiting the number of dashboard elements, such as charts, tables, and text boxes, because dashboards with 25 or more tiles often face slower-than-expected performance.
3. Type of Connections
The nature of data source connections plays a crucial role in performance. Live connections to data sources may introduce latency, especially if the source systems are slow or experience high demand. This latency can cause delays in data retrieval, affecting the real-time data delivery in your reports.
Utilizing native connectors, which are more stable and efficient by nature, can help mitigate these issues. However, built-in data sources might limit your reporting capabilities, as Looker Studio focuses only on reporting capabilities within Google’s ecosystem (we’re talking about Google Analytics, Google Ads, Google Sheets, and other tools).
4. Number of Data Queries
A high volume of simultaneous data queries can increase system resource usage, leading to longer report loading times. In Looker Studio, a data query refers to the specific SQL code that Looker generates and executes against your connected database to retrieve the desired information.
Inputting lots of data at once can strain the system and slow down report loading. When generating a report, Looker Studio creates SQL queries to fetch data from your connected databases. Actions like loading a chart or applying a filter often trigger simultaneous queries, which can bring things to a crawl. Limiting the number of queries running at the same time allows some control over speed and responsiveness.
5. Browser and Network Limitations
Browser-related issues can significantly affect Looker Studio’s performance. Incompatible extensions or add-ons may cause the platform to stop working or behave unexpectedly.
Additionally, network latency can impact the time it takes to retrieve data from external sources or to load dashboards and reports.
6. Device Performance
Specifications like your device’s CPU and memory capacity can significantly impact Looker Studio’s efficiency.
Older devices with limited resources can slow down dashboard rendering, leading to delays in data visualization. It’s essential to ensure that the hardware and software used meet the requirements to handle the data processing in Looker Studio.
7. User Behavior
User behavior, such as running multiple tabs or background applications, can slow down Looker Studio
These tasks consume system resources, leading to slower performance and increased dashboard or report loading times.
8. Other Factors
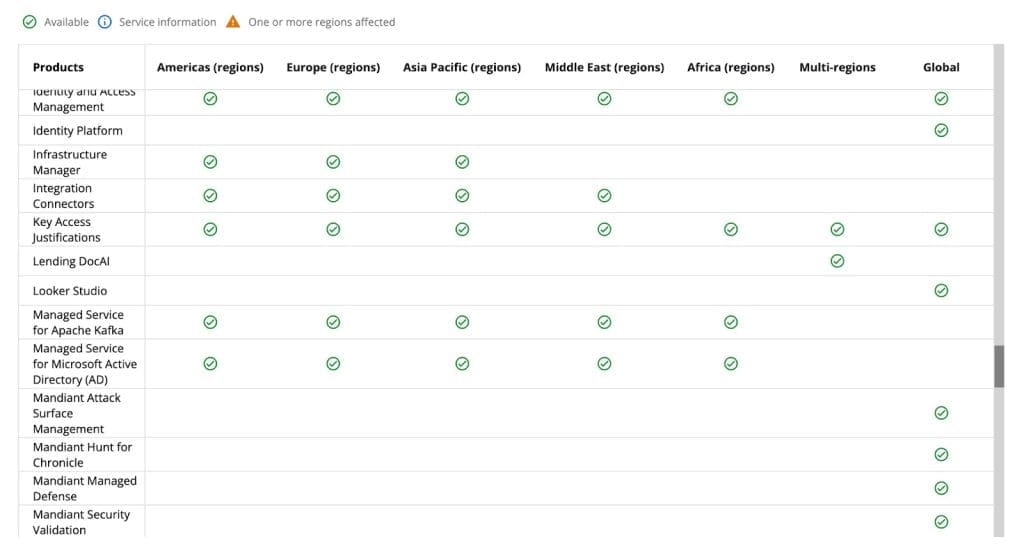
Server-side issues, such as the responsiveness of third-party data connectors, can significantly impact Looker Studio’s performance. While you can’t control these factors, you can at least stay informed to help pinpoint the cause of slow performance.
If you run into issues with Looker Studio or your report won’t load, the culprit may be on Google’s end. You can always check Looker Studio’s server status on the Google Cloud Service Health dashboard.
How To Optimize Looker Studio Performance
Those extra seconds and minutes waiting for reports to load and export really add up. Do the math: Reporting Tool A processes reports (including load and export times) in 20–60 seconds. On the other hand, Tool B does the same in 2–6 minutes.
An agency using Tool B to process 5–10 reports per staffer per day is wasting 20–80 minutes each day per employee. For a team managing 100+ clients, this inefficiency scales to 30+ labor hours per week or 120+ hours per month — time they could spend adjusting strategies, meeting with clients, and creating better campaigns.
To conserve valuable time, marketing agencies experiencing slowdowns in Looker Studio have found strategies to mitigate performance issues. Here are some proven tactics to improve report loading times.
Pre-aggregate Your Data
Pre-aggregating data at the source can reduce processing load during report generation. Steps to Pre-aggregating data at the source can reduce processing load during report generation. Take the following steps to optimize data aggregation:
- Find metrics that you can aggregate without sacrificing important details.
- Use tools like Google Sheets or Power BI to gather and organize your data before bring it into Looker Studio.
- Store aggregated data in an SQL database or Google Sheets.
- Connect the database to Looker Studio via MySQL or Google Sheets integration.
- Ensure data models reflect these aggregations for consistency.
Reducing the volume of data processed directly in Looker Studio can significantly improve report speed.
Simplify Your Dashboards
Complex dashboards can slow down Looker Studio. To optimize performance:
- Include only essential charts and graphs to highlight key metrics.
- Perform complex calculations outside of Looker Studio when possible.
- Apply necessary filters but avoid excessive filtering, as multiple filters can slow performance.
When simplifying reports, align with clients to ensure key performance metrics remain intact.
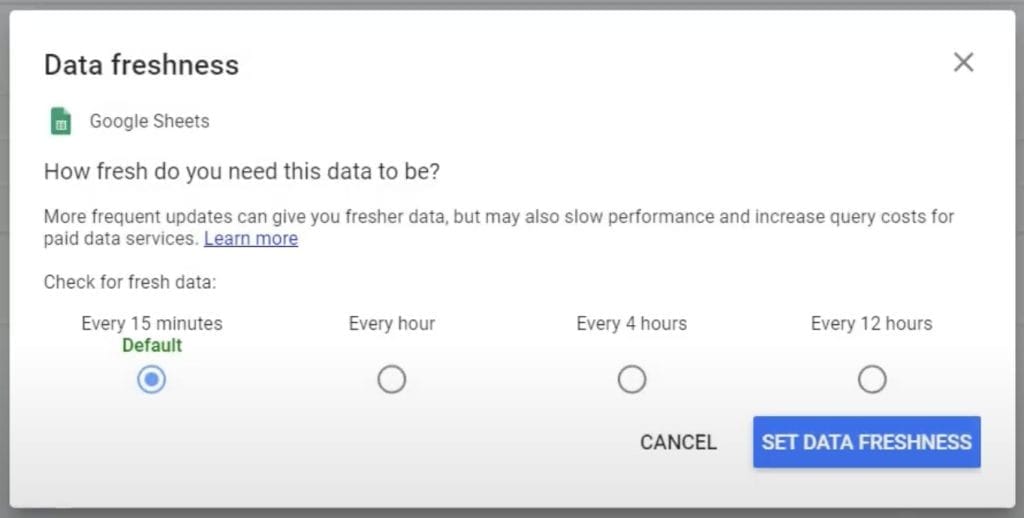
Adjust Data Freshness Rate
Reduce the frequency of data refreshes to decrease the load on live data connections and improve dashboard responsiveness. To adjust the refresh rate:
- Open your Looker Studio report and navigate to the data source settings.
- Locate the Data freshness option.
- Set a longer refresh interval that aligns with reporting needs (e.g., changing from hourly to every 12 hours).
- Save the updated settings.
This adjustment reduces unnecessary data processing while keeping reports up to date.
Limit Widgets Per Page
Too many widgets (charts, tables, etc.) on a single page can degrade performance. To optimize dashboard responsiveness:
- Assign data sources to specific pages to ensure only necessary metrics load at a time.
- Keep navigation clear between pages for a seamless user experience.
Balancing data presentation with performance optimization improves usability.
Use Data Extraction
The Extract Data connector allows marketers to create static snapshots of their data, reducing reliance on live queries. To use it:
- In Looker Studio, click Create and select Data Source.
- Choose Extract Data from the connectors list.
- Select required dimensions and metrics, apply necessary filters, and set a refresh schedule.
- Save and extract the data for use in reports.
This method significantly reduces the load on large datasets with live connections, making dashboards faster.
Clean Your Browser’s Cache
Regularly clear your browser cache to prevent outdated files from affecting Looker Studio’s performance.
For Google Chrome:
- Click the three-dot menu in the upper-right corner.
- Navigate to Settings > Privacy and Security > Clear browsing data.
- Select a time range (e.g., “last 7 days”) and check the boxes for Cookies and other site data and Cached images and files.
- Click Clear data.
For Microsoft Edge:
- Click the three-dot menu in the upper-right corner.
- Navigate to Settings > Privacy, search, and services.
- Under Clear browsing data, click Choose what to clear.
- Select a time range and check the necessary boxes.
- Click Clear now.
For Mozilla Firefox:
- Click the three-line menu in the upper-right corner.
- Navigate to Settings > Privacy & Security.
- Scroll to Cookies and Site Data, then click Clear Data.
- Check the necessary boxes and click Clear.
Keeping browsers updated also helps maintain performance.
Where Agencies Hit The Wall With Looker Studio
As agencies scale, Looker Studio’s performance issues become more than annoying. What begins as a flexible, free reporting tool eventually turns into a bottleneck; slow load times, disconnected data sources, and complicated workarounds eat up hours daily. For agencies managing multiple clients and handling many large reports daily, these pain points can impact productivity and hurt client experience.
When Should Agencies Consider Switching?
If Looker Studio is slowing down workflows instead of streamlining them, it might be time to reassess reporting needs.
- Are reports taking too long to load?
- Is too much time spent manually integrating data?
- Is troubleshooting performance issues becoming a routine task?
- Are third-party data connectors often down or unreliable?
- Are inefficiencies wasting time and lowering productivity?
When inefficiencies and unreliable performance start hurting business, switching to a platform designed for marketing agencies can make all the difference.
Purpose-built for marketing agencies’ workflows, Swydo is data visualization without the compromises of generic tools. With its user-friendly drag-and-drop interface, you can create custom-branded performance reports with reliable speed and consistent performance.
Swydo’s client reporting features eliminate many of the pain points agencies experience with Looker Studio. Here’s how:
- Time-saving, ready-made reporting templates for PPC, SEO, and social media.
- Over 30 built-in data connectors reduce the need to buy third-party add-ons.
- Drag-and-drop reporting makes customization effortless.
- Automated report scheduling ensures timely delivery to clients.
- Data source health check ensures connections run smoothly.
- Reliable speed can save up to 100+ hours per month vs. Looker Studio.
Explore our blog to learn how to optimize data reporting in your marketing agency and choose the best Looker Studio alternative.
Bottom Line
When Looker Studio handles large datasets, complex dashboards, or multiple data queries, slow reports and errors are inevitable.
To Improve Performance:
✅ Aggregate data before importing.
✅ Simplify dashboards by limiting unnecessary elements.
✅ Adjust data freshness rates.
✅ Use the Extract Data connector for static snapshots.
✅ Extend data refresh intervals.
✅ Distribute data sources across different pages.
✅ Regularly clear browser cache.
Use the pointers in this article to get the most out of Looker Studio’s core functionality. But bear in mind: high-growth agencies often realize that specialized marketing reporting tools better suit their changing needs. If you’re already shopping for Looker Studio alternatives, leverage the free trials of advanced reporting platforms like Swydo.
Speed up your client reporting with Swydo’s reliable performance.
Try Swydo Free