
X analytics break down into seven things agencies report on: impressions, reach, engagement rate, follower growth, video completion, posting time, and link-driven traffic. Six of the seven need an X Premium subscription at $8 a month, either directly or through the numbers they’re calculated from. The seventh, link clicks, isn’t in the dashboard at all, on desktop or with Premium, and that changes how you report on it.
This guide walks through all seven, what each one tells a client, and where X’s own numbers can mislead you if you don’t know how they’re calculated.
How to Access X Analytics in 2026
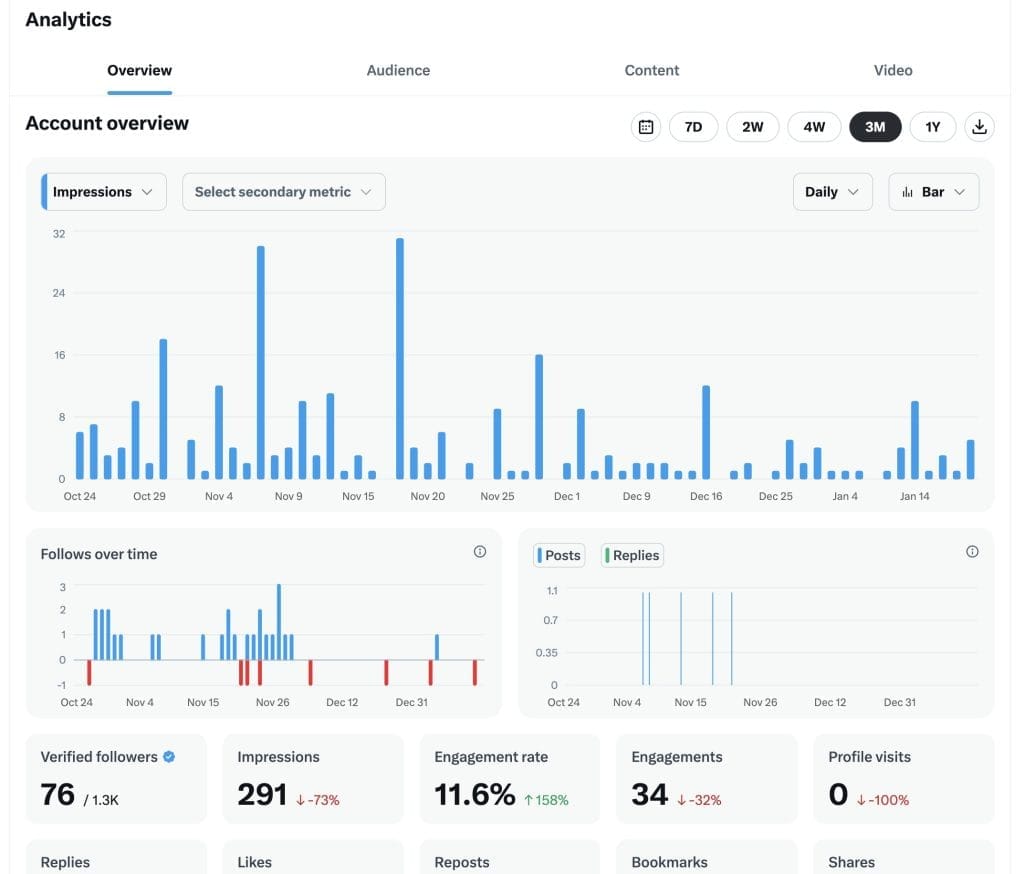
Go to your X profile and open Premium from the left-hand menu, then select Analytics. You’ll need an active Premium subscription, starting at $8 a month on the web. Basic, the cheaper $3 tier, doesn’t include it.
Without Premium, you’re not locked out entirely. Open any individual post and tap the three dots for impressions, likes, replies, and reposts on that single tweet. It’s slower than a dashboard, but it’s free, and it’s the only path on mobile regardless of subscription tier.
Once you’re in, you can switch the account overview between a handful of preset date ranges. Screenshot the exact options before you publish anything that names them specifically. X changes this UI often enough that a written description goes stale faster than the numbers do.
Metric
What It Tells You
Where To Find It
1. Impressions
How many times a post was seen, including repeat views
X dashboard, Premium required
2. Reach
Estimated unique viewers, calculated not reported
(Impressions ÷ Followers) × 100
3. Engagement Rate
How many people acted relative to how many saw it
X dashboard, Premium required
4. Follower Growth
Net new followers and the shape of that trend over time
X dashboard, Premium required
5. Video Completion Rate
Share of viewers who watch a video all the way through
(Completed Views ÷ Total Views) × 100
6. Best Time to Post
Days and hours your audience is most active
X dashboard, Premium required
7. Link Clicks & Website Traffic
Whether X content actually drives site visitsNot in the dashboard
UTM-tagged links, read in Google Analytics
1. Impressions
Impressions count how many times a tweet appeared on someone’s screen. X provides the number directly in the dashboard, no calculation needed.
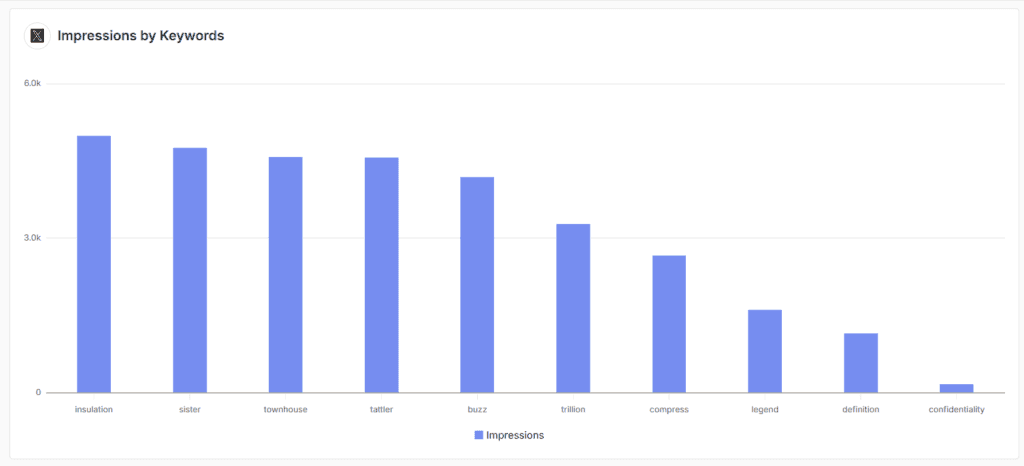
The catch: impressions aren’t unique views. Someone who scrolls past the same tweet three times generates three impressions. A high number looks good in a screenshot and tells you almost nothing about how many actual people you reached, which is exactly what the next metric fixes.
Common pitfall: reporting impressions alone as a headline number. Pair it with reach or engagement rate, or a client will assume every impression was a different person.
2. Reach
Reach is the count of unique people who saw a tweet, regardless of how many times each of them saw it. X doesn’t report this number directly.
The workaround agencies use is:
Say a tweet gets 1,000 impressions on an account with 10,000 followers: that’s a 10% estimated reach. Treat it as a rough gut-check, not a real number. The math assumes every impression came from a follower seeing the tweet once, and neither half of that is true. Retweets and hashtags put your content in front of people who don’t follow the account, and a single follower scrolling past twice inflates the count. The estimate can land far off in either direction, so use it to spot trend direction, not to report a precise reach figure to a client.
3. Engagement Rate
Engagement rate measures how many people acted on a tweet relative to how many saw it:
Likes, replies, reposts, and bookmarks all count as engagements.
Here’s where most agencies get burned. Search “X engagement rate benchmark” and you’ll find numbers anywhere from 0.03% to over 1%, and none of the sources are lying. They’re just answering different questions. This gets its own section below, because the mismatch is common enough to be worth walking through in full rather than a footnote.
4. Follower Growth
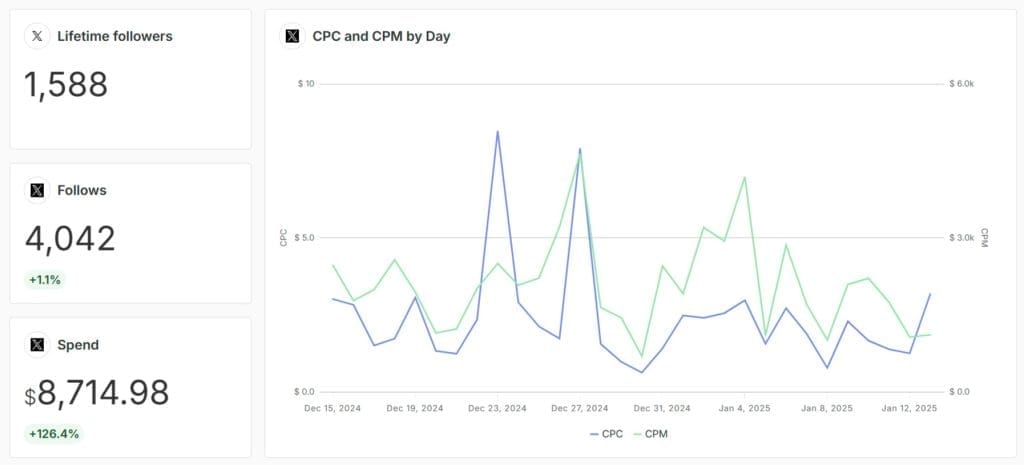
Follower growth is net new followers over a period. Total followers minus total following gives you a simple net number, but the trend over time matters more than any single snapshot.
A steady climb means content is resonating. A spike usually traces back to one viral post or a paid push; a dip usually means something changed, whether that’s posting frequency, content direction, or a platform-wide shift affecting the whole account category. Look at the shape of the line before you decide what caused it.
5. Video Completion Rate
Video completion rate is the share of viewers who watch a video all the way through:
A low completion rate almost always means one of three things: the video runs too long for its content, the opening few seconds don’t earn the watch, or the storytelling loses people partway through. Compare completion rate across your own video library before you compare it to an industry number. Benchmarks for this metric vary too widely by format and length to be a reliable external yardstick; your own account’s history is the more honest comparison.
6. Best Time to Post
X’s native analytics shows which days and hours your tweets tend to pick up the most impressions. It’s a starting point, not a strategy on its own.
Test posting times against your own audience’s activity rather than a generic “9 AM Tuesday” rule pulled from a blog post. A B2B account and a consumer brand will show completely different peak windows, and those windows shift as a follower base grows. Revisit this every few months instead of setting it once.
7. Link Clicks and Website Traffic
This is the one metric on this list you can’t pull from X’s dashboard, and it’s worth being direct about why. Link click data isn’t shown in the account overview, in aggregate, or per post, on desktop, even with Premium. The only place it surfaces at all is on an individual post’s stats, and only through the mobile app.
So how do you actually report on X-driven traffic? Tag every link you share with UTM parameters and pull the numbers from Google Analytics instead. That gives you sessions, bounce rate, and downstream conversions tied specifically to X, which is a more useful set of numbers for a client than a raw click count would have been anyway. A thousand clicks with a 90% bounce rate isn’t worth reporting the same way as 500 clicks that convert.
Common pitfall: promising a client “link click tracking” as a standalone X metric. Frame the conversation around website traffic and UTM tagging from the start, and you won’t have to walk it back later.
Why Your Engagement Rate Won’t Match Published Benchmarks
Two engagement rate benchmarks can both be correct and still disagree by 60 times. The formula is the reason, not the data.
X’s own dashboard, and the formula in the metric above, divides engagements by impressions. The 2026 Social Media Industry Benchmark Report, the same benchmark long published under the Rival IQ name before the two companies combined their research, calculates its industry medians by dividing interactions by follower count instead. Those are two different denominators measuring two different things, and a number built one way isn’t a fair comparison for a number built the other way.
That’s why you’ll see an X engagement rate quoted anywhere from a fraction of a percent to well over 1%, depending on which formula and which account size produced it. Smaller accounts post one way and land higher on a followers-based formula; a large brand account with a huge follower count and modest per-post interaction can look artificially low by that same math. Neither number is wrong. They’re not measuring the same thing.
The practical fix: pick one formula, apply it consistently across every client and every reporting period, and compare a client against their own history rather than against a published industry figure calculated a different way. That’s the only comparison that’s actually apples to apples.
| Formula | What it rewards | |
|---|---|---|
| Impressions-based (X’s own dashboard) | Engagements ÷ Impressions | Content that earns action from the people who actually saw it |
| Followers-based (most published benchmarks) | Interactions ÷ Followers | Smaller, tightly engaged audiences over sheer reach |
How X Reporting Breaks Down Past a Handful of Clients
X’s API returns only the past 30 days of post data. That’s not a lag. It’s a hard cutoff, and it turns a missed reporting cycle into permanent data loss.
Onboard a client in March and pull their X data for the first time in June, and January and February aren’t there to backfill. They’re gone. The same thing happens quietly when a client revokes account access, a token expires, or nobody notices a connection has been sitting broken for five weeks. A tool you check weekly across two accounts will catch that fast. A tool you’re supposed to check weekly across forty accounts won’t, because nobody actually opens forty dashboards every week.
X’s 30-day API window: what’s retrievable versus what’s gone
Still retrievable
Permanently gone
This is where connection monitoring stops being a nice-to-have and becomes the thing standing between you and a permanent gap in a client’s report. Swydo’s Data Health Check flags a broken or stale X connection through an Alert the day it happens, not five weeks later when a client asks why their tweet history looks thin. You find out before the 30-day window closes on data you’ll never get back, instead of after.
Organic and Promoted Are Not the Same Number
A tweet’s performance changes completely depending on whether ad spend pushed it in front of people. One blended engagement number for the whole account hides which result your organic content earned and which one you paid for.
X’s own analytics separates promoted and organic tweets, and Swydo’s X Analytics integration carries that same Promoted versus Organic filter into your reports. Use it. A client crediting their content strategy for a number that was actually bought with ad spend is going to expect that number again next month for free, and you’ll be the one explaining why it didn’t happen.
Matching Metrics to What Your Client Actually Wants to Know
Clients don’t ask about impressions or engagement rate. They ask whether X is working. The metrics above only answer that question once you connect them to the actual business goal behind the ask.
A client asking about brand awareness wants impressions and reach, not a raw follower count. One asking about audience quality wants engagement rate and reply sentiment, not total likes. One asking about pipeline wants website sessions and conversions tied to X traffic through UTM tagging, not a click count that was never trackable to begin with. Get specific about which question you’re actually answering before you pick which number to lead with.
“Is this actually building our brand?”
Lead with Impressions and estimated reach
Not this Raw follower count on its own
“Do people actually care what we post?”
Lead with Engagement rate, plus reply sentiment
Not this Total like count by itself
“Is X sending people to our site?”
Lead with UTM-tagged sessions and conversions in GA4
Not this A link click count X never gave you
“Is the account actually growing?”
Lead with Follower growth trend over the full period
Not this A single day’s follower snapshot
That reframing is most of what turns a metrics dump into a report a client reads and trusts, and it’s the same conversation that shapes broader social media ROI reporting across every channel, not just X.
Building This Into Your Client Reports
A reports-only tool like Looker Studio doesn’t watch a client’s data between rA reports-only tool like Looker Studio doesn’t watch a client’s data between reports. Someone still has to open each dashboard by hand and hope a connection hasn’t quietly gone dark. That routine doesn’t get easier as the client list grows. Five clients is manageable. Fifty means the same manual check, multiplied by ten, with nothing built in to shortcut it.
Swydo’s Monitoring suite is built around that gap:
- Metrics Overview puts up to six key metrics from every client on one screen, so you’re not opening forty dashboards to see forty numbers.
- Goals shows every client’s targets as On Track, Off Track, or Achieved from a single Monitoring → Goals view, instead of doing that math by hand for each one.
- Alerts flags a metric the moment it moves out of bounds, so you’re not scanning for a problem that already happened.
- Data Health Check catches a broken connection the day it fails.
Looker Studio and most tools like it stop at the report. Swydo keeps checking the numbers and the connections after it’s sent.
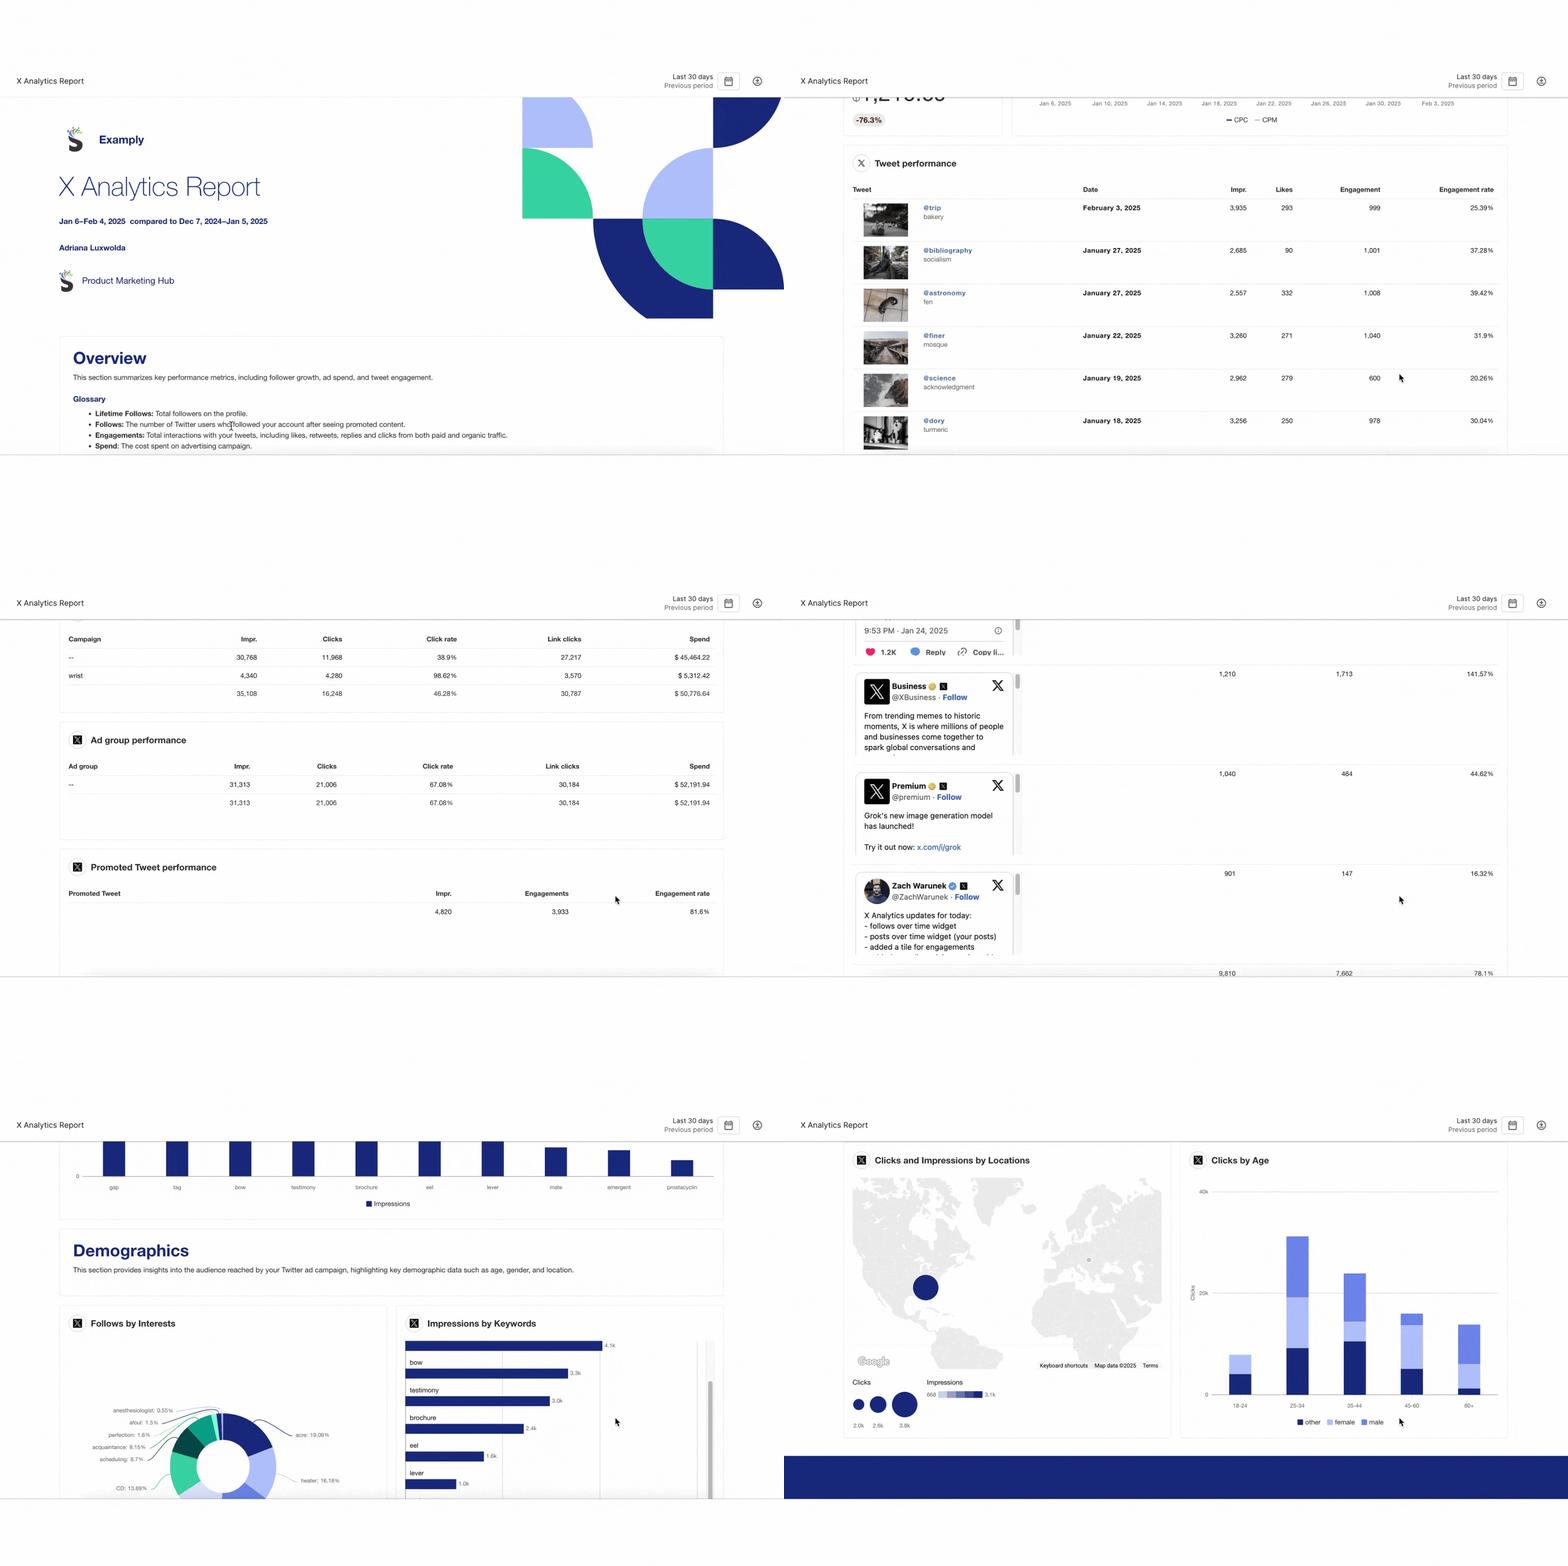
The report itself takes less setup. Swydo’s X Analytics report template pulls impressions, engagements, engagement rate, profile visits, follower counts, and the rest directly from the connected account, refreshed on whatever schedule you set. Pair it with your client’s Instagram organic metrics and TikTok organic metrics in the same report for a single social view instead of stitching together exports from three platforms by hand.
If the client runs paid on several networks, a Combined Data Sources widget merges up to five ad platforms into one, so X Ads spend lands in the same blended cost-per-result row as Google Ads and Meta. With 38 integrations and more being added, the practical limit on a cross-channel report is usually which platforms the client runs rather than which ones your tool supports.
Giving Clients One Place to Find All of It
Clients don’t want another link. Most of them have a PDF in their inbox, a dashboard URL in a Slack thread from March, and a shared drive folder, and they open none of them consistently.
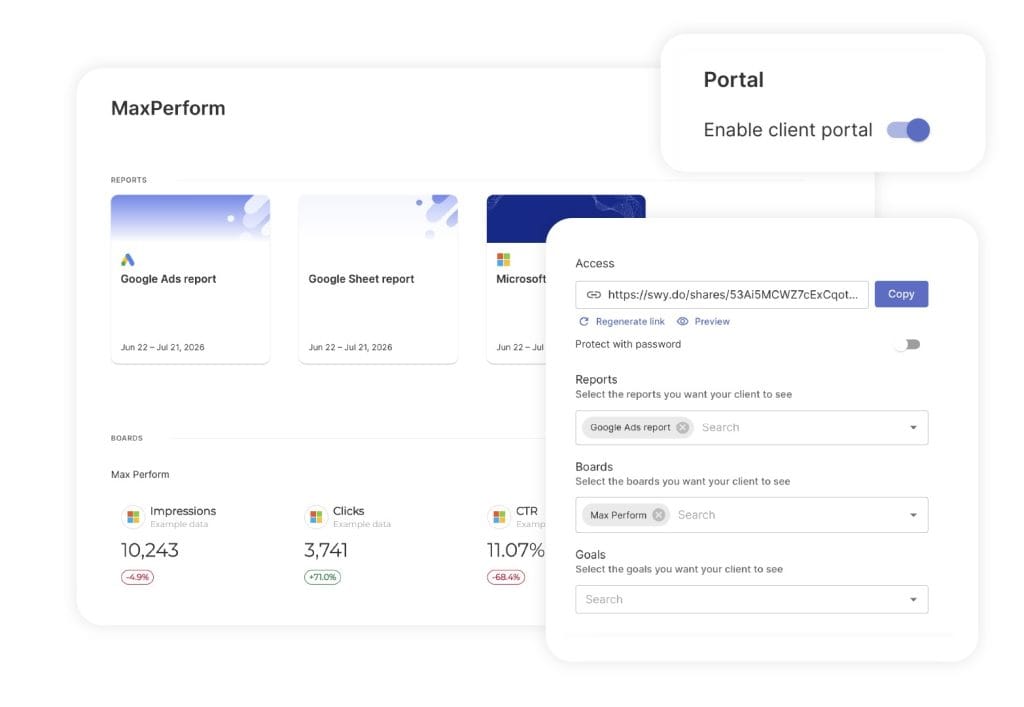
Swydo’s Client Portal combines Reports, Boards, and Goals into one secure link per client. Reports carry the detailed X performance, Boards give the quick KPI read, and Goals let the client watch progress against their own targets without asking you for a status. Pick exactly what that client sees, preview it before you send it, and add a password when the account warrants it.
If the link needs to be revoked because an in-house marketer left or a contract ended, regenerate it and the old URL stops working immediately. Update the contents whenever the client’s reporting needs change, without issuing a new link.
Open the client’s account, go to the Portal tab, enable it, select the Reports, Boards, and Goals you want to share, and send the link. That’s also where “can you send me the numbers for last Tuesday” stops being an email you have to answer.
Letting Clients Ask the Report Questions
Swydo AI runs inside client-facing dashboards, so a client can ask the report a question instead of asking you. Turn it on under Settings and clients get summaries and insights generated from their own data, including every X metric above.
Understand the cost model before you switch it on across every account. Your plan includes 4,000 AI credits a month, and an average report summary uses around 95 credits. Credits reset monthly and don’t carry over, and you can set a spending limit if you’d rather cap it. You’re only billed for what you use, so an account where nobody touches AI costs nothing extra. Dashboards get a limited set of AI features compared with reports.
On data handling, requests are processed in the AWS cloud using commercially available models, the data isn’t used for training, and the whole thing is GDPR compliant under the existing data processing agreement.
X Analytics FAQ
Quick answers for agencies reporting on X performance
How do I access X analytics?
Open Premium from the left sidebar on X, then select Analytics. Premium runs $8 a month on the web. Without a subscription, you can still see impressions, likes, and replies on individual posts through the mobile app.
Is X analytics free?
The full account dashboard requires Premium. Free accounts can see basic engagement numbers on individual posts through mobile, but not the account-level overview, audience patterns, or historical trends.
Does analytics.twitter.com still work?
It’s inconsistent. Some accounts still get redirected to the current dashboard; others land back on their own timeline instead. Don’t bookmark the old URL and build a workflow around it. Go through Premium in the left sidebar instead, since that path doesn’t depend on a legacy redirect still being maintained.
What X metrics should I track first?
Start with impressions, engagement rate, and follower growth. Those three cover reach, interest, and growth in one pass. Add profile visits once you’re posting consistently with a clear call to action.
How often should I check X analytics?
Weekly for trend-spotting, monthly for the full picture you’d hand to a client. Daily checks tend to read normal noise as a signal that isn’t there.
Can I see analytics for someone else’s X account?
No. Analytics only cover accounts you manage directly. For competitor tracking, use a third-party tool or watch their public follower count and engagement manually.
What’s the difference between impressions and reach on X?
Impressions count every view, including repeat views from the same person. Reach counts unique viewers once each. X doesn’t report reach directly, so it’s estimated as (Impressions ÷ Followers) × 100, which is a rough gut-check rather than a precise figure.
What is a good engagement rate on X?
It depends entirely on which formula produced the number you’re comparing against. X’s own dashboard divides engagements by impressions; most published benchmarks divide by follower count instead. Compare your own account against its own history before comparing it to a published industry figure.
What counts as engagement on X?
Likes, reposts, replies, profile clicks, media views, and bookmarks. Quote tweets and account mentions count too.
What’s the difference between X Analytics and X Ads reporting?
X Analytics covers organic posts, the ones you didn’t pay to promote. X Ads reporting is a separate system tracking paid campaign performance, with its own cost and click data. They don’t share one dashboard, so a full picture of X performance needs both, pulled and labeled separately.
What’s the difference between video views and video completion rate?
Video views is a raw count of how many times a video started playing. Completion rate is the percentage of those viewers who watched the whole thing. A video can rack up thousands of views and still have a completion rate low enough to signal a real problem with pacing or length.
How is video completion rate calculated on X?
Completed views divided by total views, times 100. Compare it against your own account’s video history rather than a general industry number; format and length swing this metric too widely for an external benchmark to mean much.
Why do my X impressions fluctuate so much?
X’s ranking weighs content quality, timing, trending topics, and how fast a post picks up engagement. A 20 to 50% daily swing is normal. Track the weekly trend line, not the daily number.
What does profile visits mean in X analytics?
It’s how many people clicked through to view the full profile after seeing a post. A rising number is a leading signal for follows and site clicks before either one actually happens.
Should I report profile visits alongside follower growth?
Yes, because the pair explains why growth is flat when neither number explains it alone. Divide new followers by profile visits for the same period to get follow-through rate. Under 5% means people are reaching the profile and leaving, which points at the bio or the pinned post rather than the content. Flat visits with healthy follow-through points the other way, at posts that aren’t earning the click.
How do I measure whether X is driving website traffic?
Tag every link with UTM parameters and read the results in Google Analytics. That gets you sessions, bounce rate, and conversions attributed specifically to X, which native analytics can’t give you even with Premium.
What’s a good follower growth rate on X?
There’s no single healthy number; a steady, gradual climb matters more than any specific percentage. What’s worth watching is the shape of the line: a slow, consistent rise usually means the content is working, while a flat or declining trend over several weeks is the real signal, not any one snapshot.
How do I increase my X engagement rate?
Ask questions, take a real position on something instead of a safe one, post when your specific audience is active, and reply to comments quickly. Threads and visual posts tend to outperform plain text.
What time should I post on X for maximum reach?
Check your own Premium analytics for when your specific audience is active rather than a general rule. Test a few windows and track the results before locking in a schedule.
How many hashtags should I use on X?
One to three that your actual audience follows. More than that reads as spam and tends to lower engagement instead of raising it.
Why are my X impressions decreasing?
Usually a drop in posting frequency, a shift in engagement rate, an algorithm change, or content that’s moved off-topic from what built the audience. Go back to your best-performing posts and look for the pattern.
What are the best X analytics tools?
X’s own Premium dashboard covers the basics. For agency-scale reporting across many clients and channels, see our full breakdown of social media reporting tools.
Can I export X analytics data?
X’s native export options are limited. A dedicated reporting tool gives you more control over format and scheduling if you’re sending client-facing reports regularly.
Can I track hashtag performance on X?
Not natively. X removed built-in hashtag tracking, so following how a specific hashtag performs over time now requires a third-party tool built for that purpose. If hashtag campaigns are a regular part of the work, budget for one of those tools rather than expecting native support.
Why can’t I see X analytics for old tweets?
X’s own dashboard, not just third-party tools pulling from the API, runs on a short rolling window of roughly the past month. Data from before that isn’t sitting somewhere waiting to be unlocked. It’s simply not retained, which is why a consistent reporting schedule matters more on X than on most other platforms.
How do I get X data from before the current window?
Three options, none of them simple. Start archiving your own data going forward so you’re never caught out again. Pay for enterprise-level API access, which runs into the tens of thousands of dollars a month and is only worth it at serious scale. Or use a third-party platform that maintains its own historical X archive. There’s no free or easy fourth option; if the data wasn’t captured at the time, it’s gone.
How do I track X analytics for multiple accounts?
A social media management or reporting platform that supports multiple connected accounts is the practical answer once you’re past two or three clients; checking each account natively doesn’t scale.
What should I do if my X analytics aren’t updating?
Confirm your Premium subscription is active, clear your browser cache, or try a different browser. Data can lag 24 to 48 hours. If it’s still stuck after that, contact X support directly.
How do I create X analytics reports for clients?
Lead with engagement rate, follower growth, profile visits, and website traffic from UTM-tagged links, the metrics tied to a business outcome rather than a raw count. Automate the pull on a set schedule so no client’s 30-day window closes before you’ve captured it.
Can clients see their X report without a login?
Yes. A Client Portal combines the reports, boards, and goals you choose into one secure link per client, with an optional password, so they open a single URL instead of hunting through email for three. You preview it before sending, and you can change what’s in it later without issuing a new link. If someone leaves the client’s team, regenerate the link and the previous URL stops working immediately.
Can AI summarize an X report for a client?
Yes, and once you enable it in Settings, clients can ask questions of a shared dashboard themselves instead of emailing you. Usage runs on AI credits: 4,000 are included each month, an average report summary costs around 95, and unused credits don’t carry over. You’re billed only for what gets used, so an account nobody runs AI on costs nothing extra, and you can set a monthly spending cap. Dashboards get a narrower set of AI features than reports.
Final Thoughts
Count how many of the seven you’re currently reporting, then check how many of those you’ve captured in the last 30 days. Anything older than that window is already gone, and no tool or upgrade brings it back.
The single strongest reason to fix this now is the 30-day cutoff. Every other problem on this list is a reporting choice you can revisit next month, while a closed data window is permanent.
Pick your busiest X client, confirm their connection is live, and set one Alert on it before your next reporting cycle. That takes about ten minutes and it’s the difference between catching a broken connection on day one and finding out five weeks later.
Track the right X metrics and show clients the real value of your efforts today.
Start Your Free Trial Today