
X (formerly Twitter) has become an indispensable marketing tool, boasting over 429 million monthly active users. But with so much noise competing for attention, proving the value of your X marketing to clients can be a challenge. Clear, data-driven reporting is essential to demonstrate the impact of your work.
This guide cuts through the clutter and reveals the essential X analytics to track for compelling client reports. Learn how to measure what matters, showcase your success, and optimize your strategies to achieve real results on this powerful platform.
Key X Metrics for Client Reporting
Key X Metrics Main Categories
Focus: Overall account growth and reach on X.
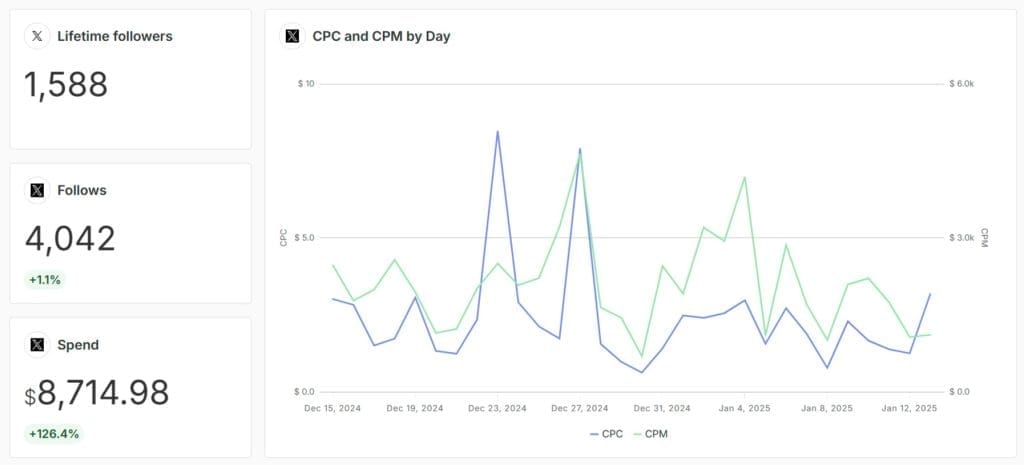
Metrics: Lifetime Followers, Lifetime Following, Net Follower Growth.
Value: Offers an overall view of account evolution.
Focus: How individual posts perform.
Metrics: Impressions, Engagements, Engagement Rate, Likes, Replies, Reposts, Profile Visits, Video & Media Views, Bookmarks.
Value: Helps pinpoint which content engages the audience most.
Focus: Differentiates between paid and organic tweets.
Value: Clarifies the specific impact of each tweet type.
Key Metrics for Reporting on X (formerly Twitter)
Why It’s Important: Tracks how many times a tweet has been seen.
What Does It Measure: The potential reach of your tweets.
How to Calculate: Provided directly in X Analytics.
Benchmark: Dependent on follower count and industry standards.
Best For: Evaluating content visibility and reach.
Common Pitfalls: High impressions don’t always equate to unique views.
Why It’s Important: Measures the unique audience exposed to your tweets.
What Does It Measure: The number of unique users who see your content.
How to Calculate: Estimate using (Impressions / Followers) × 100.
Benchmark: Approx. 10-20% of follower count.
Best For: Understanding the actual impact of your tweets.
Common Pitfalls: Estimated reach may vary due to repeat impressions.
Why It’s Important: Measures how well your audience interacts with your content.
What Does It Measure: The percentage of engagements relative to impressions.
How to Calculate: (Engagements / Impressions) × 100.
Benchmark: 0.02% to 0.09% for most industries.
Best For: Identifying resonating content and audience interest.
Common Pitfalls: Low engagement may indicate poor content alignment.
Why It’s Important: Tracks the expansion of your audience over time.
What Does It Measure: Net new followers gained within a period.
How to Calculate: Net Follower Growth = Lifetime Followers – Lifetime Following.
Benchmark: Steady growth signals healthy engagement.
Best For: Evaluating long-term audience-building strategies.
Common Pitfalls: Spikes or dips may indicate content or strategy issues.
Why It’s Important: Indicates how engaging your video content is.
What Does It Measure: The percentage of users who watch a video to the end.
How to Calculate: (Completed Views / Total Views) × 100.
Benchmark: 60%+ for videos under 30 seconds; 50%+ for longer videos.
Best For: Assessing video content strategy effectiveness.
Common Pitfalls: Low completion may indicate poor content or video length issues.
Why It’s Important: Tracks how hashtags contribute to engagement and reach.
What Does It Measure: Impressions, reach, and interactions for individual hashtags.
How to Calculate: Use third-party tools for detailed analysis.
Benchmark: Compare performance to account and industry averages.
Best For: Refining hashtag strategy and boosting visibility.
Common Pitfalls: Popular hashtags may have reach but low engagement.
X analytics provides an abundance of data. When reporting to clients, you know that not all metrics are created equal. Focus on the ones that offer a comprehensive view of your campaigns’ performance, audience engagement, and overall brand impact on the platform.
At Swydo, we recognize the challenges you face when reporting to clients. We’ve identified three key categories of X metrics you should track.
Page Performance Metrics – The Big Picture of Your Client’s X Presence
These metrics offer a bird’s eye view of your client’s X presence over time. They include
- Lifetime Followers: The total number of followers gained since the account’s creation
- Lifetime Following: The total number of accounts followed since the account’s creation
Tracking these metrics helps demonstrate the overall growth and reach of your client’s X account, providing valuable context for your other analytics.
Post Performance Metrics – A Closer Look at Tweet Performance and Engagement
These metrics provide detailed insights into the performance of individual tweets, showing you what’s working and what’s not.
Key metrics in this category include:
- Impressions: The number of times a tweet is displayed
- Engagements: The total number of interactions with a tweet
- Engagement Rate: The percentage of engagements relative to impressions
- Likes: The number of likes a tweet receives
- Replies: The number of replies a tweet receives
- Reposts: The number of times a tweet is shared
- Profile Visits: The number of times the profile is visited
- Video & Media Views: The number of times a video or media is viewed
- Bookmarks: The number of times a tweet is bookmarked
Track these metrics consistently to identify top-performing content, adjust your strategy in real-time, and consistently deliver results for your clients.
Tweet Type Filters – Break Down Data Based on Paid vs. Organic Tweets
Not all tweets are equal. That’s why it’s essential to segment your data based on the type of tweet
- Promoted (paid)
- Organic (non-paid)
Use these filters to clearly show the impact of your paid efforts versus your organic reach, providing a more complete picture of your X performance.
Now that we’ve covered the high-level categories, let’s take a closer look at the specific X metrics your clients care about most.
The Strategic Value of X Metrics
Marketing agencies like yourself, face an avalanche of data daily. Raw numbers – impressions, engagements, follower counts – flood dashboards and reports. These metrics hold potential, but they need transformation into meaningful insights that drive business objectives forward.
Metrics work like kitchen ingredients – flour, eggs, and sugar create possibilities. The magic happens in their combination and transformation. X analytics follow this same principle – individual metrics combine to tell powerful business stories.
Why Raw Numbers Fall Short in Client Reports
Before we dive into specific transformations, let’s understand why this matters. Your clients don’t really care about impressions or engagement rates in isolation. What they care about is growth, revenue, and business impact. Your job is to connect these dots and show how social media efforts drive real business results.
Say your client’s campaign hit 100,000 impressions. Sounds impressive, right? But what if only 0.1% of those impressions led to engagement, and none converted to website visits? Suddenly, that big number loses its shine. This is why we need to think beyond basic metrics.
Social Media KPIs That Drive Business Growth
Let’s figure out how to turn ordinary X metrics into awesome KPIs that really grab attention. Let’s begin with what matters most to our clients: brand awareness.
The Brand Awareness Formula That Matters
Instead of simply reporting reach and engagement separately, combine them into a more meaningful measure:
Where Weighted Engagement gives different weights to various types of interactions:
- Likes: 1 point
- Replies: 3 points
- Reposts: 2 points
- Bookmarks: 2 points
This score provides context about not just visibility, but genuine audience interest relative to industry standards.
For example, let’s say a SaaS company posts a product demo video. Instead of just reporting 10,000 views, you can calculate a Brand Impact Score. This would factor in the views alongside weighted engagement metrics like the number of likes, replies, and shares. A high score, say 82/100, demonstrates strong market penetration and audience interest relative to other SaaS companies.
This score provides context about not just visibility, but genuine audience interest relative to industry standards. For example, let’s say a SaaS company posts a product demo video. Instead of just reporting 10,000 views, you can calculate a Brand Impact Score. This would factor in the views alongside weighted engagement metrics like the number of likes, replies, and shares.
A high score, say 82/100, demonstrates strong market penetration and audience interest relative to other SaaS companies.
Business Results from Social Engagement Data
One of the most common challenges agencies face is demonstrating how social engagement translates to business results. Here’s a framework that helps bridge this gap:
| Engagement Type | Business Value Indicator | Why It Matters |
|---|---|---|
| Profile Visits | Lead Generation Potential | Shows active interest in your brand |
| Link Clicks | Traffic Generation | Indicates movement toward conversion |
| Reply Sentiment | Brand Health | Reveals audience perception and satisfaction |
| Bookmark Rate | Content Resonance | Suggests high-value, reference-worthy content |
Let’s look at how to contextualize this data for your clients. For example, that same SaaS company’s product demo video might have generated 23 direct inquiries from potential leads through comments and direct messages. This shows how engagement (replies) directly correlates to lead generation potential.
Advanced Data Analysis for Strategic Decisions
You’re reviewing your monthly reports and notice that while overall engagement is up 20%, profile visits have decreased. Before panicking, consider the bigger picture:
- Are you posting more engaging content that satisfies user curiosity within the platform?
- Has your call-to-action strategy changed?
- Are you attracting a different type of audience?
This kind of analytical thinking transforms raw data into actionable insights.
Custom Metrics for Each Business Model
Every client is unique, and their KPIs should reflect this. Here’s how to develop metrics that matter for different business types:
Revenue Impact Metrics for E-commerce
Focus on metrics that show the journey from awareness to purchase:
Conversion Potential = (Link Clicks × Average Site Conversion Rate) × Average Order Value
This helps forecast potential revenue impact from your X activities.
Conversion Potential Calculator
Result will appear here
Lead Quality Analysis for B2B Companies
For B2B companies, the focus might be more on thought leadership and lead quality:
Thought Leadership Index = (Expert Engagement Rate × Industry Influence Score) × Content Depth Factor
Where:
- Expert Engagement Rate = Interactions from industry-identified experts
- Industry Influence Score = Weighted measure of your client's industry authority
- Content Depth Factor = Assessment of content complexity and value
Data Stories That Drive Action
The key to successful reporting isn't just in the numbers – it's in the narrative you build around them. Here's how to make your data tell a compelling story:
| Framework | Description |
|---|---|
| Strategic Context Framework | Set the stage by explaining the goals and challenges before presenting the numbers. This helps clients understand the context behind your results. |
| Performance Pattern Recognition | Instead of isolating individual metrics, highlight trends and patterns over time. This demonstrates the impact of your long-term strategy. |
| ROI Measurement Framework | Tie all metrics back to business objectives. Show how social activity leads to engagement, business impact, and ultimately, ROI. |
For example, if your client's goal is lead generation, your report might explain:
"Our targeted content strategy, including a product demo video, drove a 45% increase in profile visits and generated 23 direct inquiries from qualified leads. Based on current conversion rates, this represents approximately $46,000 in potential pipeline value."
Each number has a purpose—showing growth, proving impact, and guiding future decisions.
Essential X Metrics Your Clients Care About Most
Now that we've covered the high-level categories, let's take a closer look at the specific X metrics your clients care about most.
Impressions - The Foundation of X Analytics
Impressions form the core of X analytics. They represent the number of times a tweet has been seen by users. Think of impressions as the potential reach of your content – the more impressions, the more people are exposed to your client's message.
However, it's important to note that impressions are not unique. If a user scrolls past a tweet multiple times, each view counts as a separate impression. While a high number of impressions is a good sign, it doesn't necessarily mean your content is reaching a wide, unique audience.
That's where the next metric comes into play.
Reach - Discover Your True Audience Size
Reach focuses on unique views. It measures the number of individual users who have seen a tweet, regardless of how many times they've seen it. This metric is crucial for understanding the true extent of your content's distribution on X.
You might be thinking, "But X doesn't provide reach data in their analytics!" You're right. However, there's a simple workaround. Estimate your reach using this handy formula
Estimated Reach = (Impressions / Followers) x 100
Break this down with a real-world example. Say one of your client's tweets receives 1,000 impressions, and their account has 10,000 followers. Using the formula above, the estimated reach would be (1,000 / 10,000) x 100 = 10%. This suggests that around 10% of your client's followers were exposed to the tweet.
This is an estimate, as some users might see the tweet multiple times, and your content can also reach non-followers through retweets and hashtags. Tracking reach in this way provides a valuable benchmark for understanding the impact of your X efforts.
Engagement Rate - The Ultimate X Metric
Engagement is the ultimate goal on X. Every like, retweet, reply – these are all signals that your content is resonating with your audience. Engagement rate takes this a step further by measuring these interactions relative to your reach.
Calculate it using this formula
A high engagement rate is the holy grail of X marketing. It means your content is not only seen but also inspiring action. It's a clear indicator that your messaging is on point, your timing is right, and your audience is eager to interact with your brand.
But what constitutes a "high" engagement rate? The truth is, it varies widely by industry and even by account size. According to data from RivalIQ, the median X engagement rate across all industries is 0.029%. For agencies like yours, aim for an engagement rate between 0.02% and 0.09%. Of course, if you can achieve rates above 0.33%, you're doing exceptionally well.
Track your engagement rate over time and aim for consistent improvements. Use it as a guiding light to steer your content strategy – focus on the types of posts that generate the most engagement, and experiment with new ideas to keep your audience engaged.
Key Metric Calculator
Result will appear here
Follower Growth - Gauge Your Potential X Reach
Your follower count is more than just a vanity metric – it's a measure of your potential reach on X. The more followers your client has, the larger their audience for future content. However, raw follower numbers only tell part of the story. To truly assess the impact of your X strategy, track follower growth over time.
This is where Swydo's Page Performance Metrics come in handy. Lifetime Followers tracks your total follower count since the account's creation, while Lifetime Following shows the number of accounts your client has followed. Calculate net follower growth by simply subtracting Lifetime Following from Lifetime Followers.
Steady follower growth is a strong signal that your content is resonating and your client's brand presence on X is growing. Pay attention to spikes and dips along the way. A sudden influx of followers could indicate a particularly successful campaign or a viral piece of content. On the flip side, a dip in followers might suggest a need to reassess your strategy.
As you analyze follower growth, ask yourself: Are we providing consistent value to our audience? Are we engaging with them regularly and building genuine relationships? The answers to these questions will guide your approach to sustained, organic growth on X.
Video Completion Rate - A Key Metric for Engaging Video Content
Video’s a big hit on X, and for good reason – it’s really engaging. Good videos are only part of the story. To truly gauge the impact of your video strategy, track video completion rate.
Video completion rate measures the percentage of viewers who watch your client's video all the way to the end4. It's a powerful indicator of how well your video content resonates with your audience. A high completion rate suggests that viewers are not only stopping to watch your videos but are actively engaged from start to finish.
On the other hand, a low completion rate is a red flag that your videos aren't holding your audience's attention. This could be for several reasons
- The video might be too lengthy
- The content might not align with viewers' expectations
- The storytelling might not be compelling enough to keep them hooked
So what should you be aiming for? As a general rule of thumb
- 60%+ completion rate is considered strong for videos under 30 seconds
- 50%+ completion rate is a good target for longer videos
Continually monitor your completion rates and strive for improvement over time. These are just benchmarks
Calculate video completion rate using this formula
As you track this metric, pay attention to patterns. Which types of videos consistently have the highest completion rates? Is there a certain length that seems to be the sweet spot for your audience? Use these insights to optimize your video content strategy and keep your viewers engaged from start to finish.
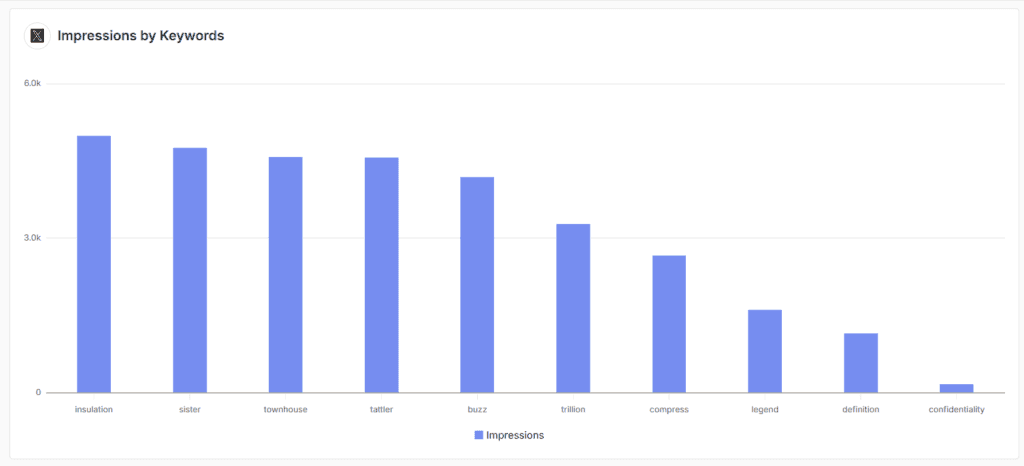
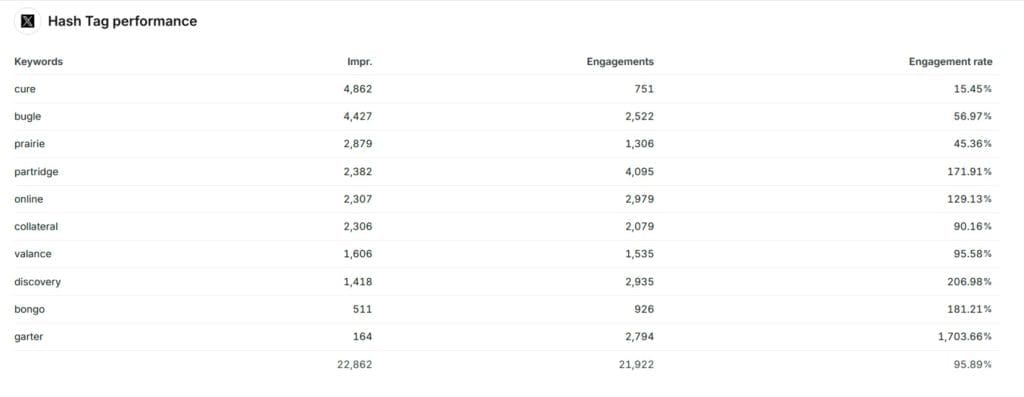
Hashtag Performance - Boost Your X Reach and Engagement
Hashtags are one of the most powerful tools in your X marketing arsenal. They help your content get discovered by users who are interested in specific topics, and they can significantly boost the reach and engagement of your tweets. With millions of hashtags out there, how do you know which ones are driving results for your clients?
Enter hashtag performance metrics. Track the impressions, reach, and engagement generated by individual hashtags to identify the ones that are truly resonating with your audience and amplifying your message.
X's native analytics don't provide detailed metrics for specific hashtags. To get this level of granularity, use a third-party tool like
- Sprout Social
- Keyhole
- Hootsuite
These platforms allow you to track key performance indicators for individual hashtags over time, giving you a clear picture of which ones are driving the most value for your clients.
When analyzing hashtag performance, look beyond just the raw numbers. A hashtag might generate a ton of impressions, but if engagement is low, it might not be the best fit for your brand. Instead, look for hashtags that have a healthy balance of reach and interaction. A niche hashtag with a smaller audience but high engagement can be incredibly valuable for connecting with a dedicated community of users who are passionate about your client's industry or mission.
As you track hashtag performance
- Benchmark against your overall account averages as well as industry standards
- Continuously refine your approach – double down on the hashtags that are generating the most bang for your buck
- Experiment with new hashtags to keep things fresh
Best Time to Post - X Timing Strategy for Maximum Impact
You could have the most brilliant content in the world, but if you're posting it when your audience is asleep or busy, it's not going to make much of an impact. Understanding the best times to post on X is crucial for maximizing the reach and engagement of your client's content.
Figuring out when your audience is most likely to be scrolling through their feed and ready to interact with your tweets? That's where "best time to post" analysis comes in. Track metrics like impressions, reach, and engagement by day and time to identify patterns in your audience's activity and adjust your posting schedule accordingly.
X's native analytics provides some high-level data on this, showing you the days and hours when your tweets tend to get the most impressions. To dig into the details, you might want to use a more robust third-party tool that can break down the data by specific engagement types – likes, retweets, replies, and so on.
Once you've pinpointed your optimal posting times, use that information to guide your content calendar. Schedule your most important tweets for the times when your audience is most active and engaged to amplify their impact and drive more meaningful interactions.
Each client's audience will have its own optimal posting times. What works for a B2B software company might be completely different from what works for a D2C e-commerce brand. Continually test and analyze your own data to find the posting cadence that works best for your client's unique audience.
It's also important to remember that audience behavior can shift over time. As your client's follower base grows and evolves, their engagement patterns may change. Review your timing data and make adjustments as needed to ensure you're always hitting the mark.
How to Access and Calculate Key X Metrics
Now that you know which metrics to track, let's talk about how to actually access and analyze that data. X's native analytics platform is the foundation – it tracks and compiles data on all the interactions and activity surrounding your client's account. Access X Analytics
How to Find X Analytics from a Desktop
- Go to your X homepage and look at the left-hand panel. Choose Premium (you'll need a paying subscription), then select Analytics in Quick Access.
- You’ll see an account overview with metrics such as impressions, engagement rate, profile visits, and new followers. You can switch between 7 days, 28 days, 3 months, or a year. Further down, you’ll see deeper numbers for each metric.
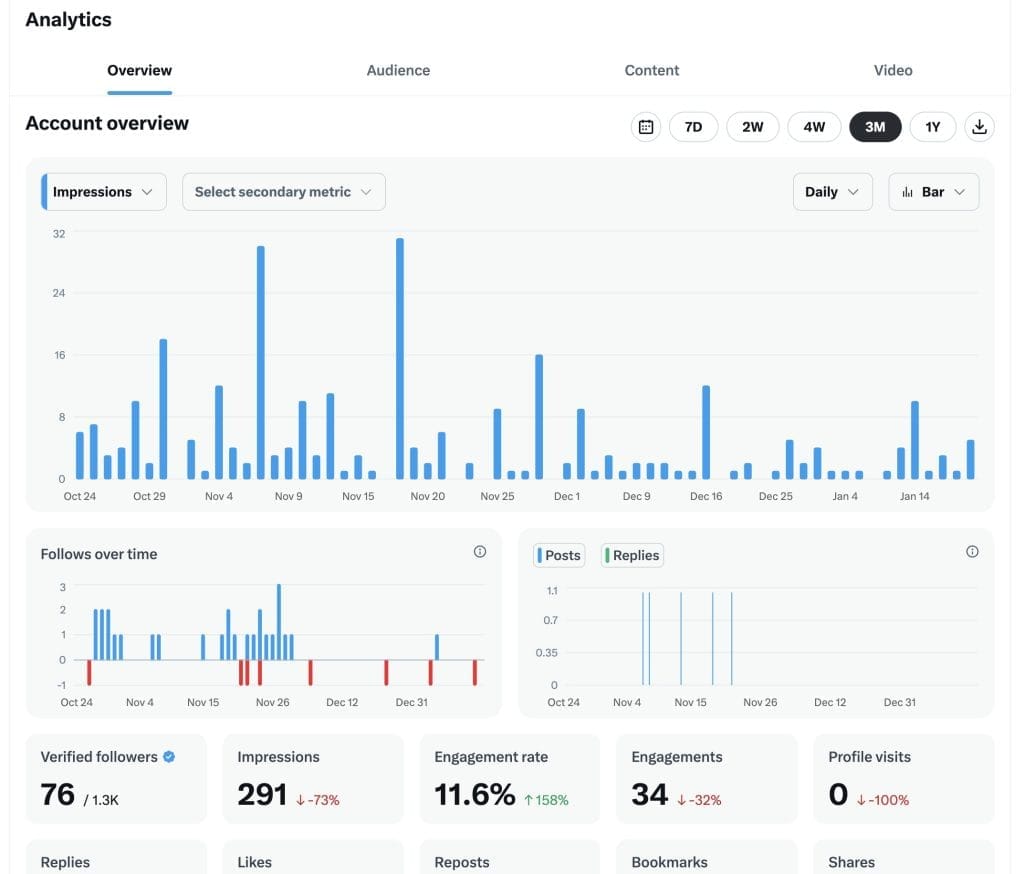
What the X Analytics Dashboard Provides
In the dashboard, you’ll find additional data points like replies, likes, reposts, bookmarks, and shares. Each metric lets you see how many people view or interact with your content and whether your audience size changes over time. A simple graph tracks daily impressions and engagements, making it easier to spot patterns or shifts in performance.
It's important to note that while the native X Analytics dashboard is a great starting point, it does have some limitations. The data isn't always as easily accessible or customizable as you might need, and certain metrics are only available to users with a premium subscription.
This is where a tool like Swydo can be a game-changer for your agency. Swydo's X integration allows you to pull all your key X metrics into one centralized, customizable dashboard. With Swydo, you can
- Build custom dashboards that highlight the metrics that matter most to each individual client
- Set up automated reports to keep your clients consistently informed of their X performance
- Compare your client's metrics to industry benchmarks and competitor data to provide strategic context
- Integrate X data with metrics from other social platforms to paint a holistic picture of your client's social media ROI
Whether you're relying solely on X's native analytics or leveraging a more advanced third-party tool, be consistent in your tracking and analysis. Review your data, use it to inform your content and hashtag strategies, optimize your posting times, and continually demonstrate the value you're bringing to your clients.
Streamline Your Reporting with Templates - Work Smarter, Not Harder
Creating detailed, engaging X analytics reports for your clients can be time-consuming. It doesn't have to be. Leverage pre-built reporting templates to streamline the process, ensure consistency across all your client reports, and free up more time to focus on driving results.
Swydo offers a robust library of customizable reporting templates designed specifically for agencies, including templates tailored for X analytics. These templates provide a solid foundation for structuring your data and presenting it in a visually compelling, easy-to-digest format.
Using a template doesn't mean your reports will be cookie-cutter or bland. Swydo's templates are fully customizable, allowing you to add, remove, or rearrange sections to tell the story that matters to each individual client. You can also infuse your reports with your agency's unique branding – logo, colors, fonts – to deliver a polished, professional end product.
In addition to saving you valuable time and effort, using templates ensures that you're always highlighting the metrics that matter most. With a structured template, you're less likely to overlook a critical data point or get sidetracked by vanity metrics that don't actually contribute to your client's bottom line.
Conclusion
X marketing success requires more than just great content. It demands data-driven decision making. Consistently track and report on the right metrics to demonstrate your value, make data-driven decisions, and continuously optimize your strategies to drive real results for your clients.
The metrics we've covered in this guide provide a comprehensive view of your X performance
- Impressions
- Reach
- Engagement Rate
- Follower Growth
- Video Completion Rate
- Hashtag Performance
- Best Times to Post
Monitor and analyze these key data points regularly to craft compelling narratives that showcase your successes and illuminate opportunities for improvement.
Data's true value comes from how you use it. The real power comes from translating those numbers into actionable insights and strategies. Use your X analytics to
- Identify top-performing content and double down on what's working
- Pinpoint areas where you're falling short and brainstorm new approaches
- Test, iterate, and optimize continually to keep your clients' X presence fresh and effective
As an agency marketer, your clients rely on you to be the expert. They look to you not only to execute tactical X activities but to provide strategic guidance and drive meaningful business outcomes. Gain a deep understanding of X analytics and use data to inform every decision you make to position yourself as an indispensable partner in your clients' success.
Get into those numbers, become comfortable with X Analytics and Swydo's powerful tools, and start telling data-driven stories that showcase the real value of your work. With the right metrics and approach, there's no limit to the X success you can achieve for your clients – and for your agency as a whole.
Track the right X metrics and show clients the real value of your efforts today.
Start Your Free Trial Today