
Your client emails on a Monday morning: “Why doesn’t our YouTube spend look like it’s working?” You open YouTube Studio. Subscribers up 2,000. Views up 18%. None of it answers the question.
That’s the problem with the metrics most agencies still report. They measure activity, not outcomes.
This is where a real YouTube scorecard comes in.
TL;DR: The seven YouTube metrics that drive your client’s content decisions week-to-week are watch time, audience retention, CTR, subscribers gained per video, share rate, traffic sources, and engaged views (Shorts). The seven you put in front of a CMO once a month are impressions, monthly audience, new/casual/regular viewers, CTV viewing share, RPM, brand lift, and branded searches. This article walks both tiers, plus four metrics worth cutting from your next report entirely.
The Two-Tier Scorecard: Operational vs Strategic
Operational metrics tell you what to do next week. Strategic metrics tell your client what their YouTube budget bought them this quarter. Both matter. They don’t matter in the same way.
The mistake most agencies make: they mix the two tiers into one giant client report. Operational numbers (watch time, retention) and strategic numbers (brand lift, branded searches) sit side by side, with no signal about which deserves attention. The CMO scans the report, finds nothing they can act on, and concludes YouTube is “fuzzy.” The agency loses the renewal.
Split the tiers and the conversation changes:
- Tier 1 (Operational) — the dashboard your account manager checks every Monday. Watch time, retention, CTR, share rate, subs per video, traffic sources, Shorts engagement. These metrics drive content decisions. They tell you which videos to make next month.
- Tier 2 (Strategic) — the slide deck you present once a month to the client’s CMO or marketing director. Reach, audience composition, CTV share, RPM, brand lift, search lift, branded searches. These metrics prove business impact. They renew contracts.
What’s Different About YouTube Reporting in 2026
YouTube reporting changed in five concrete ways since 2024. The platform is now the #1 streaming service on US TVs. Shorts views were redefined in March 2025. “Returning viewers” was replaced by a three-tier segmentation. Shorts revenue per watch hour now matches long-form in the US. And Brand Lift studies are standard line items on six-figure agency reports.
YouTube hit 13.4% of total US TV viewing in July 2025. That’s the highest share Nielsen has ever recorded for a single distributor. YouTube held the #1 spot on Nielsen’s Media Distributor Gauge for six straight months. If your client report still treats YouTube as a “social channel,” it’s showing them the wrong screen.
Three other shifts matter for the report you’ll send next month.
Shorts now generate 200+ billion daily views. Older articles cite 70 billion. Alphabet confirmed the new number on its Q2 2025 earnings call.
The March 31, 2025 view redefinition. YouTube now counts a Short view the moment a Short starts playing — no minimum watch time. The old definition is now called Engaged Views and is what YouTube uses for monetization.
Shorts revenue per watch hour matches long-form in the US. Sundar Pichai disclosed this on the Q3 2025 earnings call. The old “Shorts monetize at 1/40th the rate” framing is dead.
The Two-Tier YouTube Scorecard
14 metrics. Two audiences. Two cadences.
Operational
What your account manager checks every Monday to decide next week’s content.
- 1Watch time
- 2Audience retention
- 3Click-through rate
- 4Subscribers per video
- 5Share rate
- 6Traffic sources
- 7Engaged views (Shorts)
Strategic
What the CMO sees once a month to decide whether the budget gets renewed.
- 8Impressions
- 9Monthly audience
- 10New / casual / regular
- 11CTV viewing share
- 12RPM
- 13Brand lift & search lift
- 14Branded searches
Tier 1: The 7 Operational Metrics (For Weekly Action)
These are the metrics your account manager looks at on Monday morning. Each one is a leading indicator. Each one tells you what content decision to make next.
1. Watch Time
Watch time is total minutes watched across your channel. It’s the single biggest input YouTube’s algorithm uses to decide whether to promote your videos.
Find it in YouTube Studio → Analytics → Overview → Watch time (hours). Or in the Content tab broken out by individual video.
A video that holds 1,000 people for eight minutes generates more algorithmic momentum than a video viewed 50,000 times for fifteen seconds. The math is simple. YouTube monetizes time on platform.
Benchmark watch time against the channel’s own past performance — not against an external average. Industry averages mean nothing here. They don’t account for content type, audience, or channel maturity.
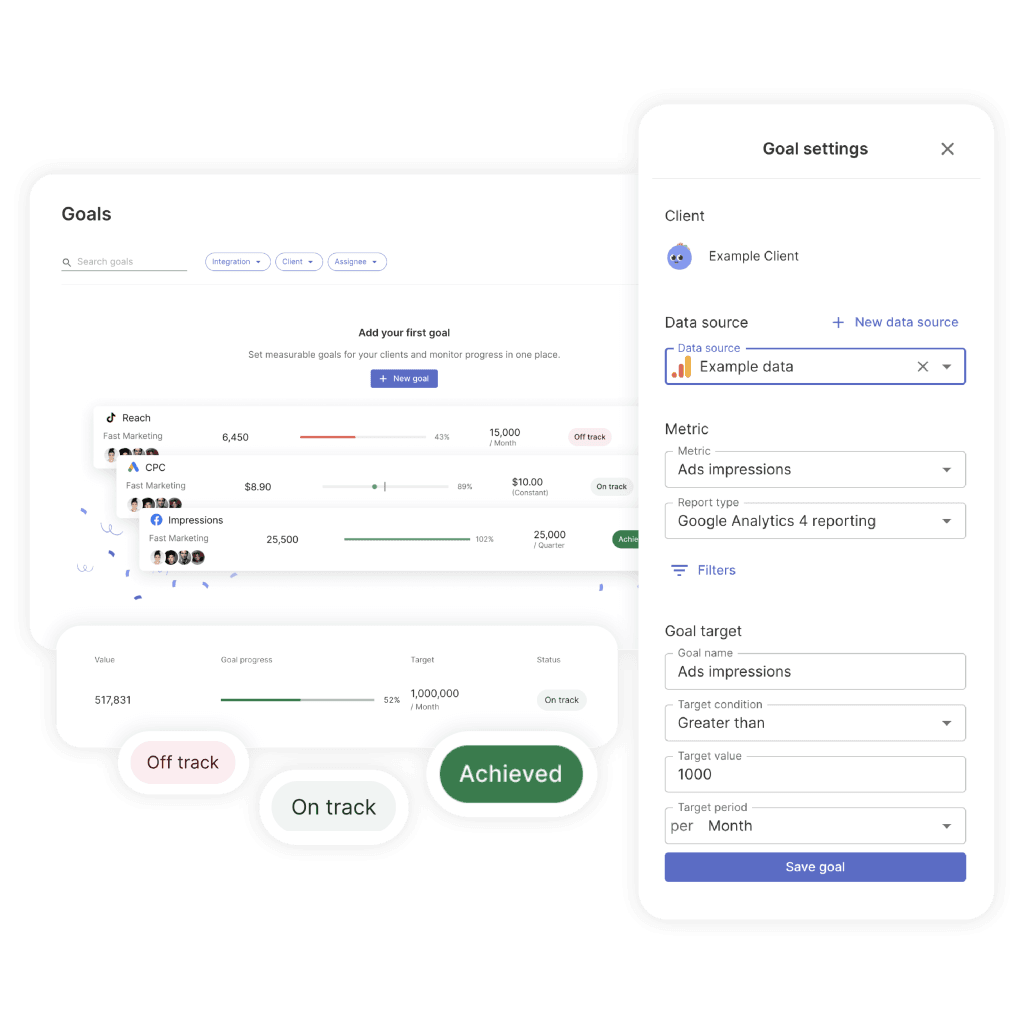
In Swydo: Set a Goal on Estimated Minutes Watched (Monitoring → Goals → +New Goal → YouTube data source → Estimated minutes watched). The report shows On Track, Off Track, or Achieved without anyone manually checking math. Goal Notifications fire at end-of-period and during the period. Pause goals between campaigns without deleting them.
2. Audience Retention and Average View Duration
Audience retention is the percentage of each video viewers actually watch. The retention graph is the single most useful diagnostic tool in YouTube Studio.
Find it in Analytics → Content → click any video → Audience retention.
Average View Duration (AVD) gives you the channel-level summary number. The retention graph gives you the per-second story. Read it like an EKG.
- Sharp drops at 0–15 seconds: intro is too slow
- Gradual decline throughout: content is boring
- A spike at minute 4: viewers are skipping to a specific moment — put that moment earlier next time
- A flat plateau: pacing matches expectations
Audience retention diagnostic
Retention Benchmarks by Video Length
Read with context: education and how-to content pulls higher; entertainment pulls lower. YouTube Studio’s “typical retention” overlay on every retention graph is more useful than any external benchmark.
Education and how-to content pulls higher. Entertainment lower. The “typical retention” comparison line YouTube Studio now overlays on every retention graph is more useful than any external benchmark.
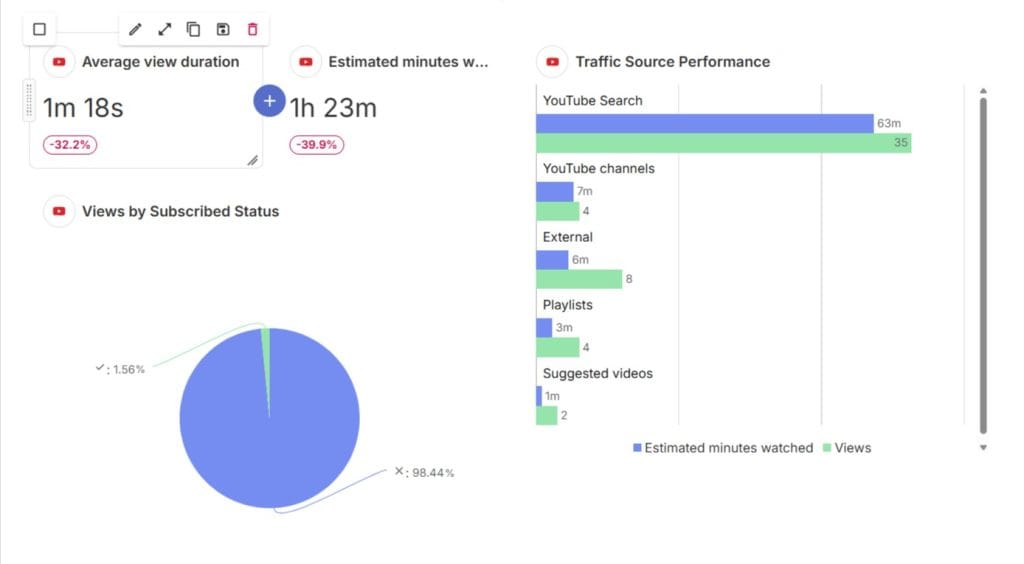
In Swydo: Average View Duration, Average View Percentage, Audience Watch Ratio, and Relative Retention are all native widgets in the YouTube integration. Pull any of them into a per-video table to see which formats hold attention.
Sidenote. The retention graph also shows re-watches as spikes that exceed 100%. Those moments are gold — they tell you what to lead with on the next video.
3. Click-Through Rate (CTR)
Impressions CTR is the percentage of YouTube viewers who clicked your thumbnail after it appeared in their feed. YouTube’s own help docs state that half of all channels see CTR between 2% and 10%.
Find it in Analytics → Reach → Impressions click-through rate.
Industry averages cluster between 4% and 6%. Channel-size variance matters more than the global number:
- Under 1,000 subscribers: CTR often runs 6–10% (most impressions are subscribers)
- Above 100,000 subscribers: CTR typically drops to 3–5% (impressions are spreading colder)
CTR is a leading indicator. When it drops below 3% on a new upload, YouTube reduces distribution within roughly 24–48 hours. The fix is to test thumbnails using Studio’s built-in Test & Compare feature, which now A/B tests up to three thumbnails on the same video.
A high CTR with low retention is the worst pattern. It means the thumbnail is overpromising. YouTube has started weighting “Quality CTR” — clicks that lead to sustained watch time — more heavily than raw CTR. Thumbnail-content alignment is a bigger deal than it used to be.
In Swydo: Impressions and Impressions CTR aren’t currently exposed via YouTube’s Analytics API, so log the weekly CTR number as a Manual KPI in your YouTube report. It sits in the same widget panel as the native fields — and following standard client reporting best practices, the client report doesn’t show the seam.
4. Subscribers Gained Per Video
Subscribers gained per video tells you which specific assets are doing the audience-building work. Most agencies bury it under a channel-level “subscriber growth rate” number — one of those vanity metrics that obscures more than it reveals.
Find it in Analytics → Content → click any video → Subscribers.
A single tutorial generating 200 subscribers in a month does more for the channel than ten company-update videos generating 20 subscribers each combined. The point isn’t to maximize subscriber count. It’s to identify content patterns that compound, then double down.
The metric pairs with Subscribers Lost on the same screen. A video gaining 300 subs and losing 80 has different audience dynamics than one gaining 230 and losing 10. The second is finding the right people. The first is finding people who don’t stick.
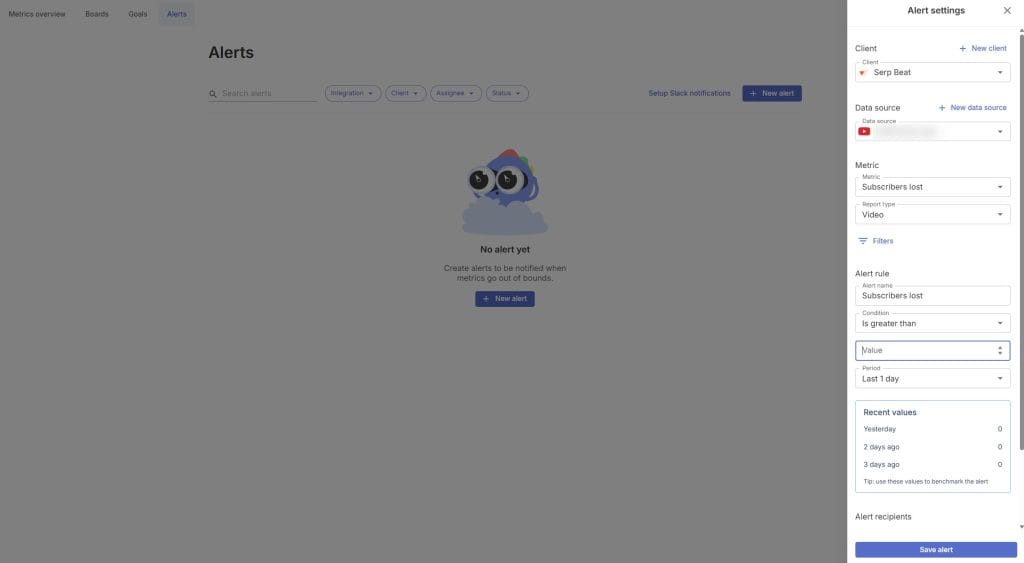
In Swydo: Both Subscribers Gained and Subscribers Lost are native YouTube widgets. Set up an Alert on Subscribers Lost for any client where audience quality matters more than raw growth:
- Open Monitoring → Alerts → +New Alert
- Pick your client
- Select Subscribers Lost
- Set the trigger condition (greater than 50 in a 7-day period — adjust to channel size)
- Connect Slack under Settings → Team → Slack so the team catches the drop the morning it happens
5. Share Rate
Shares and saves are the highest-quality engagement signals YouTube collects. They require the viewer to take a deliberate action beyond watching.
Find shares in Analytics → Engagement → Shares. Saves (added to playlist) live in Analytics → Engagement → Top playlists.
Likes are cheap. Comments can be negative. Shares mean a viewer recommended the video to someone else — and YouTube’s algorithm reads shares as the strongest single signal of content quality. Backlinko’s correlation study of 1.3 million videos identified shares as one of the top ranking correlators in YouTube search.
Track shares per view as a rate, not as a raw count.
A video with 10,000 views and 200 shares (2% share rate) is performing better than one with 100,000 views and 800 shares (0.8% share rate) — even though the second video has more total shares. High-share-rate videos almost always get a second wave of distribution within seven days of upload.
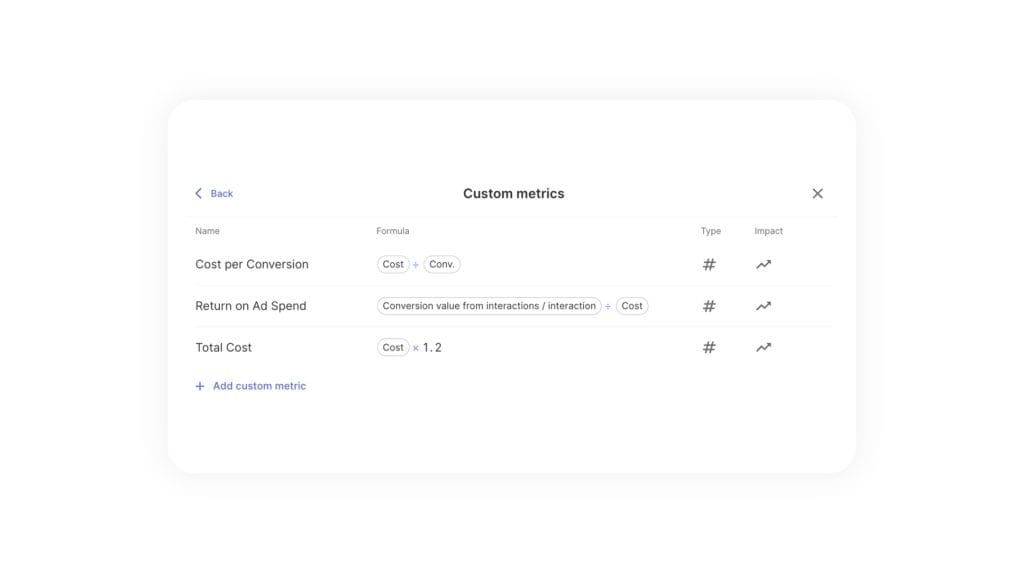
In Swydo: Both Share and Views are native fields, so build Share Rate once as a Custom Metric (Share ÷ Views × 100), then it’s available for every YouTube report:
- Open the widget editor → +Add Widget → KPI scorecard
- Click Custom Metric → +Create Custom Metric
- Name it “Share Rate”
- Formula: Share ÷ Views, multiplied by 100
- Set Type to Number, Impact to “Higher is better”
- Save
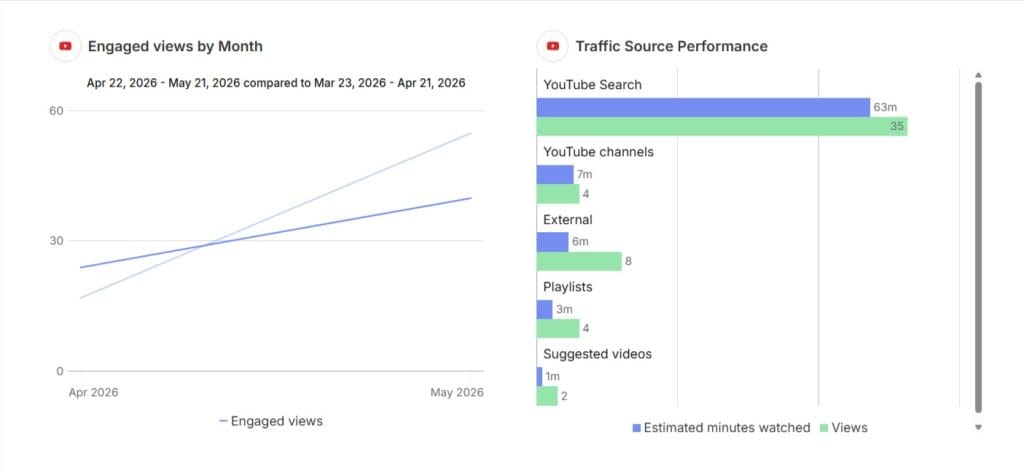
6. Traffic Sources
Traffic sources tell you whether viewers find your videos through search, suggested recommendations, the home feed, external links, or notifications. Each source requires a completely different optimization strategy.
Find it in Analytics → Reach → Traffic source types.
The five sources most agency reports should track:
- YouTube search — intent-driven; optimize for keywords in titles and descriptions
- Suggested videos — algorithm-driven; optimize for topical similarity to videos viewers just watched
- Browse features (home) — subscriber-driven; optimize for upload consistency and CTR
- External — referral; optimize for shareability and platform-specific framing
- Direct or unknown — branded/loyalty; usually search-by-name traffic
Optimizing for the wrong source wastes effort. A channel where 70% of traffic comes from Suggested doesn’t need more keyword research. It needs videos that adjacent channels’ viewers will watch next. A channel where 60% comes from Search needs the opposite.
Most agencies pick a strategy first, then check traffic sources. It should be the other way around.
In Swydo: Traffic Source Type is a native dimension. Slice any widget — views, watch time, subs gained, share rate — by source without leaving the report. Add the dimension under the widget’s Group By setting.
7. Engaged Views (Shorts)
Engaged Views is the Shorts-specific metric YouTube uses to determine monetization eligibility. It counts Shorts the viewer watched past the brief autoplay threshold — not Shorts they swiped past immediately.
Find it in Analytics → Content → Shorts → Engaged views.
The old “view” count and “Engaged Views” diverged on March 31, 2025. YouTube redefined a Short view as starting at the moment of play with no minimum watch time. The change made Shorts view counts directly comparable to TikTok and Reels (which work the same way). But it also means raw Shorts view counts are now inflated relative to historical data.
That’s why YPP eligibility and the Shorts revenue-share pool both use Engaged Views, not the new view count.
A Short with 100,000 views and 60,000 Engaged Views is doing what Shorts should do — wide funnel, meaningful retention. A Short with 100,000 views and 5,000 Engaged Views is being algorithmically promoted but not actually watched — distribution will stop soon.
In Swydo: Engaged Views is a native widget in the YouTube integration. Pull it alongside Views in a side-by-side KPI scorecard to spot the gap between top-of-funnel pull and retention quality.
Tier 2: The 7 Strategic Metrics (For The Monthly CMO Conversation)
These are the metrics that justify the budget. They don’t need a daily Alert. They need a clean slide once a month with the right context. Six of the seven require a Manual KPI in Swydo or live in the Google Ads integration alongside the YouTube data — which is fine. Strategic metrics aren’t supposed to fire as daily alerts.
8. Impressions
Impressions are the number of times your thumbnail appeared on a YouTube surface — home, search, suggested, Shorts feed — where the viewer could have clicked.
Find it in Analytics → Reach → Impressions.
Impressions and CTR are paired. A video with 100,000 impressions and 2% CTR isn’t doing better than a video with 30,000 impressions and 7% CTR. The first is being shown to the wrong audience. YouTube will eventually pull distribution.
Impressions tell you how often YouTube is willing to recommend the video. CTR tells you whether YouTube was right to do so.
In Swydo: Impressions isn’t exposed via YouTube’s Analytics API. Log the monthly number as a Manual KPI in your YouTube report.
9. Unique Viewers and Monthly Audience
Unique viewers is the number of distinct people who watched your channel in a given period. Monthly Audience is the rolling 28-day version. YouTube now positions Monthly Audience as the “real reach” KPI.
Find both in Analytics → Audience → Unique viewers and Monthly Audience.
Total views inflate. The same person can watch the same video four times. Unique viewers tell you how many actual people the channel reached.
For a brand running a YouTube content program, Monthly Audience is the closest metric to “audience size.” It replaces raw subscriber count as the headline reach number on a modern scorecard. Subscriber count measures historical opt-ins. Monthly Audience measures who actually watched in the last four weeks.
The two numbers diverge wildly on older channels.
In Swydo: Log Monthly Audience as a Manual KPI once a month, pulled directly from YouTube Studio’s Audience tab.
10. New, Casual, and Regular Viewers
YouTube replaced the binary “new vs returning viewers” metric with a three-tier segmentation in July 2025. New: first-time viewers in the period. Casual: viewers who watched 1–5 months in the past year. Regular: viewers who watched 6+ months in the past year.
Find it in Analytics → Audience → New and returning viewers.
The Regular bucket is a high bar. Most channels see single-digit percentages hit Regular status. That’s why it’s a more useful loyalty metric than subscriber count. A subscriber who hasn’t watched in eight months is dead weight on the algorithm. A Regular viewer is the channel’s actual core.
For agency reporting, the useful pattern is the ratio between the three buckets over time:
- High New, low Regular: distribution is working, retention isn’t — fix the second video viewers watch
- High Regular, low New: the channel is plateauing — distribution needs help
- Casual growing, Regular flat: subscriber-conversion content isn’t doing its job
In Swydo: The three-tier split isn’t exposed via the YouTube Analytics API yet. Pull the three numbers from Studio once a month and log them as three Manual KPIs in the same widget panel.
11. Connected TV Viewing Share
Connected TV (CTV) viewing share is the percentage of your channel’s watch time coming from TV screens. For many brands, it now exceeds mobile.
Find it in Analytics → Audience → Device type.
YouTube CEO Neal Mohan confirmed at Cannes Lions 2025 that TV had surpassed mobile as YouTube’s #1 watch surface in the US. Top creators have seen a 400% increase in TV-screen watch time over three years.
For an agency client, the question isn’t “should we account for CTV.” It’s “are we still designing thumbnails and pacing for mobile when half the audience is watching on a 65-inch screen with a remote?”
CTV viewers behave differently:
- They watch longer videos
- They share less
- They’re less likely to engage in comments
- They convert through different paths — typically a brand search on a phone after the TV session ends
That last point is why cross-device marketing attribution models matter more for YouTube than they used to.
Nielsen Media Distributor Gauge
YouTube Is the #1 Streaming Distributor on U.S TVsJuly 2025
Share of total US TV viewing across all distributors — the highest single-distributor share Nielsen has ever recorded.
In Swydo: Device Type isn’t yet exposed as a dimension. Pull the CTV percentage from Studio once a month as a Manual KPI.
12. RPM (Revenue Per Mille)
RPM is the total revenue your channel earned per 1,000 video views. After YouTube’s revenue share, across every monetization source — ads, memberships, Super Chat, YouTube Premium.
Find it in Analytics → Revenue → RPM.
CPM (Cost Per Mille) is what advertisers paid YouTube for 1,000 ad impressions on your content. RPM is what you actually receive. The gap is YouTube’s 45% revenue share on long-form ads plus dilution from views that didn’t carry ads.
CPM is an advertiser metric. RPM is a creator metric. Agencies routinely mix them up in client reports.
Current 2026 RPM ranges by content type:
Revenue per 1,000 views — 2026
RPM Ranges Vary 500X by Content Type
After YouTube’s 45% revenue share. Niche selection has more revenue impact than view count for most monetized channels.
A channel earning $3 RPM that moves to $6 RPM doubles revenue without changing view count. That’s the easiest growth lever on most monetized channels. It usually comes from shifting content mix toward higher-intent topics or longer videos that enable mid-roll ads.
In Swydo: RPM isn’t exposed via the YouTube Analytics integration. Log it monthly as a Manual KPI alongside the native YouTube widgets.
13. Brand Lift and Search Lift
Brand Lift and Search Lift are Google Ads measurement studies that quantify the impact YouTube ads have on brand awareness, consideration, and search demand — without requiring a click.
Find them under Tools and Settings → Measurement → Lift Studies in Google Ads.
Most YouTube ad campaigns optimize for direct response. Most YouTube content actually drives behavior days or weeks later, when the viewer searches the brand on Google.
Brand Lift uses surveys to measure awareness/consideration changes among exposed vs control groups. Search Lift measures the increase in branded Google/YouTube searches following ad exposure. Both catch what direct attribution misses.
These studies are now standard in agency-managed YouTube budgets above roughly $10,000 monthly spend. They give the client a defensible mid-funnel number that holds up in a CMO conversation — in a way that “200,000 impressions” never will.
In Swydo: Brand Lift and Search Lift live in the Google Ads integration, not YouTube Analytics. Pull them into the same Swydo report as the YouTube data — they appear in the Google Ads widget panel.
14. Branded Searches and Conversion Lift
Branded Searches is a Google Ads conversion type counting users who searched your brand on Google or YouTube within 30 days of seeing your YouTube ad. Conversion Lift measures the incremental conversions your YouTube ads caused. Both live in the Google Ads Conversions screen.
Branded Searches turn YouTube into a measurable mid-funnel channel for the first time. The metric is eligible for Video, Demand Gen, and Performance Max campaigns. Conversion Lift requires a minimum spend threshold but produces the gold-standard incrementality number in modern marketing measurement — the answer to “what would have happened if we hadn’t run these ads?”
Run both metrics for at least 30 days before reporting them to a client. The first two weeks of any lift study are noisy. The signal stabilizes around day 21.
In Swydo: Branded Searches and Conversion Lift come through the Google Ads integration. Build them into the Revenue section of the same Swydo report as your YouTube widgets.
The 4 YouTube Metrics to Stop Reporting
Some metrics earned their place in 2018 and never left. They should.
1. Total subscriber count as a headline number. Replace with Monthly Audience. Subscriber count measures who once said “yes.” Monthly Audience measures who actually showed up this month.
2. Total channel views (lifetime). Useful for the channel’s About page. Useless on a client report. Lifetime views grow no matter what your work this quarter looked like.
3. Likes-to-dislikes ratio. YouTube removed public dislike counts in 2021. Creators still see their own, but the metric is unreliable as a quality signal and impossible to benchmark against competitors.
4. Average view percentage as a standalone number. Without the retention graph it’s contextless. A 45% AVP could be excellent (10-minute tutorial) or terrible (90-second teaser). Use the retention curve instead.
If your current monthly report leads with any of these four, the report needs work.
Building the Report: Operational Sheet + Strategic Slide
The two-tier scorecard works best as two physical deliverables.
The operational sheet is a live dashboard the agency team checks every Monday. Tier 1 metrics only. The seven that drive content decisions. Set it up once as a Master Template in Swydo, link every client to it, and any change to the master propagates instantly. The alternative is editing fifteen reports by hand the next time YouTube changes a metric.
For agencies running ten or more YouTube clients, the weekly cadence falls apart fast if you’re flipping between fifteen browser tabs. Swydo’s Metrics Overview consolidates the six most important KPIs across every client into one screen — custom views per team, label filtering when you want to see just B2B clients or just retainers.
The strategic slide is a once-a-month PDF or live dashboard you send to the client’s CMO. Tier 2 metrics. Plus the pipeline contribution and attributed revenue numbers from the rest of the client’s funnel — pulled in from Google Ads, GA4, and HubSpot in the same Swydo report. The full list of must-have digital marketing report metrics is a useful starting point if you’re building this slide for the first time.
The executive summary at the top of the strategic slide is the part the CMO actually reads. Swydo AI drafts it automatically — wins, issues, recommendations — using the report’s actual data. You edit before sending. It’s native to Reports and Dashboards, processed in AWS, and not used to train models. The agency’s voice still matters. The AI just takes the first pass off your plate.
These are the marketing KPIs clients care about, not the ones the platform happens to show first.
Common YouTube Metrics Mistakes Agencies Still Make
Four mistakes show up in 80% of underperforming YouTube reports.
1. Leading with subscriber growth. Subscribers don’t pay clients’ bills. Pipeline does. Lead the report with attributed pipeline. Put subscriber growth on page three.
2. Ignoring CTV viewing share. YouTube is the #1 streaming service on US TVs. If your retention strategy is built around 30-second hooks for mobile feeds and half the audience is watching on a TV with a remote, the strategy is wrong for half the audience.
3. Reporting Shorts and long-form together. A Shorts view is not a long-form view. Engagement rates aren’t comparable. RPMs aren’t comparable. Audience overlap is partial at best. Two sections in the report, not one.
4. Mixing operational and strategic in one dashboard. Daily watch time fluctuations don’t belong on a CMO slide. Branded search lift doesn’t belong on a weekly account-manager dashboard. Two deliverables, two audiences.
What’s the one number you’d lead with if a client asked you tomorrow to defend their YouTube budget? If the answer is “subscribers” or “views,” the scorecard needs work.
YouTube Metrics: People Also Ask
Direct answers to what agencies and creators search for most
Split them into two tiers. Seven operational metrics drive weekly content decisions: watch time, retention, CTR, subscribers gained per video, share rate, traffic sources, and Engaged Views. Seven strategic metrics prove business impact monthly: impressions, Monthly Audience, the New/Casual/Regular split, CTV viewing share, RPM, Brand Lift, and Branded Searches.
Most agency reports mix the two tiers into one giant document. That’s why CMOs scan it, find nothing actionable, and conclude YouTube is “fuzzy.”
Watch time is the total minutes viewers spend watching your videos. It’s the single biggest input YouTube’s algorithm uses to decide whether to recommend your content. A video that holds 1,000 people for eight minutes outranks a video viewed 50,000 times for fifteen seconds.
Find it in YouTube Studio under Analytics → Overview → Watch time (hours).
Audience retention is the percentage of each video that viewers actually watch. The retention graph in YouTube Studio shows it second-by-second and is the single most useful diagnostic tool the platform offers.
Read it like an EKG. Sharp drops at 0–15 seconds mean the intro is too slow. Gradual decline means the content is boring. Spikes mean viewers are re-watching that moment — lead with it next time.
Impressions are the number of times your thumbnail appeared on a YouTube surface — home, search, suggested, Shorts feed — where someone could have clicked it. They measure how often YouTube is willing to recommend your video.
Impressions only matter paired with CTR. 100,000 impressions at 2% CTR is worse than 30,000 impressions at 7% CTR — YouTube is showing the first video to the wrong audience and will eventually pull distribution.
CTR (click-through rate) is the percentage of viewers who clicked your thumbnail after it appeared in their feed. It tells you whether your title and thumbnail are doing their job.
Find it under Analytics → Reach → Impressions click-through rate.
Monthly Audience is the number of unique people who watched your channel in a rolling 28-day window. YouTube now positions it as the “real reach” KPI — the modern replacement for subscriber count as the headline number on a channel scorecard.
Subscriber count measures who once said yes. Monthly Audience measures who actually showed up this month.
Go to YouTube Studio (studio.youtube.com), then click Analytics in the left sidebar. The main tabs are Overview, Content, Audience, Inspiration, and Revenue. For per-video data, click any video in the Content tab.
The mobile YouTube Studio app handles daily checks fine. Desktop is better for the weekly trend review and monthly reporting build.
Operational metrics tell your team what content to make next week. Strategic metrics tell the CMO what their budget bought this quarter. Both matter — but not in the same way and not in the same report.
Operational lives on a weekly dashboard the account manager checks every Monday. Strategic lives on a monthly slide deck for the client’s marketing leadership. Mixing them is why most YouTube reports feel “fuzzy.”
Seven. Watch time and audience retention (algorithm signals), CTR (early-warning for distribution cuts), subscribers gained per video (which content actually builds audience), share rate (highest-quality engagement signal), traffic sources (where viewers are coming from), and Engaged Views on Shorts.
These are leading indicators. Each one tells you what to do next, not whether the program worked.
The algorithm decides distribution based on signals from the first 24–48 hours of an upload. The big three are CTR (do people click), retention (do they keep watching), and share rate (do they recommend it).
If CTR drops below 3% or retention falls below the typical-retention line, distribution gets cut within roughly 48 hours. Hit all three signals well and YouTube widens the audience.
A sudden impressions drop almost always means the algorithm flagged a signal — most often a Quality CTR problem (clicks that don’t convert to watch time), a retention floor below the comparison line, or an audience-mismatch pattern.
Check impressions on a 7-day rolling window, not daily. Then look at CTR and retention on recent uploads — that’s where the cause will be.
Quality CTR is YouTube’s internal metric for clicks that lead to sustained watch time. A high raw CTR paired with low retention now hurts distribution rather than helping it — YouTube weights Quality CTR more heavily than raw CTR.
The practical takeaway: don’t make thumbnails that overpromise. Thumbnail-content alignment matters more than thumbnail clickability.
Test thumbnails with YouTube Studio’s built-in Test & Compare feature, which A/B tests up to three thumbnails on the same video automatically. Use it before paying for custom thumbnail design.
Beyond testing: keep titles under 60 characters so they don’t truncate in feed, lead with curiosity not summary, and make sure the thumbnail and title work together rather than repeating each other.
Look at Subscribers Gained per video in Analytics → Content. Identify which specific videos drive subscriptions and which formats lose them. One tutorial gaining 200 subs in a month does more than ten company updates gaining 20 each combined.
Pair it with Subscribers Lost on the same screen — a video gaining 300 and losing 80 has different audience dynamics than one gaining 230 and losing 10. The second is finding the right people. The first is finding people who don’t stick.
Five sources matter. YouTube search is intent-driven — optimize titles and descriptions for keywords. Suggested videos are algorithm-driven — optimize for topical similarity to what viewers just watched. Browse features (home) are subscriber-driven — optimize for upload consistency. External is referral traffic. Direct/unknown is branded loyalty traffic.
Most strategies are picked first and traffic sources checked later. Reverse the order. A channel where 70% of traffic comes from Suggested needs different content than one where 60% comes from Search.
Seven strategic metrics belong on a monthly CMO slide: impressions, Monthly Audience, the New/Casual/Regular viewer split, CTV viewing share, RPM, Brand Lift/Search Lift, and Branded Searches/Conversion Lift.
These prove business impact rather than describing activity. They’re what justifies next quarter’s budget — not “we got 2,000 new subscribers.”
YouTube replaced the binary new vs returning split with three tiers. New viewers are first-time watchers in the period. Casual viewers watched 1–5 months in the past year. Regular viewers watched 6+ months.
Most channels see single-digit percentages hit Regular status — it’s a much harder bar than “subscriber” and a much better loyalty signal for a CMO conversation.
Yes. YouTube is now the #1 streaming service on US TVs — 13.4% of total US TV viewing as of July 2025, the highest share Nielsen has ever recorded for a single distributor. TV has surpassed mobile as YouTube’s #1 watch surface in the US.
CTV viewers behave differently. They watch longer videos, share less, comment less, and convert later — usually by searching the brand on a phone after the TV session ends. If retention strategy is built around 30-second mobile hooks while half the audience is watching on a 65-inch screen, the strategy is wrong for half the audience.
Build an attribution chain. “Views” isn’t ROI. “Views → branded Google searches → demo requests → closed deals → pipeline value” is. Use Branded Searches in Google Ads to measure users who searched the brand within 30 days of seeing your YouTube ad, then connect that to downstream conversions in your CRM.
For budgets above roughly $10,000/month, Brand Lift and Conversion Lift studies give a defensible incrementality number — the answer to “what would have happened if we hadn’t run these ads?”
Both are Google Ads measurement studies. Brand Lift uses surveys to measure changes in awareness and consideration between exposed and control groups. Search Lift measures the increase in branded Google and YouTube searches after ad exposure.
They catch what direct attribution misses — the viewer who saw an ad on a TV and searched the brand on their phone three days later. Run them for at least 30 days; the first two weeks are noisy and the signal stabilizes around day 21.
Branded Searches is a Google Ads conversion type counting users who searched your brand on Google or YouTube within 30 days of seeing your YouTube ad. It’s eligible for Video, Demand Gen, and Performance Max campaigns.
It turned YouTube into a measurable mid-funnel channel for the first time — finally a number you can defend to a CMO that isn’t just “impressions.”
Half of all channels see CTR between 2% and 10%, according to YouTube’s own help docs. The platform average sits at 4–6%.
Channel size shifts the benchmark. Channels under 1,000 subscribers often run 6–10% because impressions go mostly to existing subscribers. Channels over 100,000 typically drop to 3–5% as impressions spread to colder audiences. Below 3% on a new upload is the warning line — YouTube reduces distribution within 24–48 hours.
Good retention depends entirely on video length. Shorter videos should hold a higher percentage.
| Video length | Strong retention | Needs work |
|---|---|---|
| Under 2 minutes | 70%+ | Below 50% |
| 2–5 minutes | 60%+ | Below 45% |
| 5–10 minutes | 50%+ | Below 40% |
| Over 10 minutes | 40%+ | Below 30% |
Education and how-to content runs higher. Entertainment runs lower. The “typical retention” overlay line YouTube Studio shows on every retention graph is more useful than any external benchmark.
There isn’t one. Watch time should be measured against the channel’s own past performance — month-over-month growth, not external averages. Industry averages don’t account for content type, audience, or channel maturity.
Ignore daily fluctuations. The signal lives in the trendline.
1% or higher is strong. Track it as shares divided by views, not as a raw count — a video with 200 shares on 10,000 views (2%) outperforms one with 800 shares on 100,000 views (0.8%).
Shares are the highest-quality engagement signal YouTube collects. High share-rate videos almost always get a second wave of distribution within seven days of upload.
Long enough to hold strong retention, short enough to avoid filler. The retention benchmark by length is the real test — a 12-minute video with 40% retention beats a 6-minute video with 35% retention on watch time.
Videos over 8 minutes also unlock mid-roll ads, which roughly doubles RPM. For monetized channels, the 8-minute floor is a meaningful cutoff.
It varies dramatically by niche.
| Niche | RPM range |
|---|---|
| Finance / business | $10–$25 |
| How-to / tech tutorials | $5–$15 |
| Education / SaaS | $5–$15 |
| Health & wellness | $4–$10 |
| Gaming | $1–$7 |
| Entertainment / vlog | $1–$4 |
| Shorts (any niche) | $0.05–$0.09 |
Moving from $3 to $6 RPM doubles revenue without adding a single view. It usually comes from shifting content mix toward higher-intent topics or longer videos that enable mid-roll ads.
YouTube redefined Shorts views in March 2025. A view now counts the moment a Short starts playing — no minimum watch time required. This matches how TikTok and Reels count views.
The old, stricter definition is now called Engaged Views and is what YouTube uses for monetization eligibility and the Shorts revenue-share pool.
Engaged Views count only Shorts that viewers watched past the brief autoplay threshold — not Shorts they swiped past immediately. It’s the metric YouTube uses to determine YPP eligibility and to calculate Shorts ad revenue share.
Find it under Analytics → Content → Shorts → Engaged views. A Short with 100,000 views but only 5,000 Engaged Views is being algorithmically promoted but not actually watched, and distribution will stop soon.
Per 1,000 views, yes — Shorts RPM runs $0.05–$0.09 versus $1–$25 for long-form. But per watch hour, US Shorts now earn the same as long-form. Alphabet’s CEO confirmed this on the Q3 2025 earnings call.
The old “Shorts monetize at 1/40th the rate of long-form” framing is dead.
No. A Shorts view isn’t a long-form view. Engagement rates, RPMs, and audience behavior all differ. Audience overlap is partial at best.
Build two sections in any client report — Shorts (Engaged Views, swipe-away rate, Shorts RPM) and long-form (watch time, retention, AVD, long-form RPM). Blending them obscures what’s actually working.
CPM (Cost Per Mille) is what advertisers pay YouTube for 1,000 ad impressions. RPM (Revenue Per Mille) is what the creator actually receives per 1,000 video views, after YouTube’s 45% revenue share on long-form ads and dilution from views that didn’t carry ads.
CPM is an advertiser metric. RPM is a creator metric. Agencies routinely confuse them in client reports.
There are two tiers. Expanded YPP (fan-funding only) requires 500 subscribers plus 3,000 watch hours OR 500 subscribers plus 3 million Shorts views in 90 days. Full YPP (ad revenue) requires 1,000 subscribers plus 4,000 watch hours OR 1,000 subscribers plus 10 million Shorts views in 90 days.
Shorts opened a second path to monetization, but the long-form watch-hour threshold still gates ad revenue.
Two deliverables, not one. An operational sheet — a live weekly dashboard with the seven Tier 1 metrics — for your account team. A strategic slide — a monthly PDF or dashboard with the seven Tier 2 metrics plus attributed pipeline — for the client’s CMO.
Daily watch time fluctuations don’t belong on a CMO slide. Branded search lift doesn’t belong on a weekly account-manager dashboard. Two audiences, two reports.
Three windows. A 5-minute daily check on any video posted in the last 48 hours — is CTR above 3%, is retention normal, are comments healthy. A 30-minute weekly trend review of the Tier 1 operational metrics. A 90-minute monthly build of the Tier 2 strategic slide for the CMO.
Anything more frequent is noise. Anything less and problems compound before you catch them.
Four. Total subscriber count as a headline number — replace with Monthly Audience. Lifetime channel views — they grow no matter what you did this quarter. Likes-to-dislikes ratio — unreliable since YouTube hid dislike counts in 2021. Average view percentage as a standalone number — meaningless without the retention curve underneath it.
If a monthly report leads with any of these, the report needs work.
Connect YouTube Analytics once via a reporting platform that pulls native metrics (views, watch time, AVD, subscribers gained/lost, shares, Engaged Views, traffic source type) into reusable widgets. Build the Tier 1 operational dashboard once as a Master Template and link every client to it, so one edit cascades to all of them.
For metrics the YouTube Analytics API doesn’t expose — CTR, impressions, Monthly Audience, RPM, CTV share — use Custom Metrics (calculated from native fields, like Share Rate = shares ÷ views) or Manual KPIs (logged once a month from Studio). Brand Lift and Branded Searches come through the Google Ads integration into the same report.
Four show up in 80% of underperforming reports. Leading with subscriber growth instead of pipeline. Ignoring CTV viewing share while designing for mobile feeds. Blending Shorts and long-form into a single section. Mixing operational and strategic metrics in one dashboard.
The last one is the most common. Daily watch time fluctuations next to quarterly Brand Lift numbers gives the CMO nothing to act on — they scan it, find it “fuzzy,” and stop reading.
Final Thoughts
Two tiers. Two deliverables. Two conversations.
The seven operational metrics are what your account manager actually does work against. Watch time, retention, CTR, subs per video, share rate, traffic sources, Shorts engagement. Set them up in a Swydo Master Template once and link every client to it.
The seven strategic metrics are what justify the budget. Impressions, Monthly Audience, New/Casual/Regular, CTV share, RPM, brand lift, branded searches. Pull them in monthly. Send them to the CMO with a clean executive summary.
The metric that didn’t make either tier — total subscriber count — is the one most agencies still lead with. Replace it with Monthly Audience and the report immediately reads as more current.
The tool stack matters less than the cadence. Studio for diagnostics. One of the best report automation tools for the recurring client deliverable. An SEO tool for optimization.
Swydo includes 10 data sources in the flat rate with unlimited team seats. The 14-day free trial requires no credit card if you want to test the two-tier scorecard before committing. For the broader video-marketing scorecard that extends beyond YouTube into TikTok, Instagram Reels, and LinkedIn video, see Swydo’s video marketing metrics guide.
Track YouTube metrics that actually drive revenue, not vanity numbers.
Start Your Free Trial Today