Keep track of uptime, response times, and downtime trends with Pingdom reports that provide real-time insights. Quickly identify performance issues, minimize disruptions, and ensure a seamless user experience without the hassle of manual monitoring.
▶ Get startedFree for 14 days
No credit card required
Cancel anytime
 2500+Customers
 80+Countries
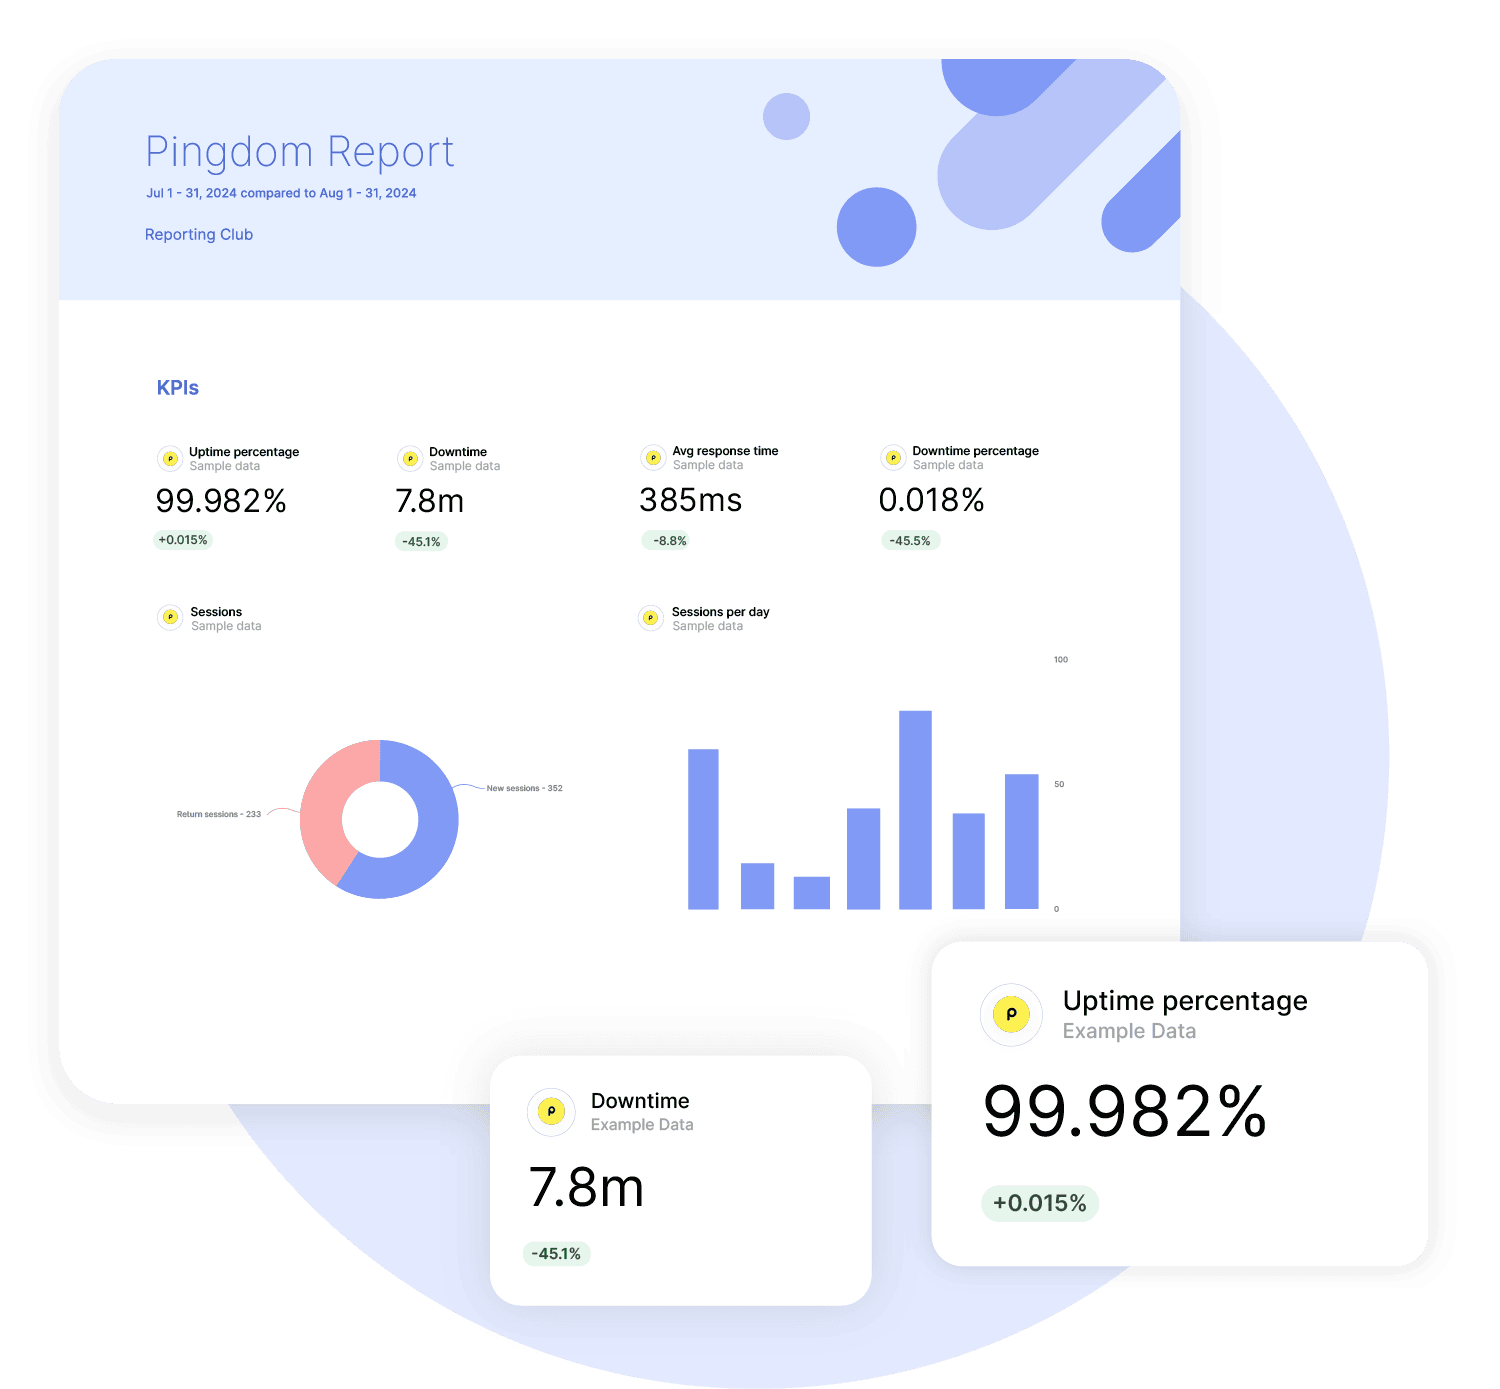
How it works

1. Select
Choose one of our predefined templates or create your own

2. Connect
Connect your data sources

3. Customize
Customize your data to meet your client’s needs

4. Share
Schedule and share a dashboard or PDF report with your team or clients
Heads up: API changes may affect what's shown here.
For the most accurate info, check the Advanced tab in your Swydo account. Missing a metric? Contact Support.

Effortless Pingdom Reporting Tool That Saves Time
Need a simple way to create a Pingdom report without juggling spreadsheets? Swydo’s Pingdom reporting software saves you time. Turn hours of manual tasks into minutes with our pre-built Pingdom report template.
Present your Pingdom KPIs with Swydo’s data visualization tool, deliver a polished Pingdom report or interactive dashboard, and highlight results without the hassle. Update one master template, and every connected report refreshes automatically—no repeated tasks, no errors.
Save hours every monthTurn Your Marketing Objectives into Actual Results
Use our goal tracking and monitoring tools to keep clients updated on key Pingdom metrics like uptime percentage, average response time, downtime, and downtime percentage, and more! Quickly see whether you’re hitting your KPIs or need to pivot. This eliminates guesswork and supports data-driven decisions.
Turn raw data into clear insights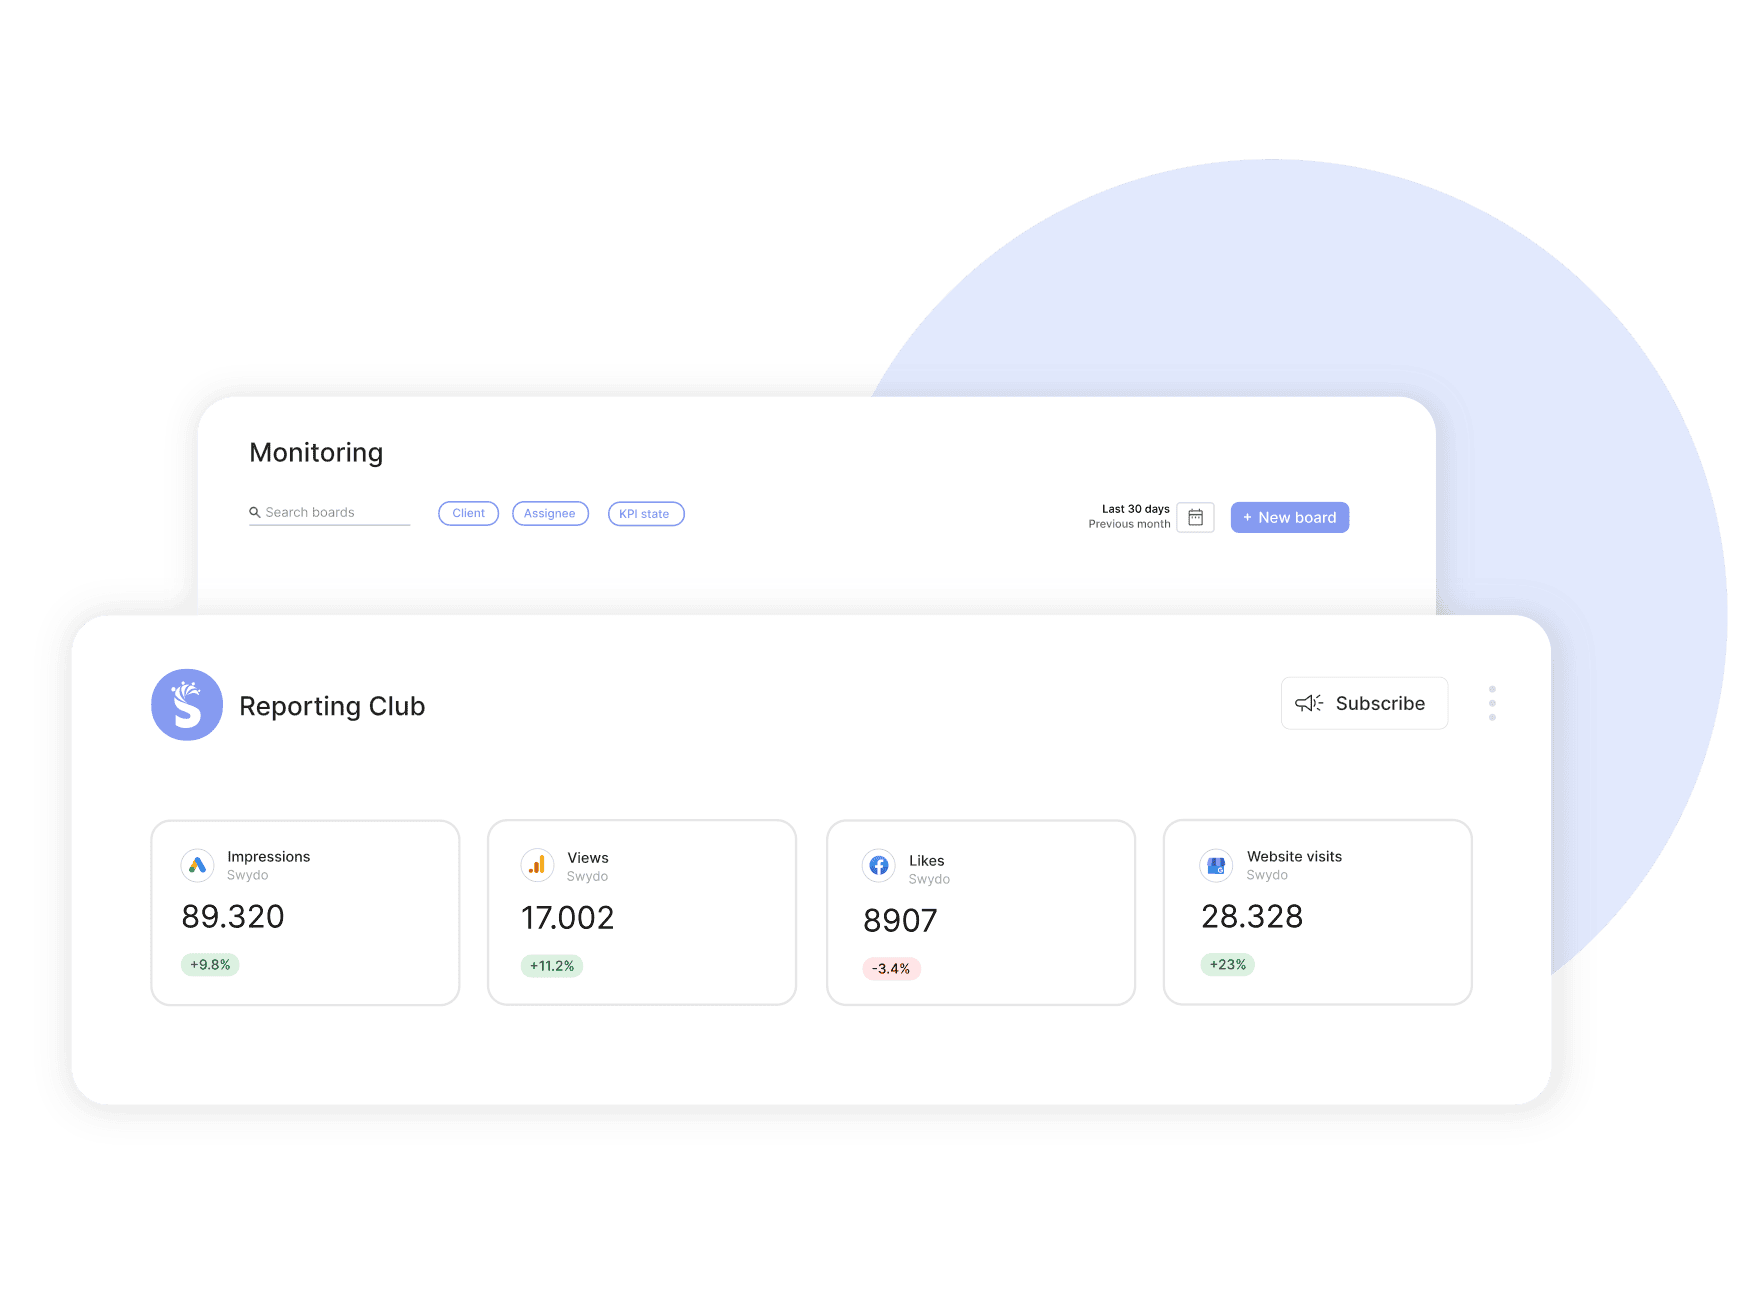
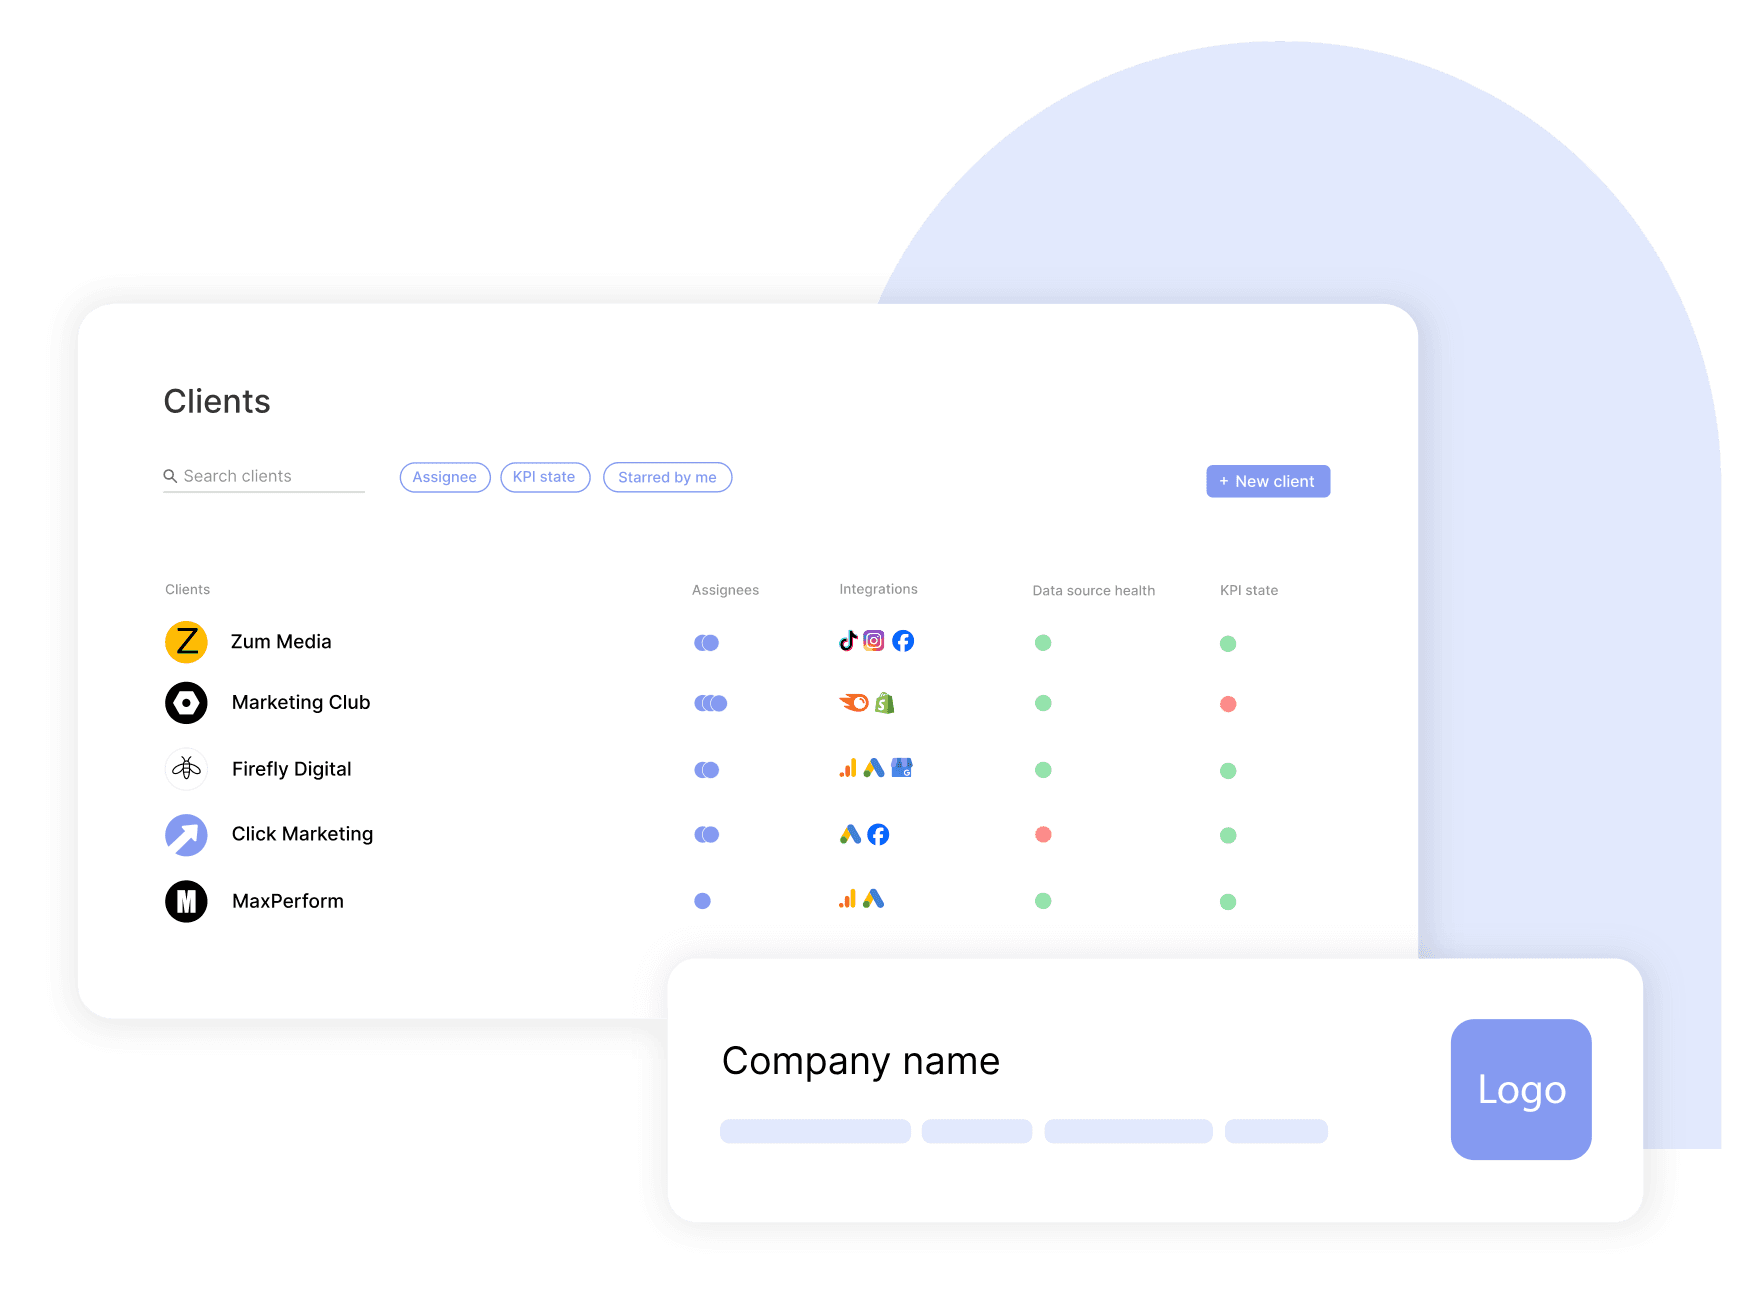
Easily Scale & Manage Multiple Clients
Manage multiple clients with ease and precision. Swydo equips agencies to onboard clients quickly with custom templates, update every client Pingdom report in a single click, and assign team roles for seamless collaboration. Control access, personalize delivery, and free up time to focus on growth—all from one platform.
Start scaling your reporting effortsPresent Your Brand with Confidence
Create white label Pingdom reports that reflect your agency’s look and feel. Include your logos, colors, and layouts to match your style. Use interactive dashboards on your custom domain URL for added trust. Show your expertise while delivering professional, ROI-focused updates.
Showcase your brand in every Pingdom report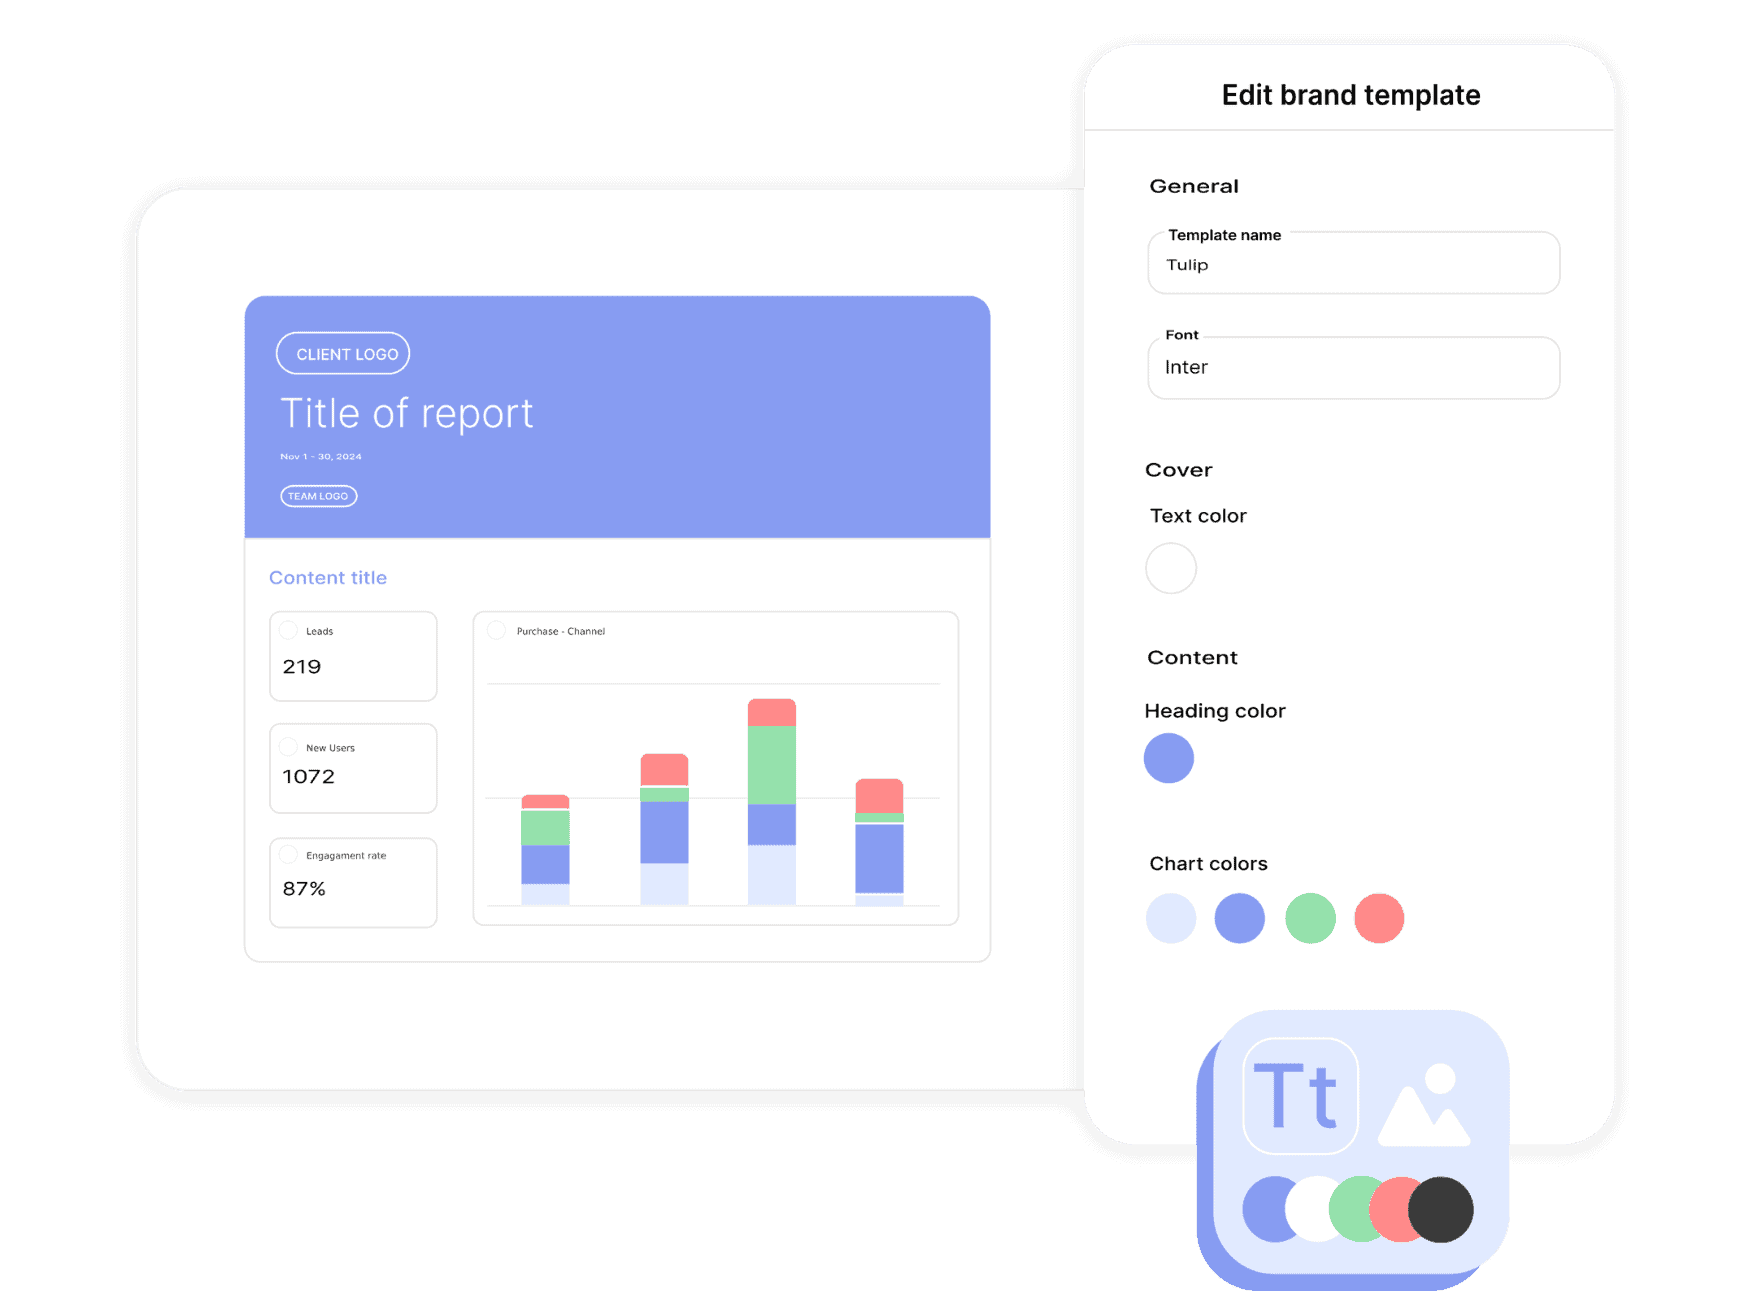
Automate Your Reporting Workflow
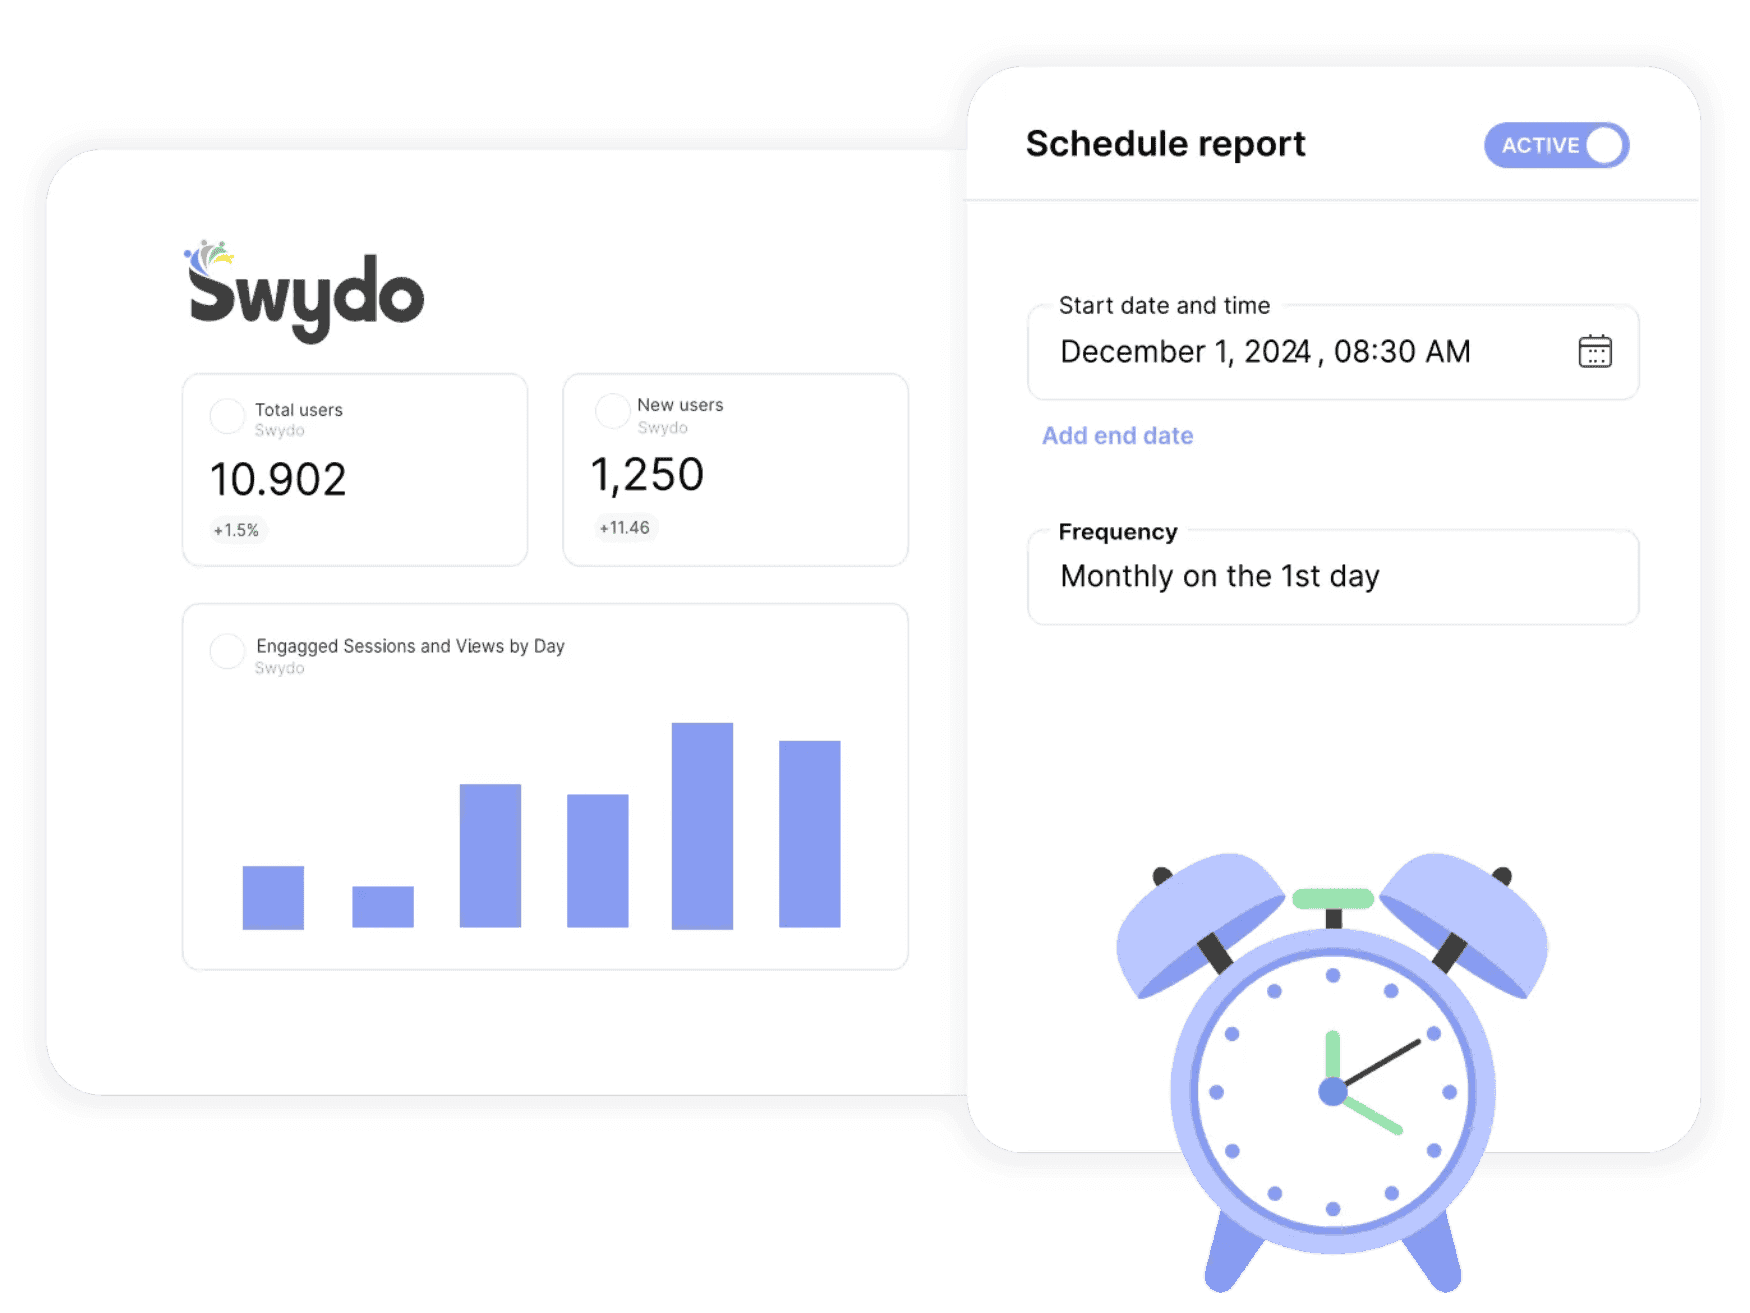
Set up automatic deliveries of your Pingdom dashboards or shareable PDF reports. Configure once and ensure clients receive timely updates daily, weekly, monthly, or quarterly. Swydo automatically retries failed emails, so you never miss a deadline.
Never forget to send another reportSpot & Fix Connection Issues Fast
Accurate reporting starts with reliable data connections. Swydo sends instant alerts if your Pingdom integration connection fails. Reauthorize in a few clicks, and see all data sources on one screen. Control costs by managing active or inactive data feeds.
Keep your data flowing and your reports accurate

Get a single overview of top metrics for all your clients.

Get email alerts when results hit or miss targets.

Enjoy 99%+ report delivery with auto-resends.

Blend data from up to 5 ad platforms into one widget for a single, clear metric.

Blend data from up to 5 ad platforms into one widget for a single, clear metric.

Report-level and KPI status filters allow you to quickly identify issues and take action.
Bring all your PPC, SEO, social media and Google Analytics data together quickly and easily with hundreds of time-saving templates, predefined widgets, and KPIs.
Swydo enables you to build reports which reflect your brand by incorporating your logo, text styles, colors and personalized cover pages.

Swydo gives you the tools to dig deeper with monitoring boards, goals and target alerts, custom metrics, combined data sources, report filters, and more.
Once you’ve created a report, you can schedule and send that report automatically as frequently as needed - monthly, weekly, daily - whatever your clients need.
Customize reports to suit your clients’ needs. Build report templates and widgets from scratch. Provide executive summaries to help better understand the data.
Share your reports via PDF or use our online dashboard report option – whatever suits your clients or team best.
Easily Connect & Integrate Data in a Single Report
 LinkedIn Personal Profile Soon
 Facebook Ads
 Facebook Insights
 Microsoft Ads
LinkedIn Ads
LinkedIn Pages
Microsoft Ads
LinkedIn Ads
LinkedIn Pages
 Instagram Ads
 Instagram Insights
From your client page in Swydo, open the Data Sources tab and click New Data Source, then choose Pingdom. For most platforms you’ll authorize via OAuth; a few (Klaviyo, CallRail, Call Tracking Metrics, ActiveCampaign) use an API key instead. Once authorized, pick the specific account, property, or page you want to report on. Each one becomes a data source you can drop into any report.
Yes. Every Swydo report supports widgets and KPIs from multiple data sources side by side, so a single report can pull from Pingdom, Google Ads, GA4, Meta, and more. For paid-media platforms you can also blend up to five sources inside a single widget — useful for cross-channel ROAS, total spend, or unified conversion tables. Custom blended widgets aren’t available for non-ad platforms, but reports themselves can mix anything.
Yes. Swydo connects via OAuth or scoped API keys, encrypts data in transit over HTTPS, and stores access tokens with role-based controls. Swydo is GDPR-compliant and acts as a data sub-processor under a standard DPA. You can revoke any connection at any time, and on account closure all data and credentials are deleted within 90 days. Full details live on Swydo’s privacy and data-storage pages.
Swydo offers a 14-day free trial with no credit card required. Pricing is based on the number of data sources, not on users (seats are unlimited) or report volume. The flat plan includes 10 data sources, with a per-source rate beyond that which decreases as you scale. Frequency of reporting doesn’t affect cost. Use the calculator at swydo.com/pricing for an exact quote.
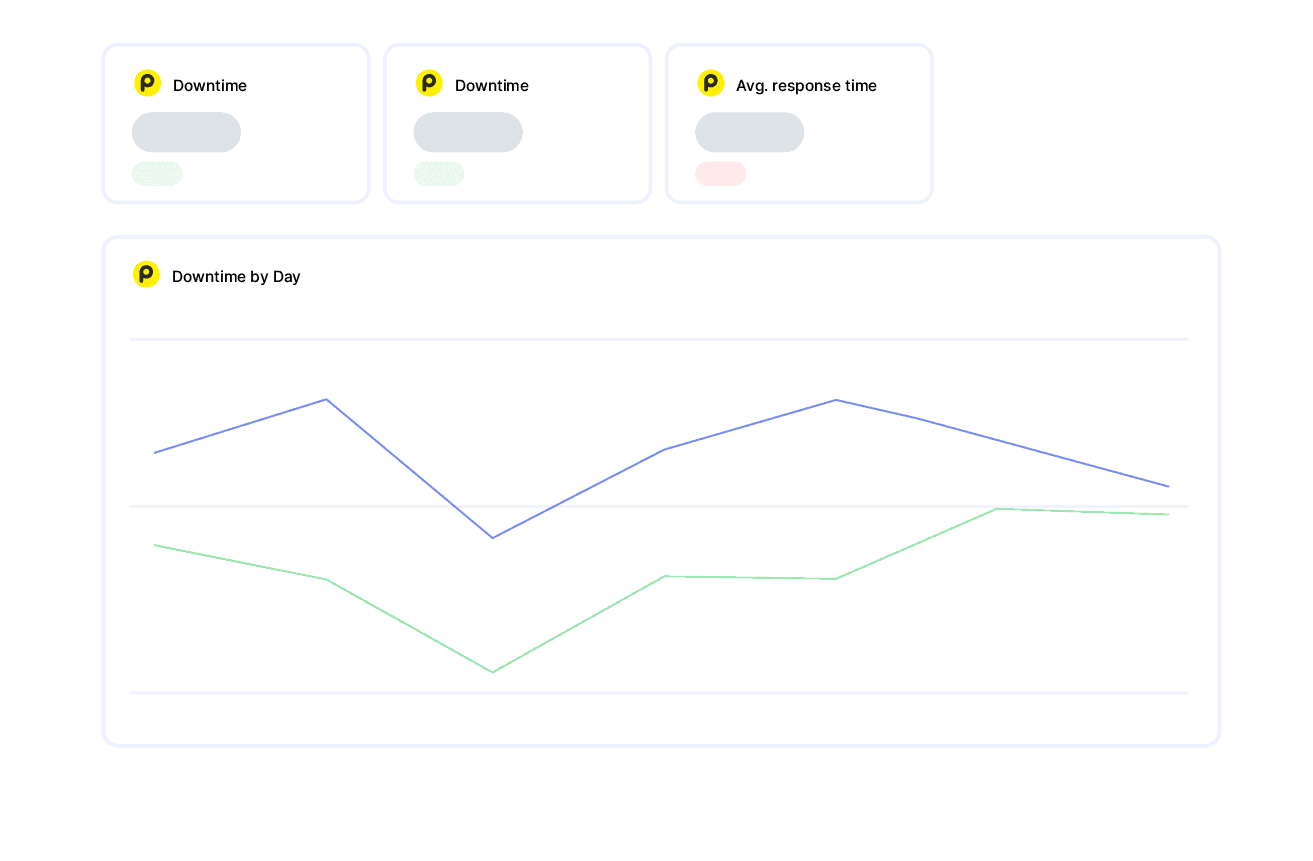
Swydo’s Pingdom integration covers uptime monitoring metrics: uptime percentage, response time, downtime events, and check-level details for each monitored URL. Build per-URL widgets showing uptime trend over time, average response time, and a downtime-events table. Useful as a technical-SEO or web-operations agency deliverable in monthly reports for clients on critical-uptime tiers.
Yes. Each Pingdom check (URL, server, ping target) connects as part of the integration, so you can build per-check widgets showing uptime and response time across all monitored targets. For multi-environment clients (production, staging, marketing site, app), build per-environment sections in one report so clients see the full stability picture in one place.
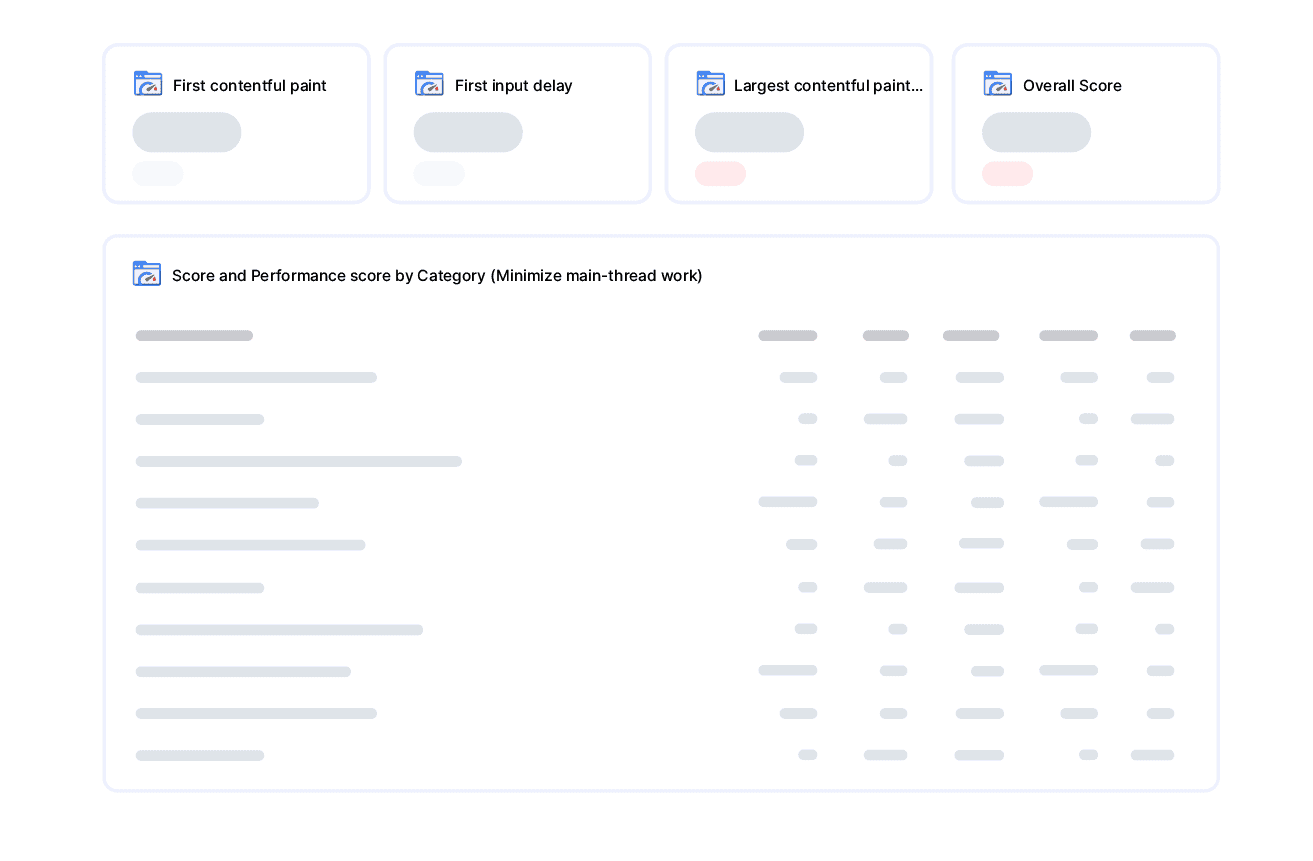
Build a line chart on average response time per check, segmented by region if you’re using Pingdom’s multi-region monitoring. Pair with an uptime trendline above to show clients the relationship between response-time degradation and downtime events. For deeper performance breakdown (page render time, asset-level timing), pair Pingdom with PageSpeed Insights in the same report.
Yes. Pingdom exposes downtime events with timestamps, duration, and check details. Build a downtime-events table widget showing each incident in the period — useful for SLA-reporting deliverables where clients need a transparent record of every interruption. Pair with an uptime-percentage KPI for the headline number and a trendline for context.
Add both Pingdom and PageSpeed Insights to your client and build a Site Health section: Pingdom for uptime and response time (is the site available and responsive?), PageSpeed for Core Web Vitals (is the site performant for users when it’s up?). Together they cover availability + experience, which is the full surface area of a technical-SEO or web-ops monthly deliverable.
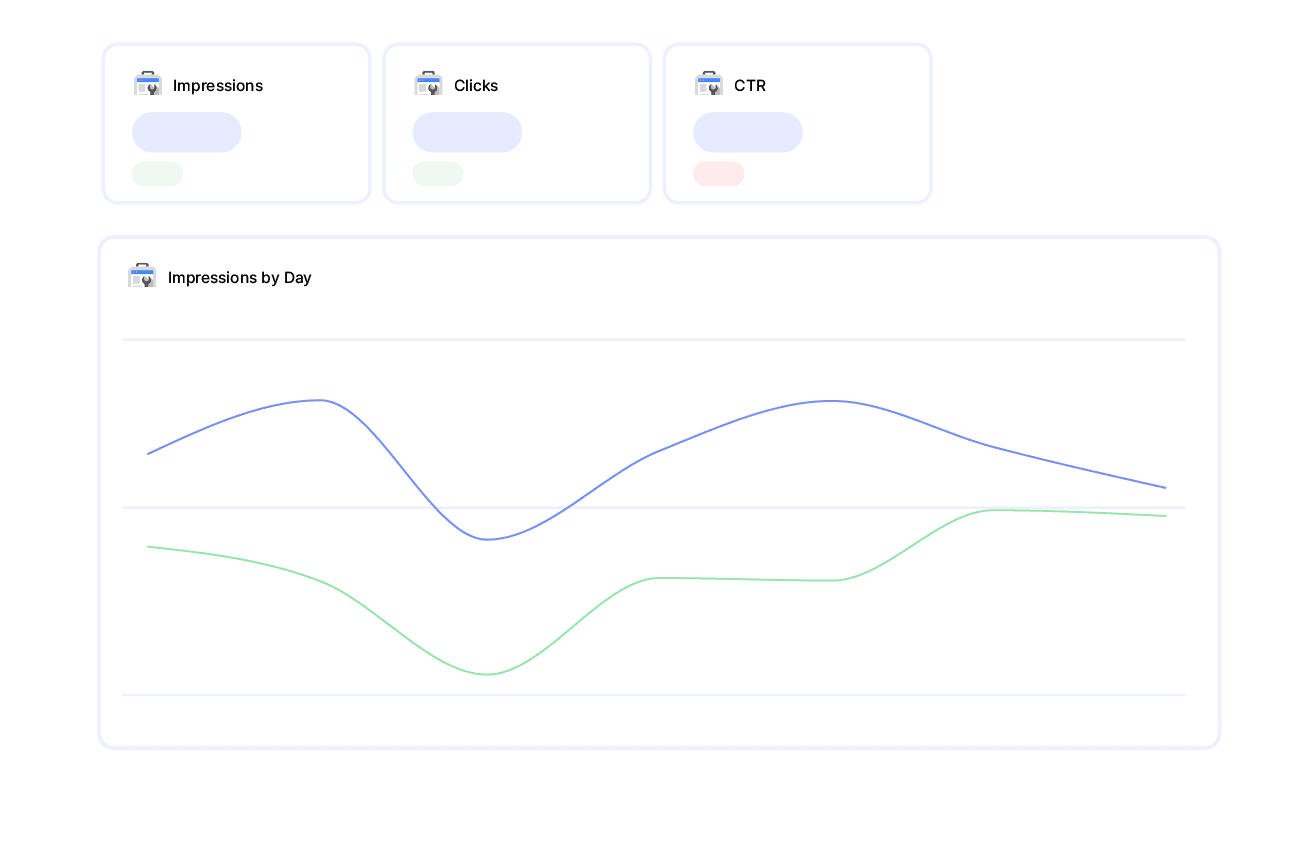
Yes — and this is a high-impact deliverable for sites where downtime has visible revenue or session consequences. Combine Pingdom downtime events with GA4 sessions and conversions on the same timeline. A noticeable dip in GA4 sessions correlated with a Pingdom downtime event becomes a quantifiable cost-of-downtime story for clients. Build the combined view once and reuse across infrastructure-conscious clients.
Sign up for a 14-day free trial or start a subscription. Then:
No, Swydo is designed to be user-friendly and self-service, so no technical skills are required to get started quickly. Our setup guides walk you through every step. If you need assistance, our support team is here to help.
For a quick overview on how to set up your Pingdom account, check out the integration tutorial on our help center.
Yes, Swydo implements industry-standard measures to protect your information. This includes secure data storage, encryption, and compliance with privacy regulations. Learn more here.
Yes, Swydo offers several filter options to help you refine your data and focus on the most relevant insights. Some of the key filter types include:
Yes, you can combine Pingdom data with multiple integrations into one comprehensive report. This allows you to:
Perfect for multi-channel campaigns and seamless reporting.
Swydo actively monitors your data sources to keep everything running smoothly. If there’s a disruption, such as a password change or account update, you’ll receive an alert in the app, and a detailed email with easy steps to resolve the issue.
We accept credit cards (Visa, Mastercard & American Express) and PayPal.
Yes! Our onboarding ensures a seamless start with:
While Swydo is self-service, our support team is always available to help set up your first reports.
Client testimonials
Free for 14 days, no credit card required, cancel at any time
Request a demo ▶ Get started