Why Your Agency Needs a Google Shopping Ads Report Template
Your eCommerce clients don’t just want more traffic—they want profitable sales. Transform product performance chaos into crystal-clear profitability insights that prove every shopping dollar drives measurable revenue growth.
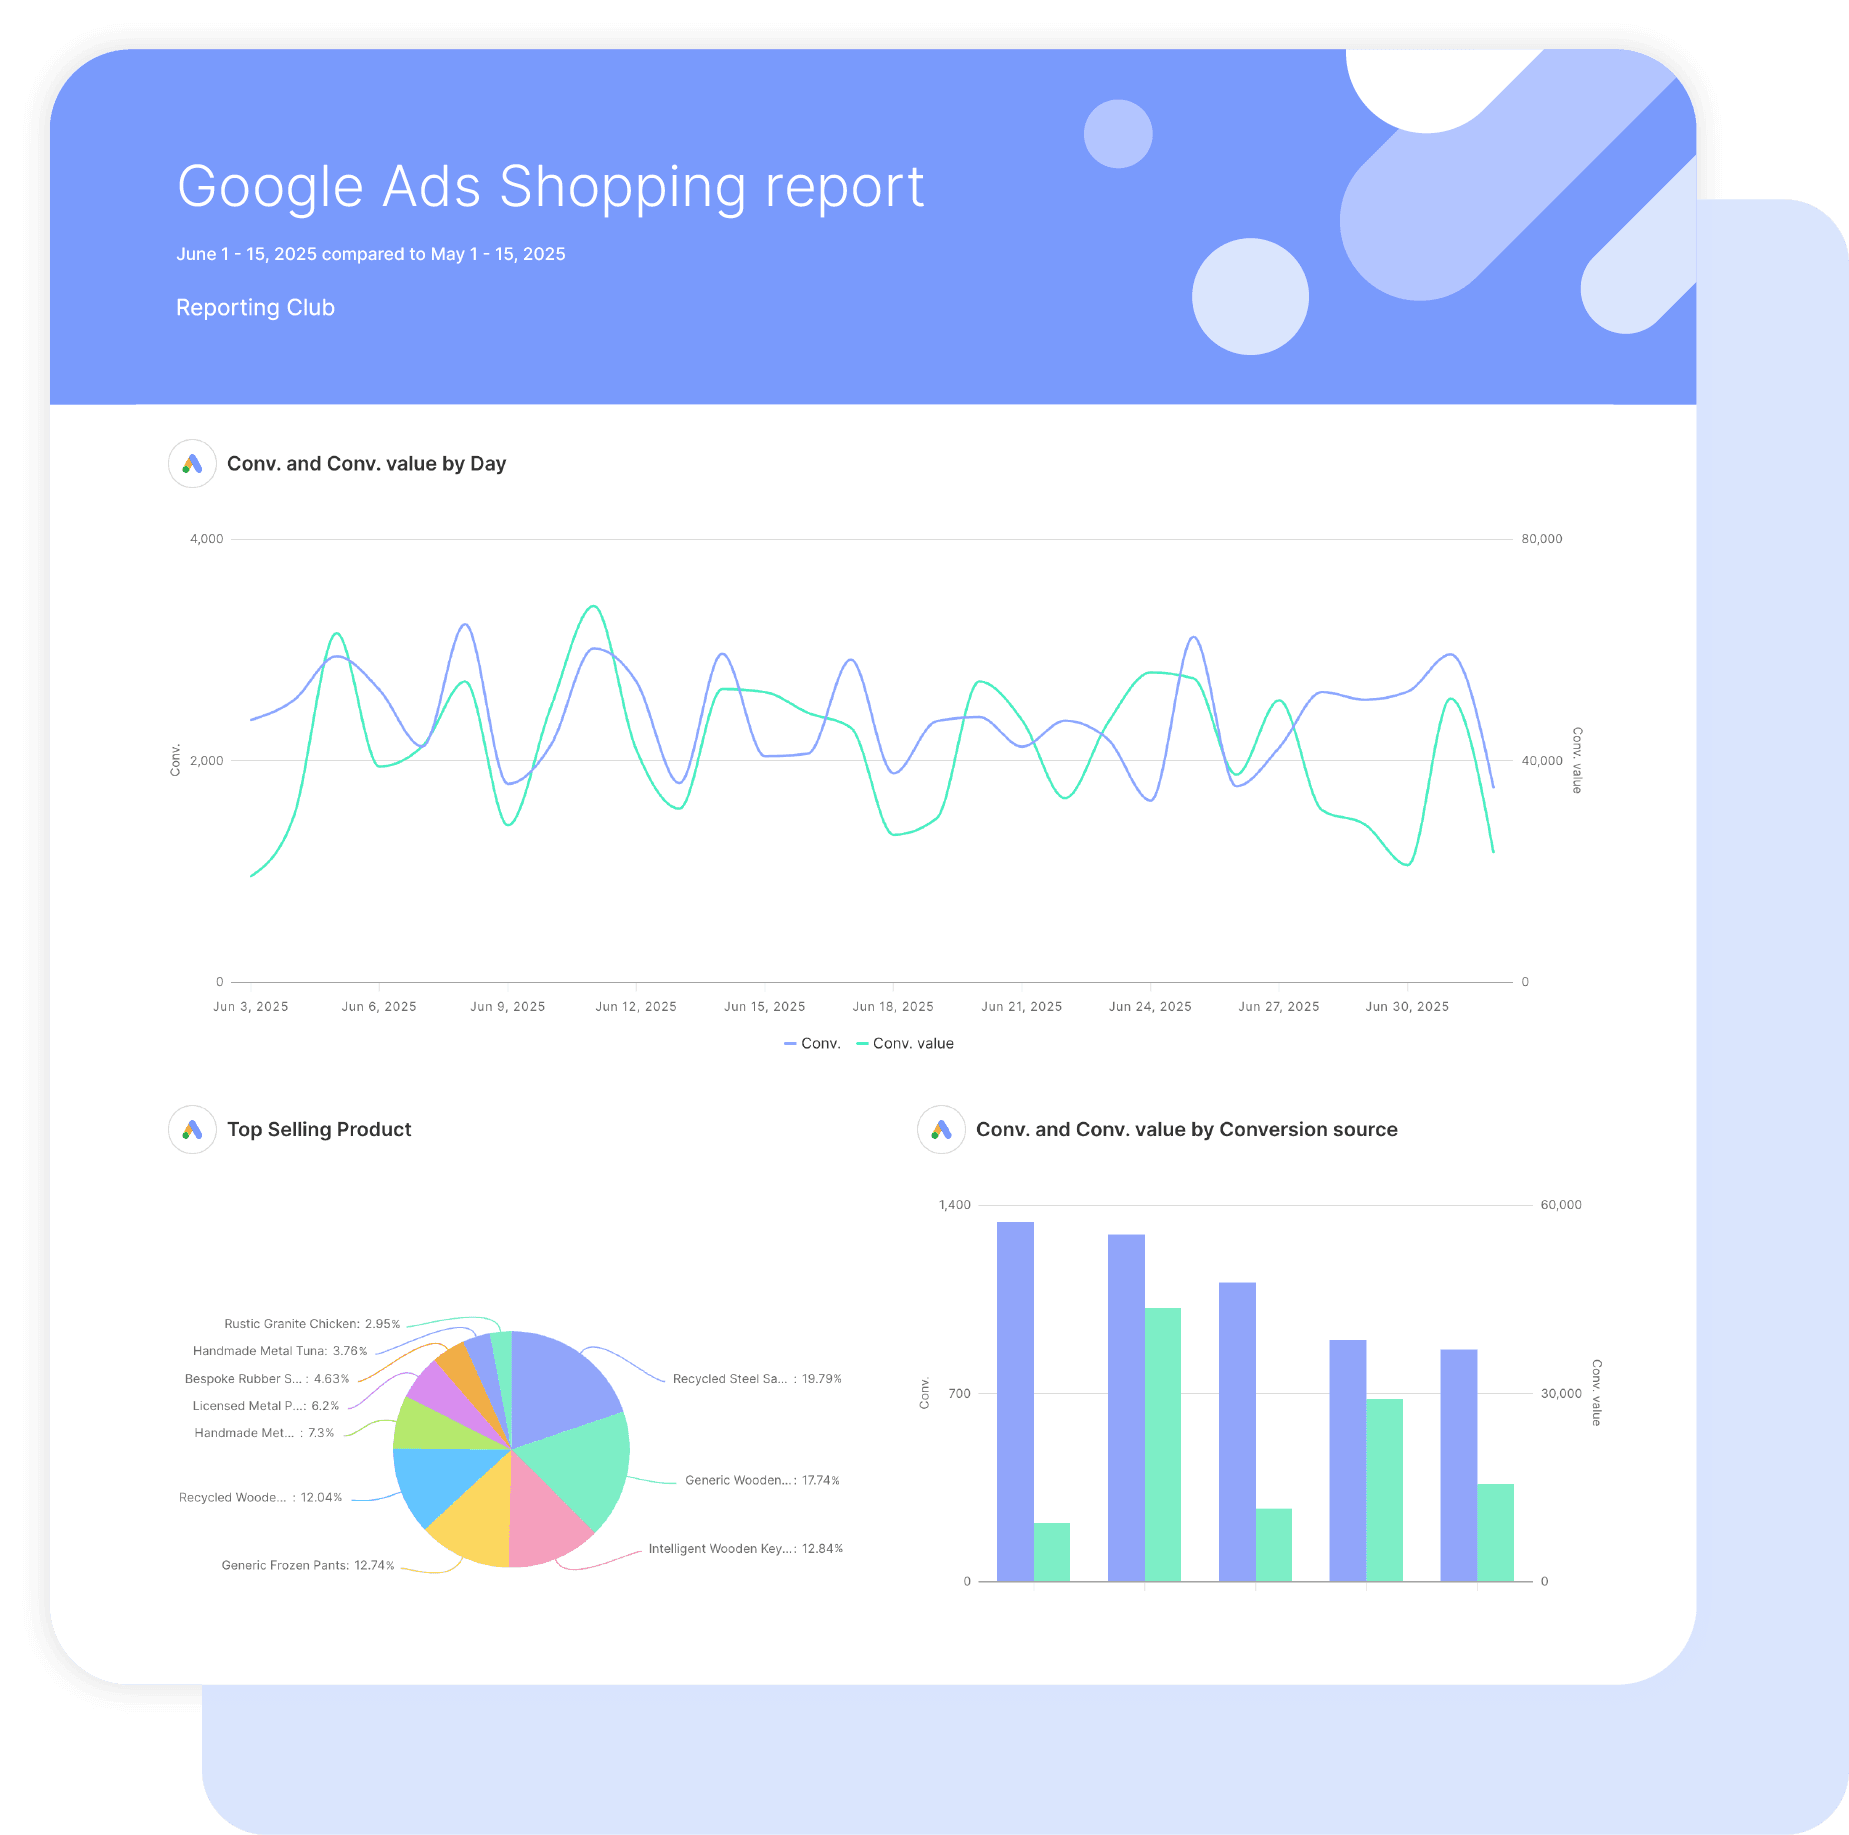
Google Shopping campaigns generate mountains of product-level data that most agencies struggle to decode. Feed performance, product group efficiency, profit margins, competitive positioning—it’s overwhelming without the right framework.
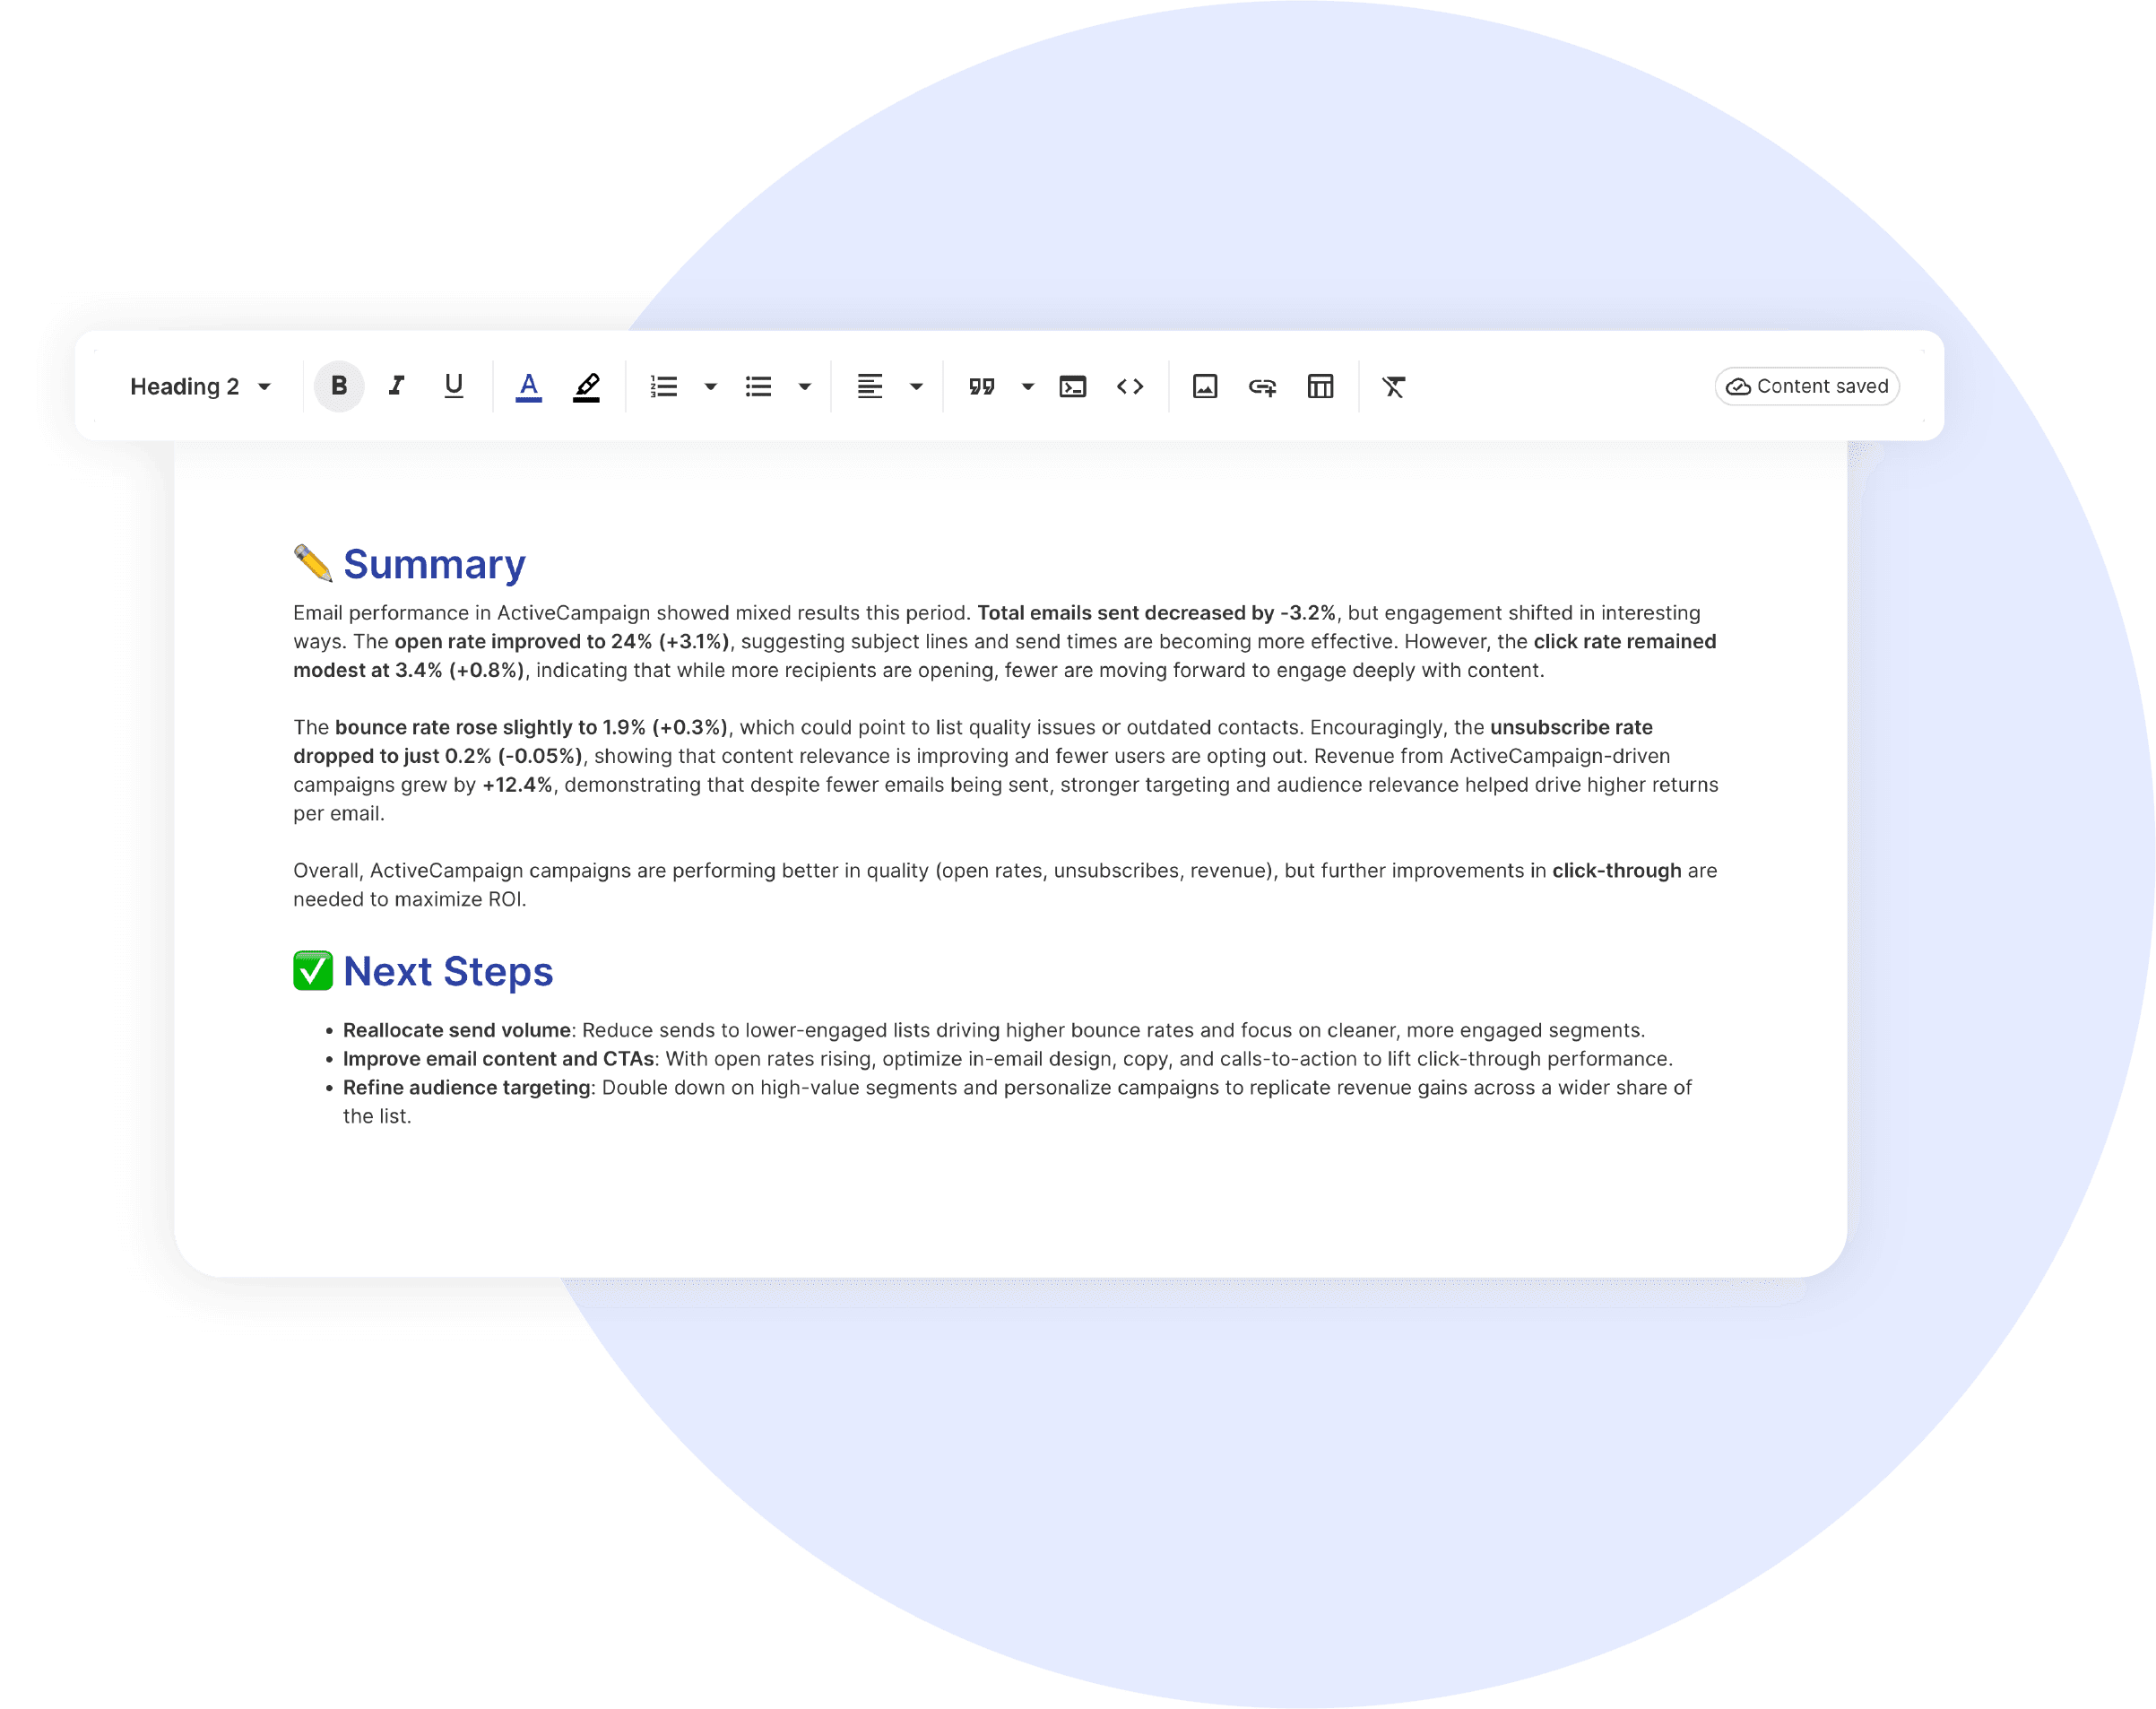
Your clients invest serious budgets expecting Shopping campaigns to deliver bottom-line results. Stop losing credibility with generic reports that miss the profit story. This Google Shopping template connects every product impression to actual revenue impact, turning complex eCommerce data into compelling profit narratives that justify campaign investments and secure budget increases.
What Makes Swydo’s Google Shopping Ads Report Template Different
Shopping-Native Analytics
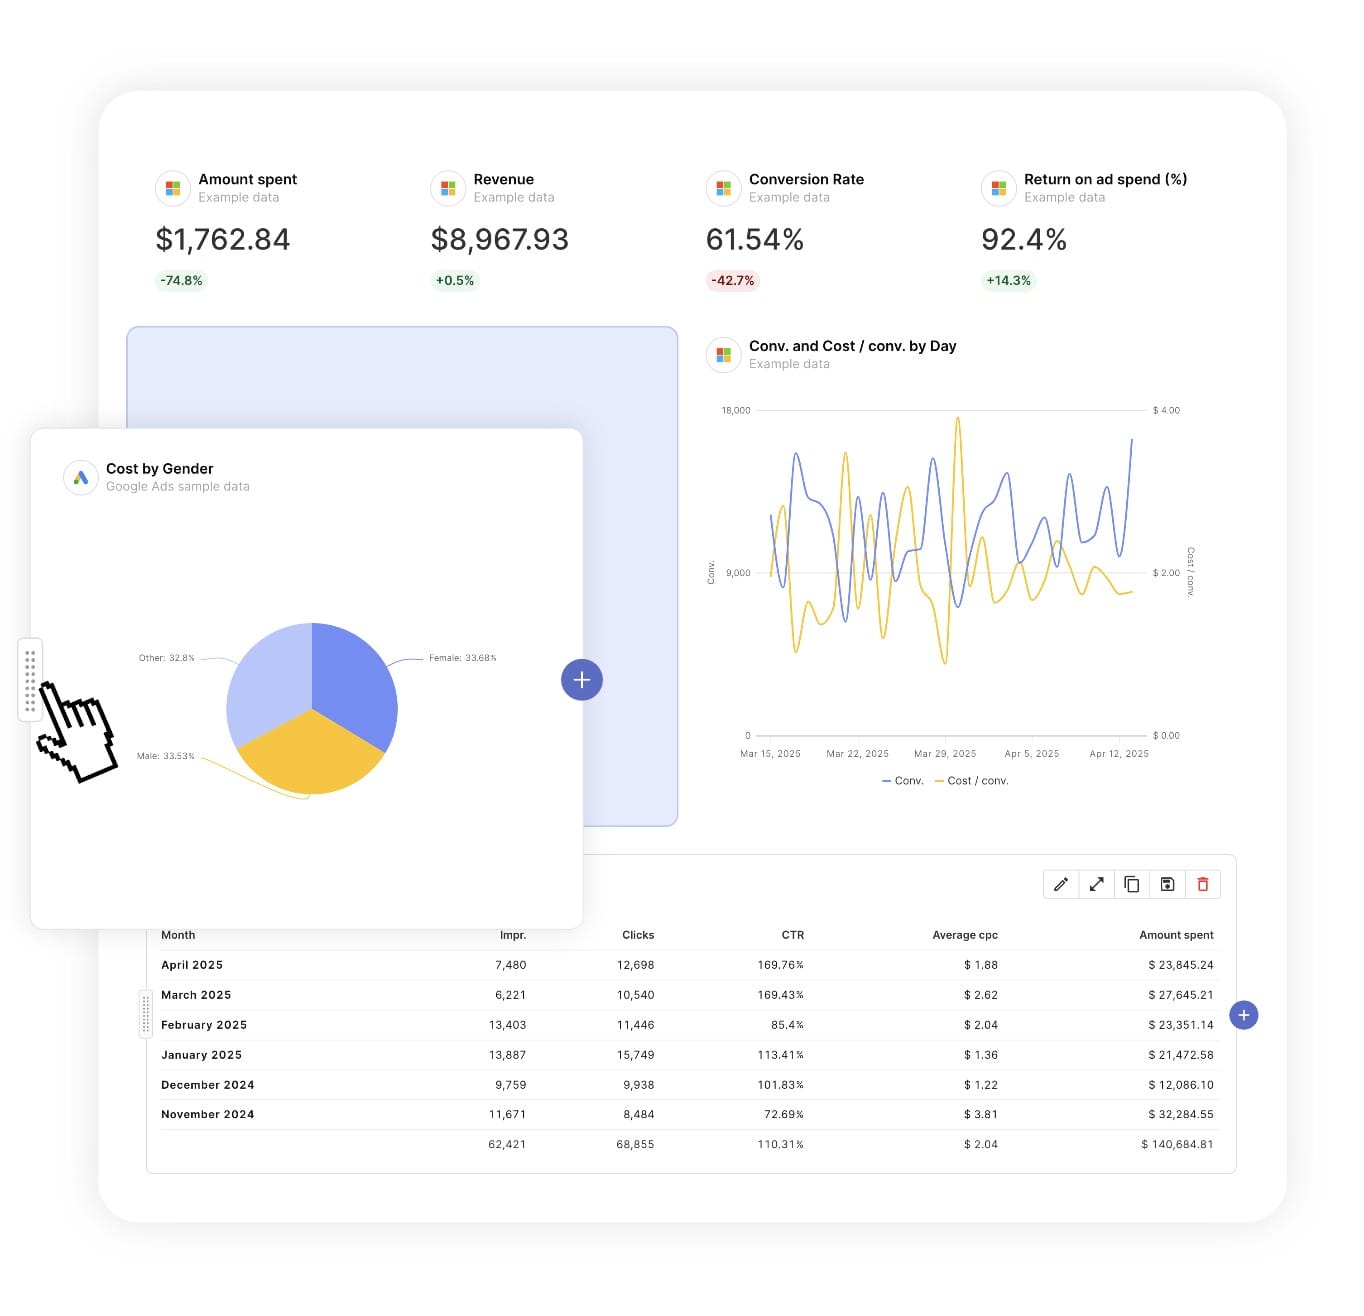
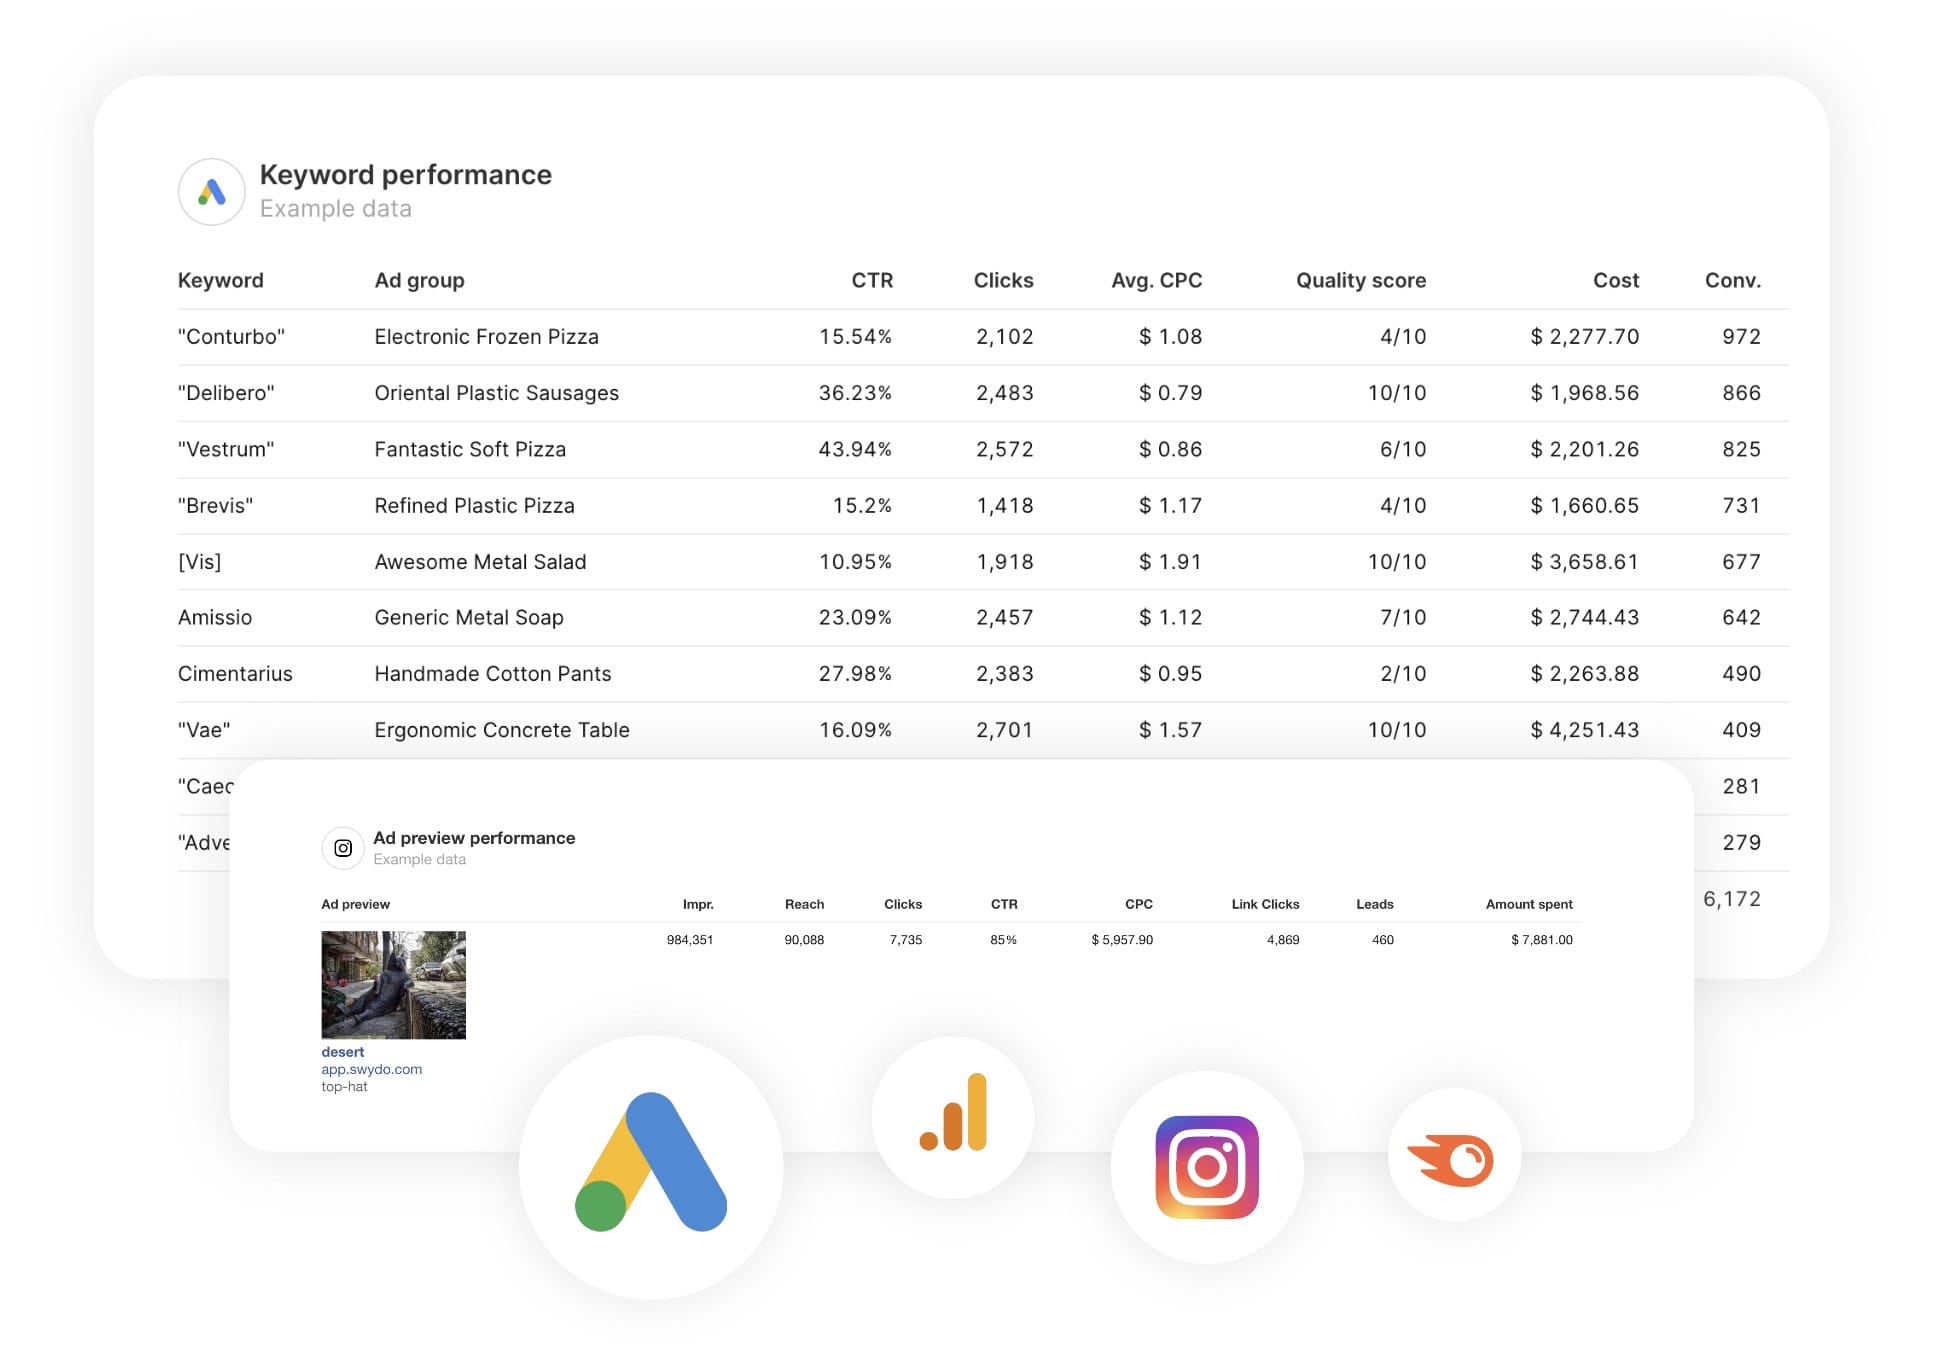
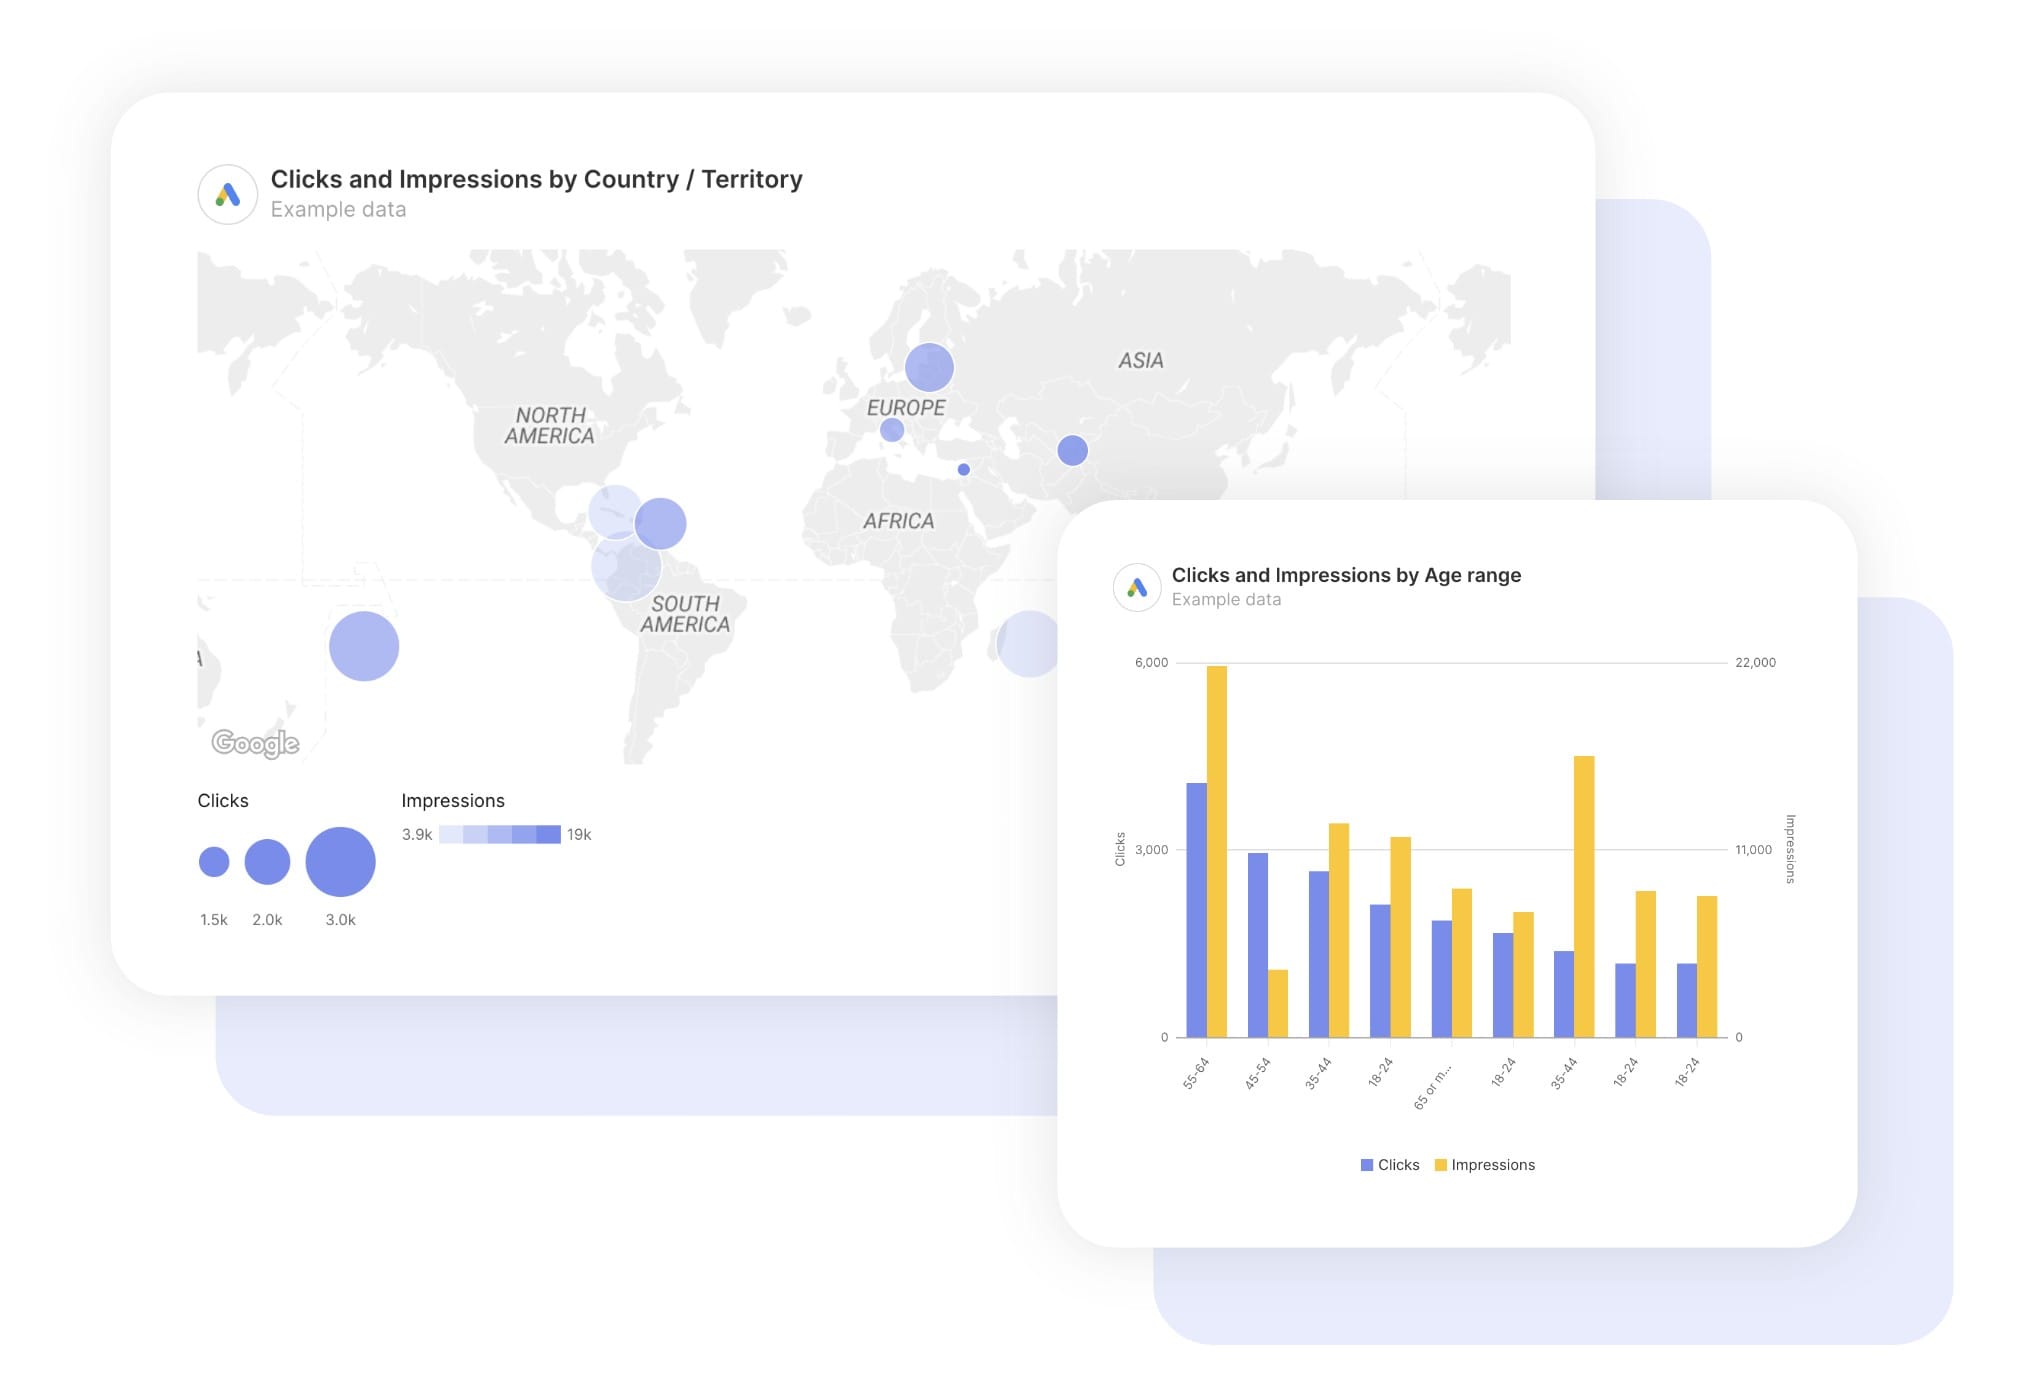
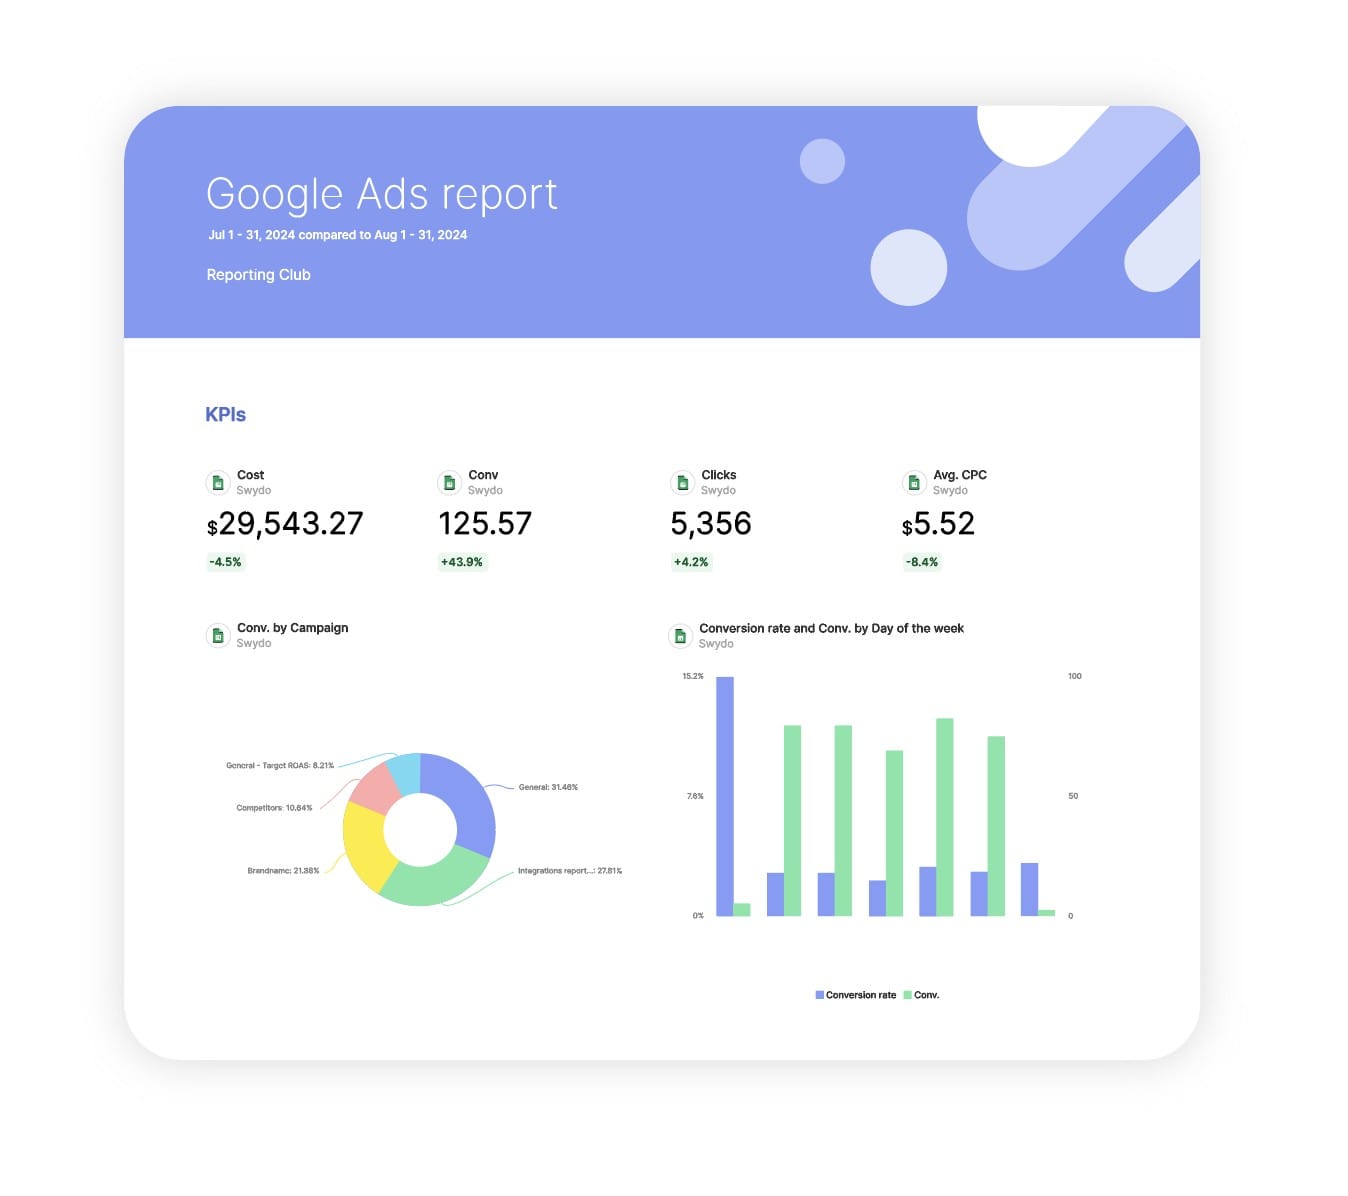
Track metrics that matter for eCommerce. Search impression share, conversion rates by product group, ROAS analysis, and profit tracking through Google Ads data. No generic search campaign metrics—just Google Shopping expertise.
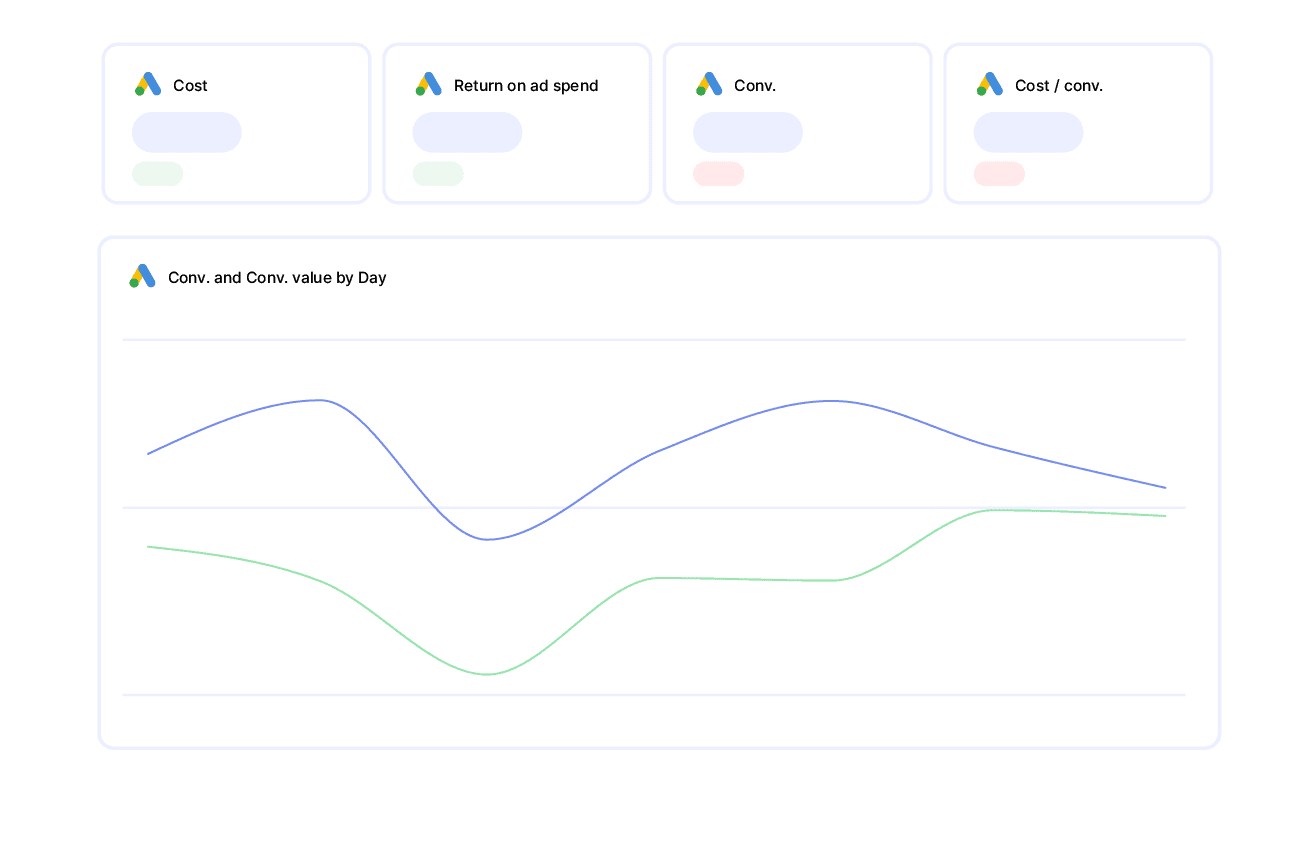
Advanced Product Performance
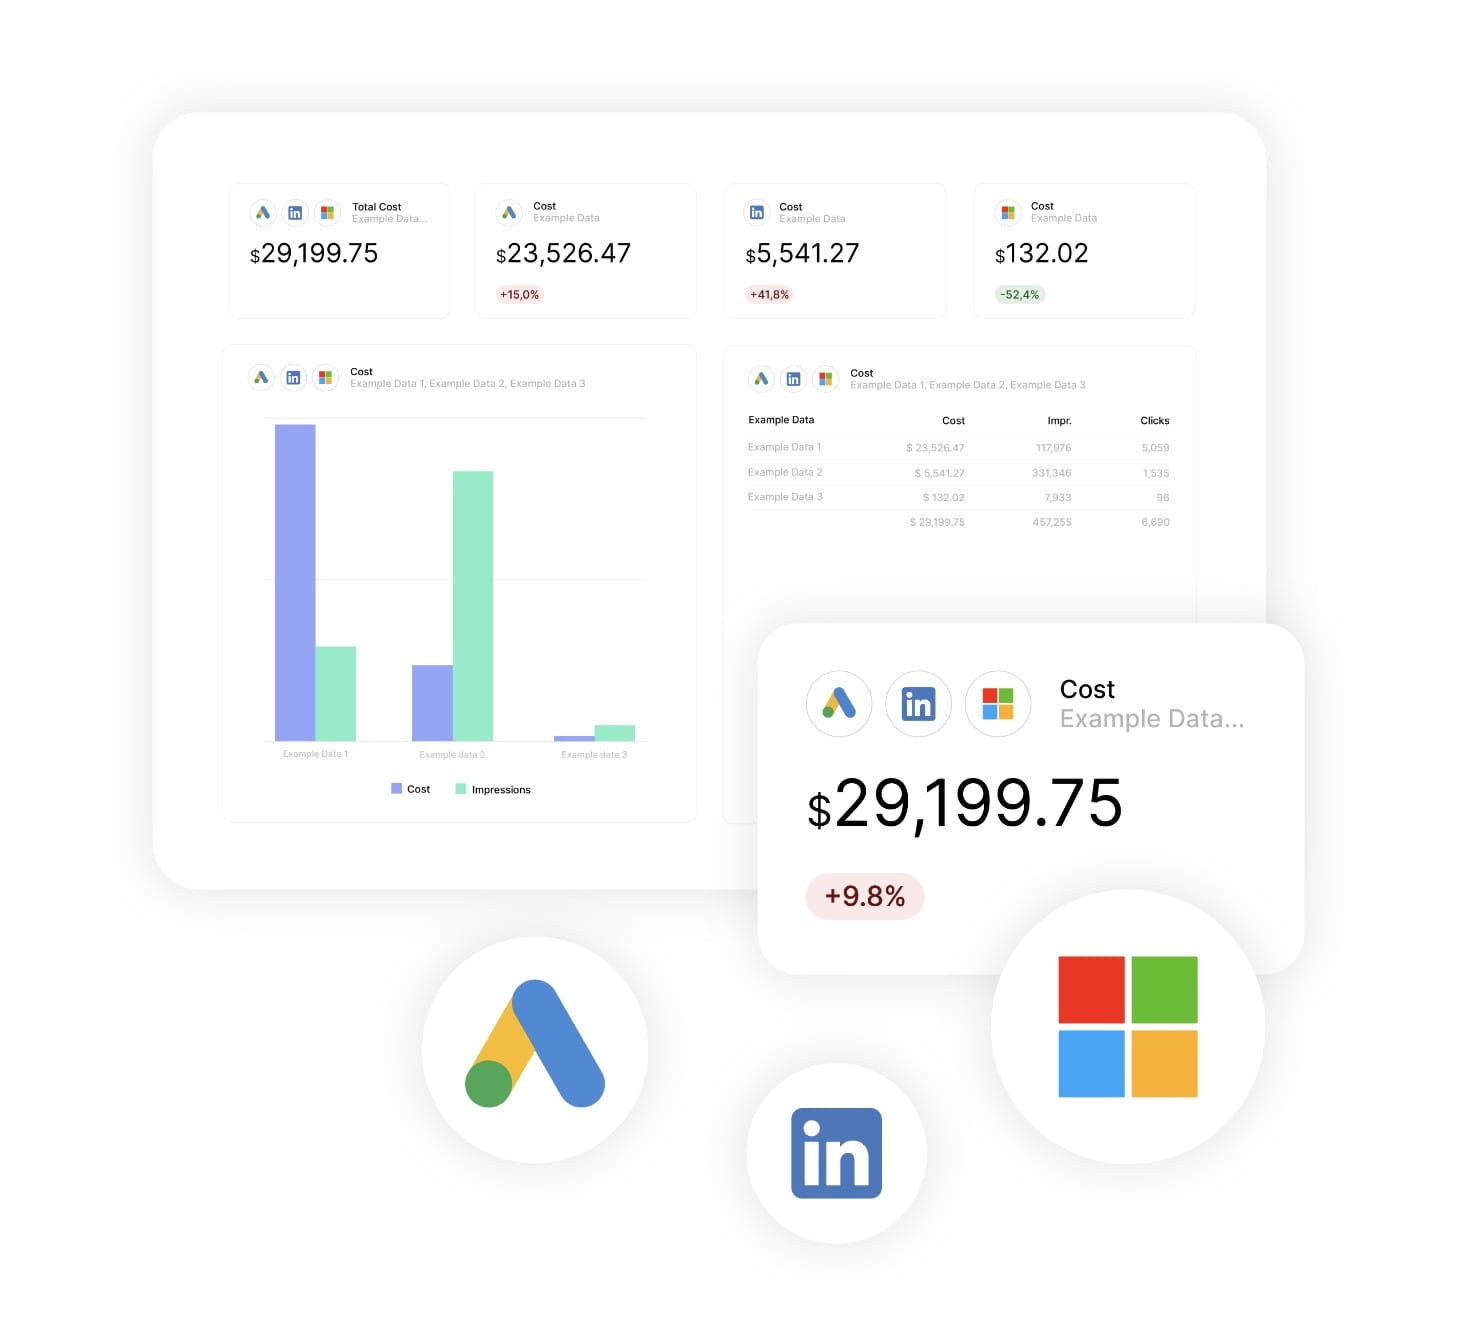
Google Shopping isn’t search campaigns. Our report template highlights product performance optimization through Google Ads data, Shopping-specific bidding patterns, and eCommerce conversion tracking that justifies Shopping’s premium performance potential.
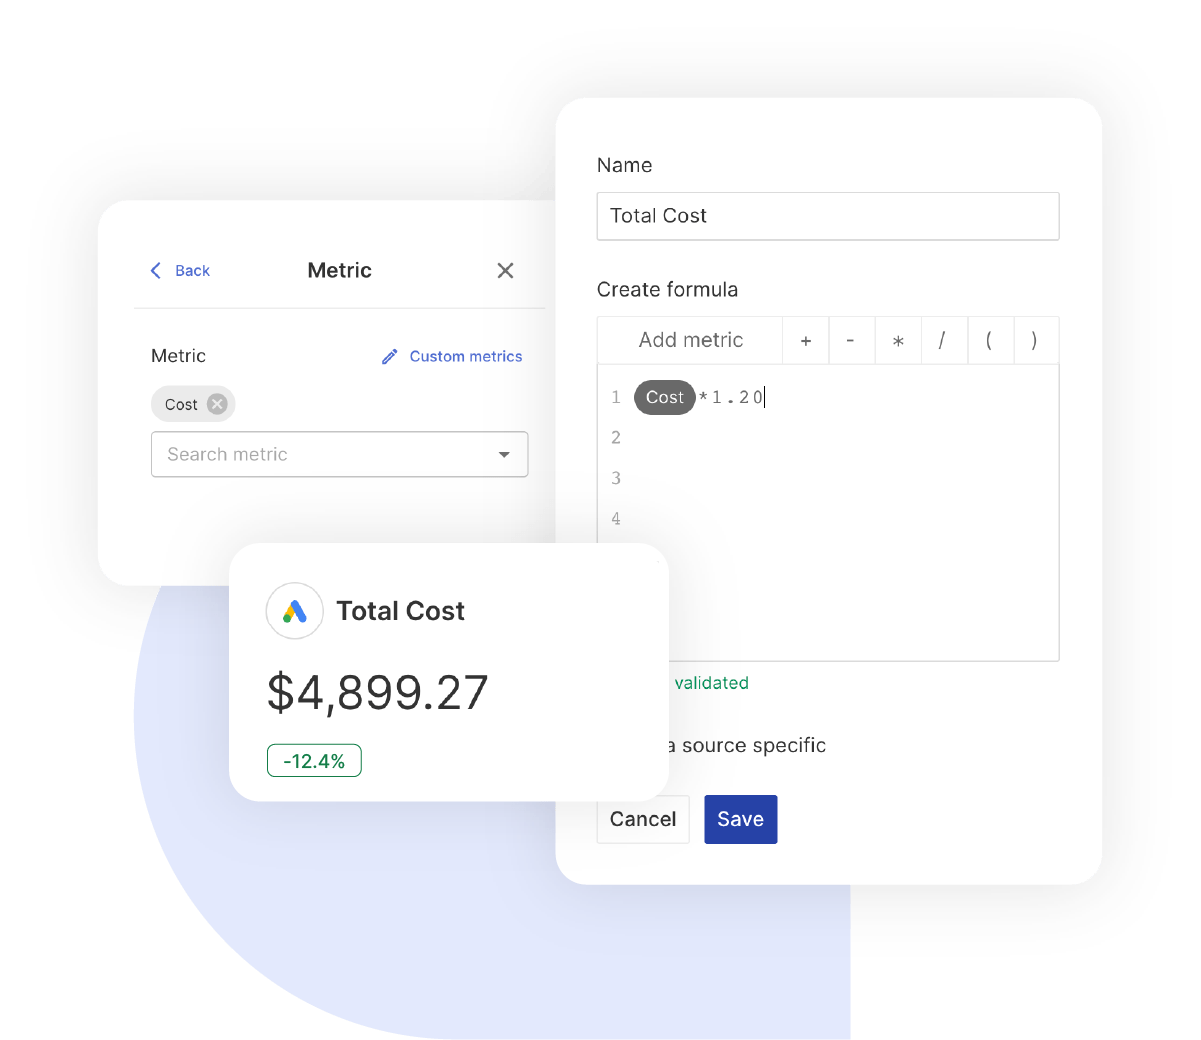
Custom Profit Tracking
Create powerful custom calculations like profit margin per product, cost per profitable conversion, and product group efficiency rates. Combine any Google Shopping metrics to tell your unique eCommerce success story.