Lead Generation Report

Lead Generation Report Template

Swydo’s pre-built Lead Generation report template connects marketing activity to real pipeline and revenue outcomes.

Track leads, MQLs, SQLs, sales opportunities, and customer acquisition performance in one automated dashboard that shows exactly how marketing contributes to business growth.

Ideal for agencies and marketers who want to: Prove lead quality, demonstrate revenue impact, and give clients a complete view of funnel performance without manual reporting.

Data sources Google Analytics 4 Google Search Console Semrush Facebook Ads Instagram Ads LinkedIn Ads YouTube X (Twitter) Ads TikTok Ads
Preview ▶ Get started

Free for 14 days

No credit card required

Cancel anytime

Lead Generation Report

How it works

select template white

1. Select

Choose one of our predefined templates or create your own

connect white

2. Connect

Connect your data sources

customize white

3. Customize

Customize your data to meet your client’s needs

share white

4. Share

Schedule and share a dashboard or PDF report with your team or clients

Choose Swydo's Lead Generation Template

Save time, impress clients, and grow your agency with Swydo's automated reporting solutions.

Swydo item

Save Hours
Streamline reporting and reclaim your day.

Swydo item

Actionable Insights
Present key Lead Generation report metrics in a way that clients instantly understand.

Swydo item

All-in-One Reporting
Visualize, share, and manage all your Lead Generation data from one spot.

Swydo item

Custom Branded Reports
Present clients with tailored, on-brand Lead Generation reports.

Swydo item

Agency Mark-up
Set your agency markup once. Flat or percentage & auto-apply.

Swydo item

Win More Business
Impress in pitches with Lead Generation reports that showcase your expertise.

Why Your Agency Needs a Lead Generation Report Template

You didn’t start an agency to spend Sunday nights copy-pasting numbers from Google Ads, Meta, HubSpot, and your call tracking dashboard into a deck. You started it to grow your clients’ businesses. A lead generation report template gives you back those hours and gives your clients the one thing they actually want: proof that the leads you’re sending are turning into customers.

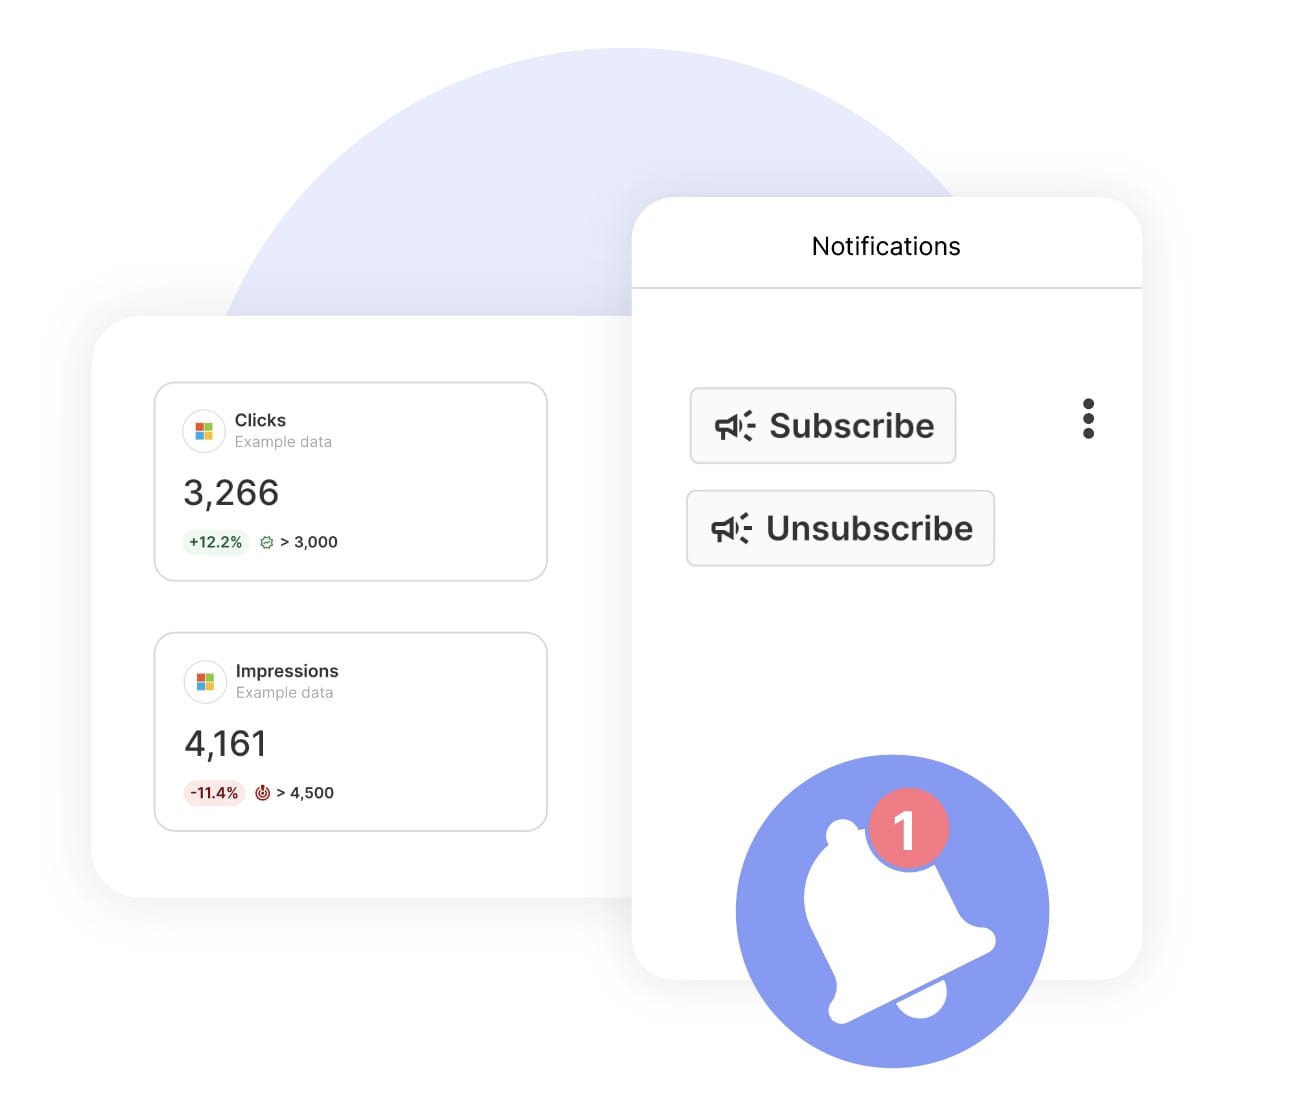
Most agencies still report on what’s easy to count — clicks, impressions, leads. Clients hear those numbers and ask the same follow-up every time: “Yes, but how many became customers?” If you can’t answer that in the report, you’re going to answer it on the renewal call.

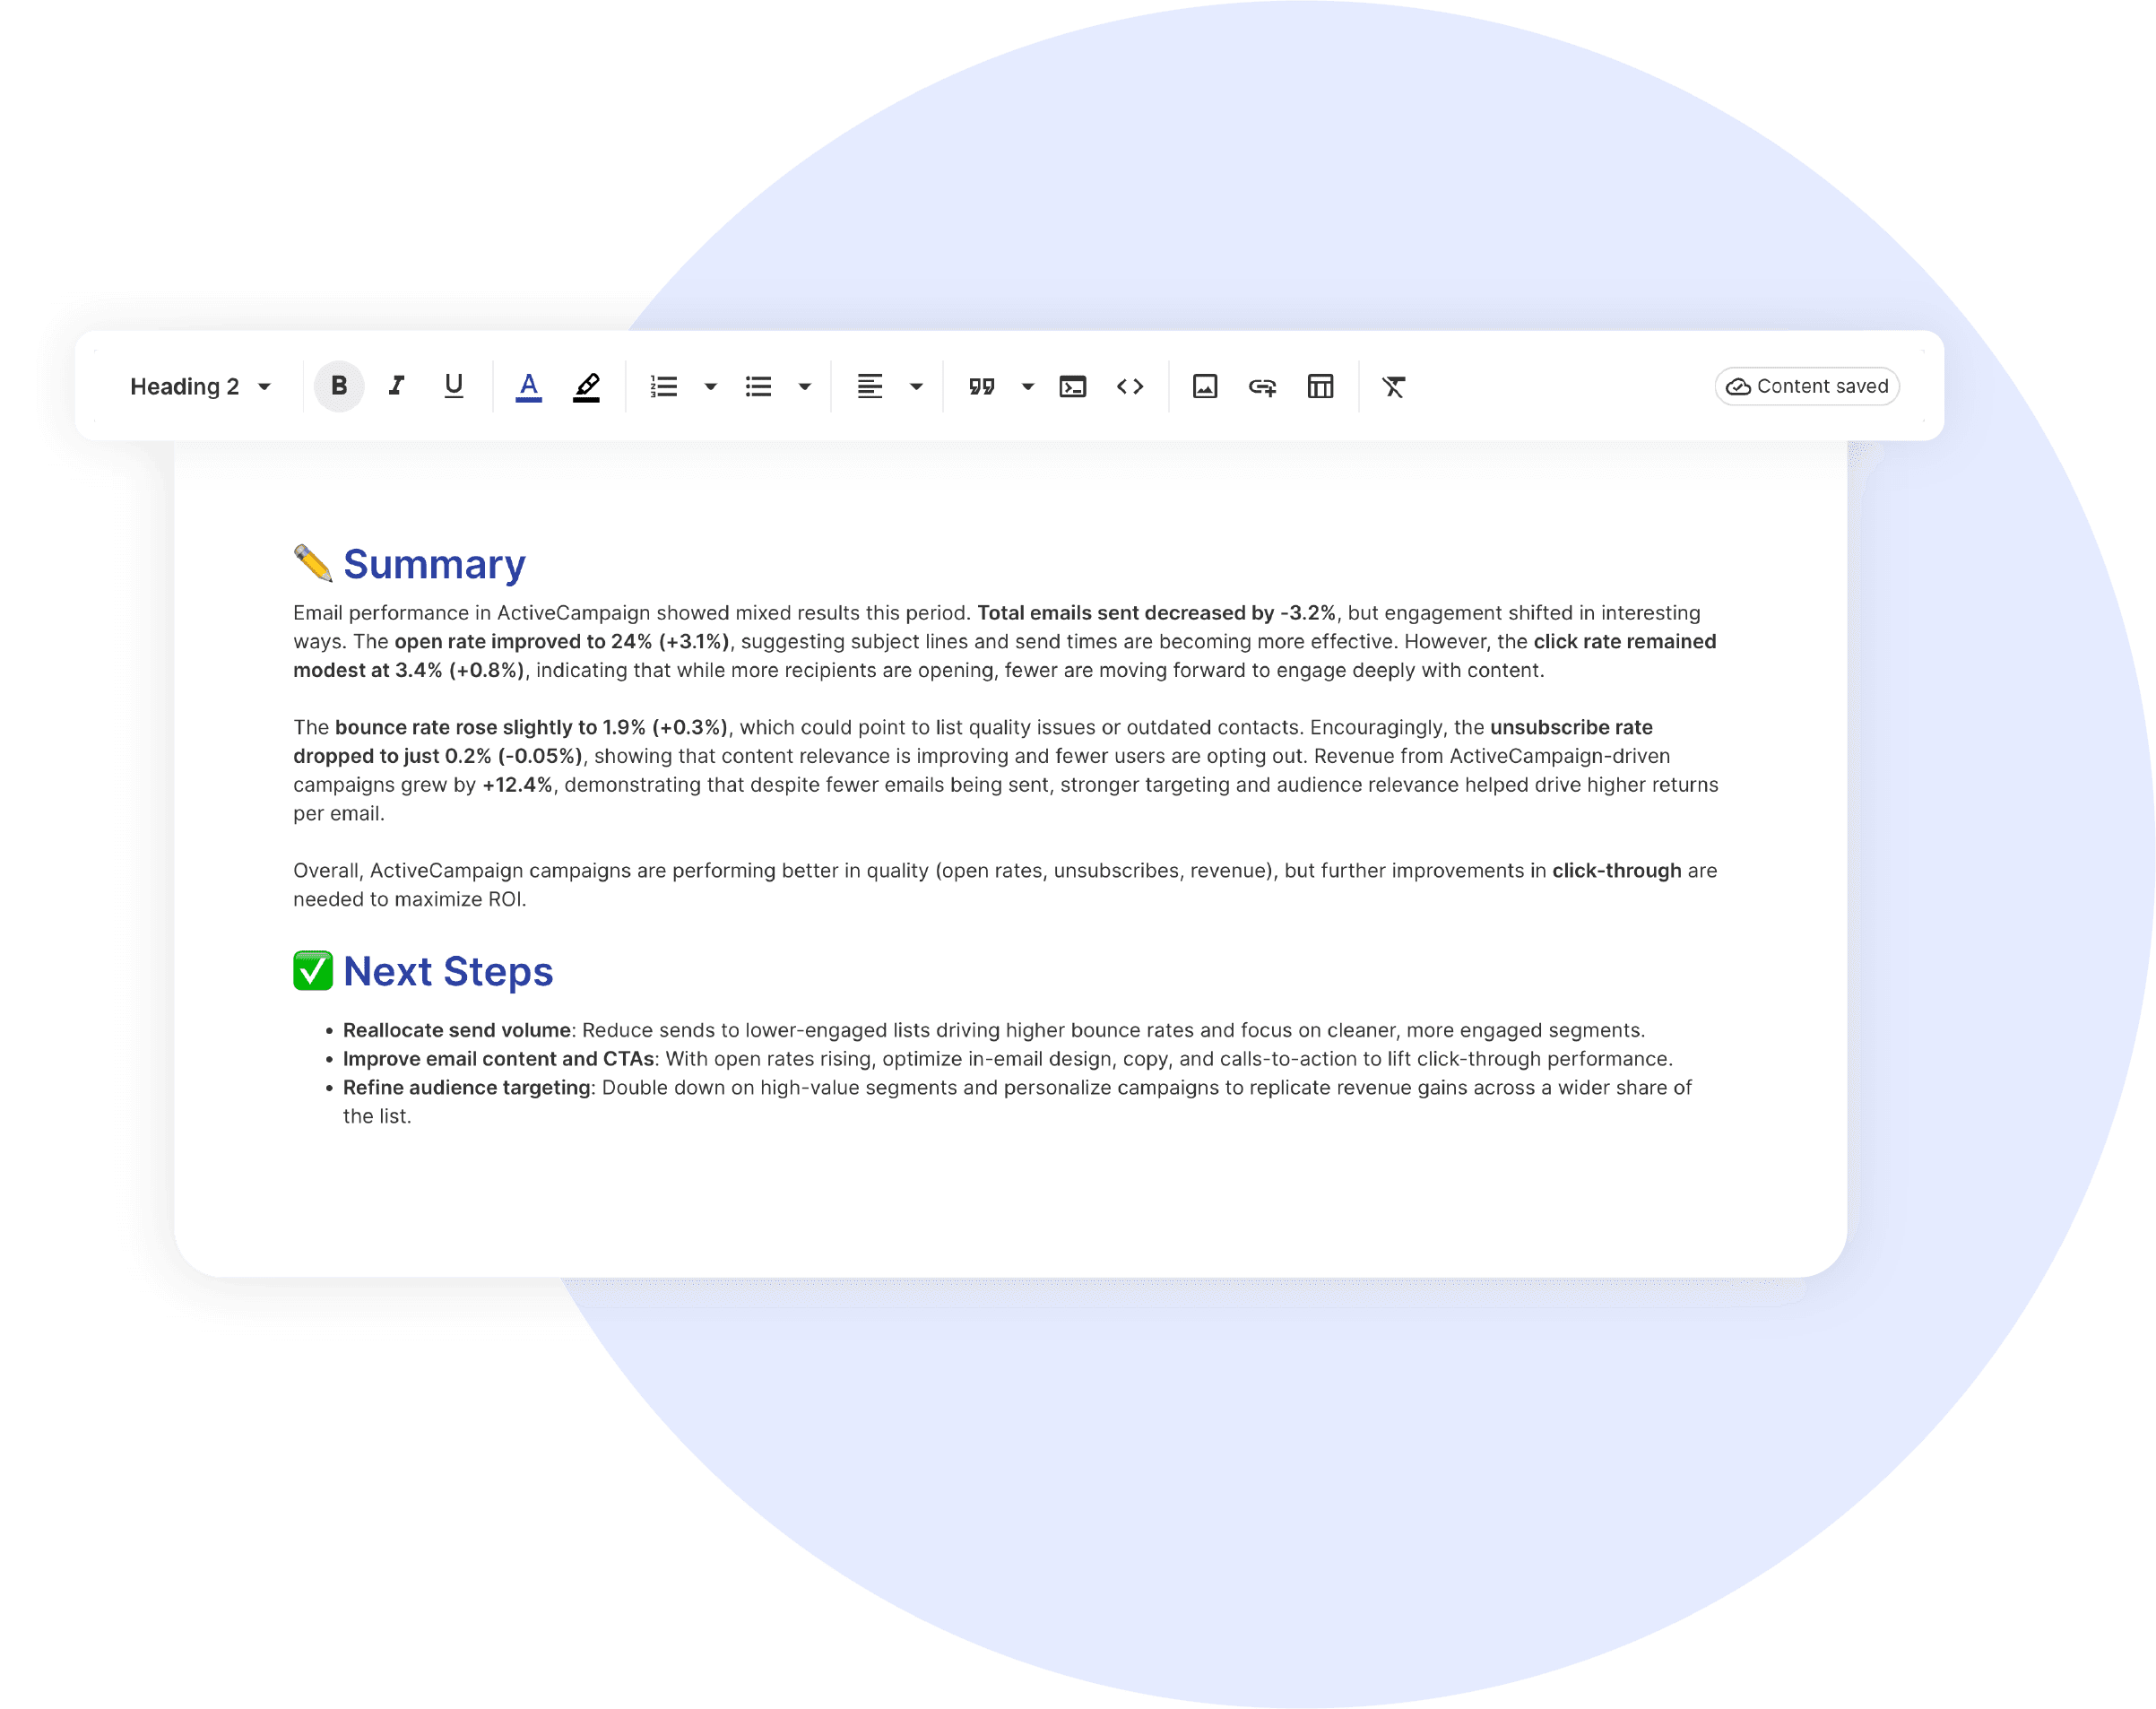
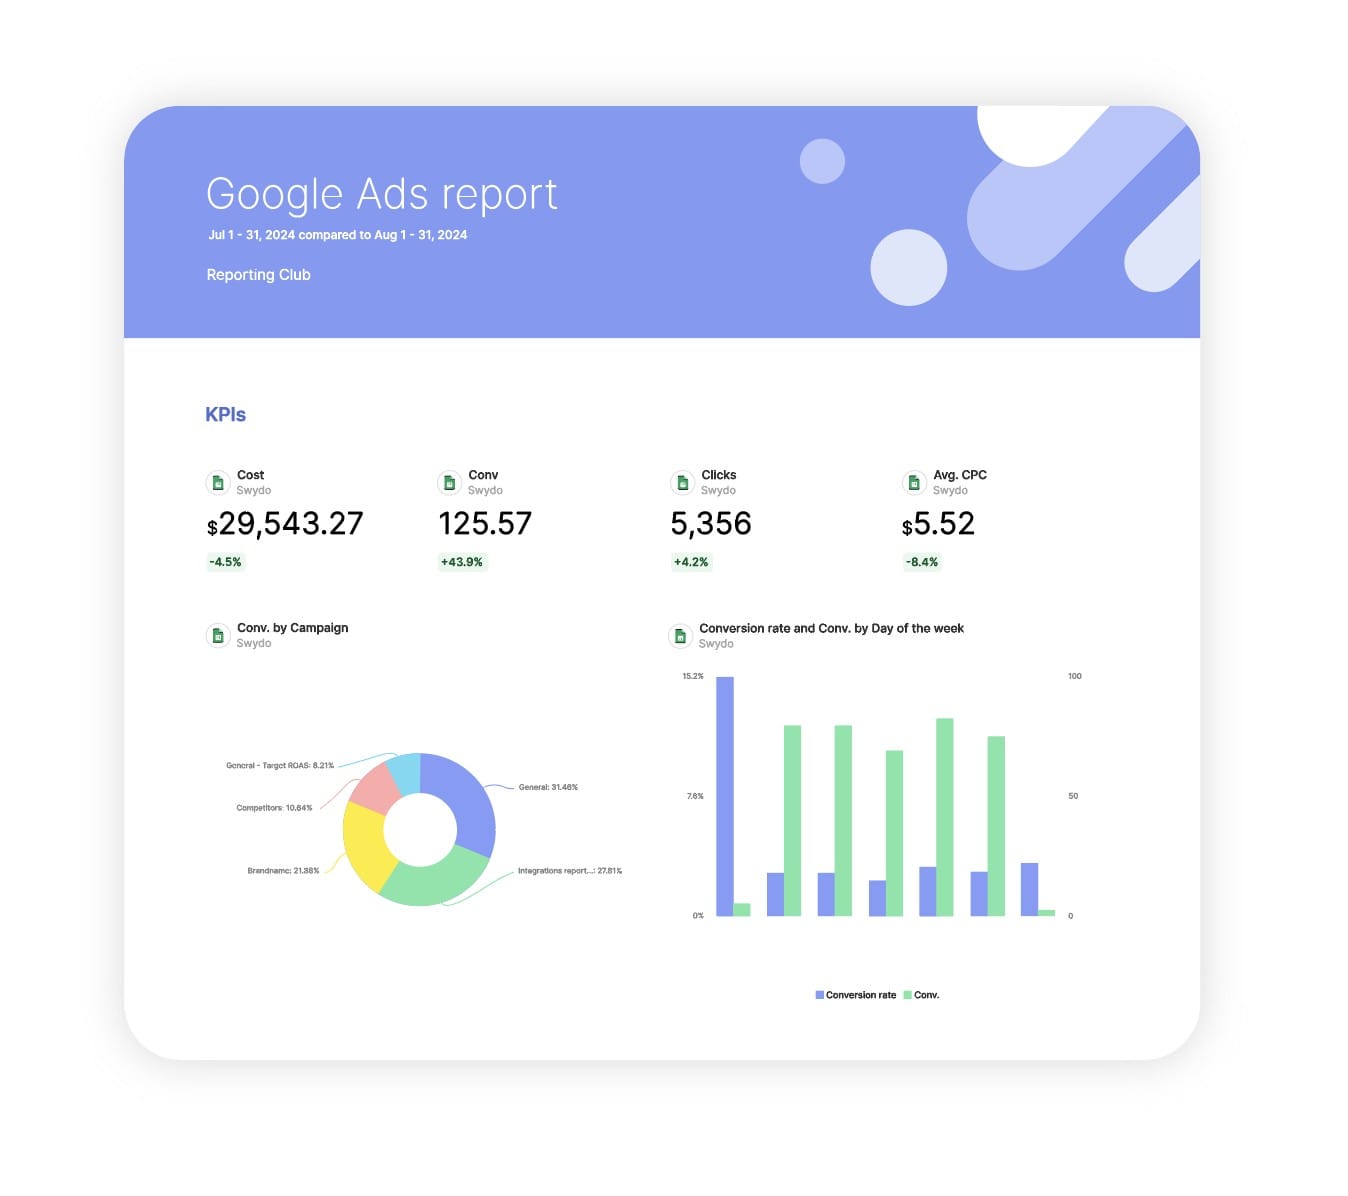
This Lead Generation Report Template pulls leads, MQLs, SQLs, calls, and closed-won revenue from every channel your client runs into one branded report your account managers can deliver in minutes — and your clients can actually understand.


What Makes Swydo’s Lead Generation Report Template Different?

Built Around The Funnel, Not The Channel
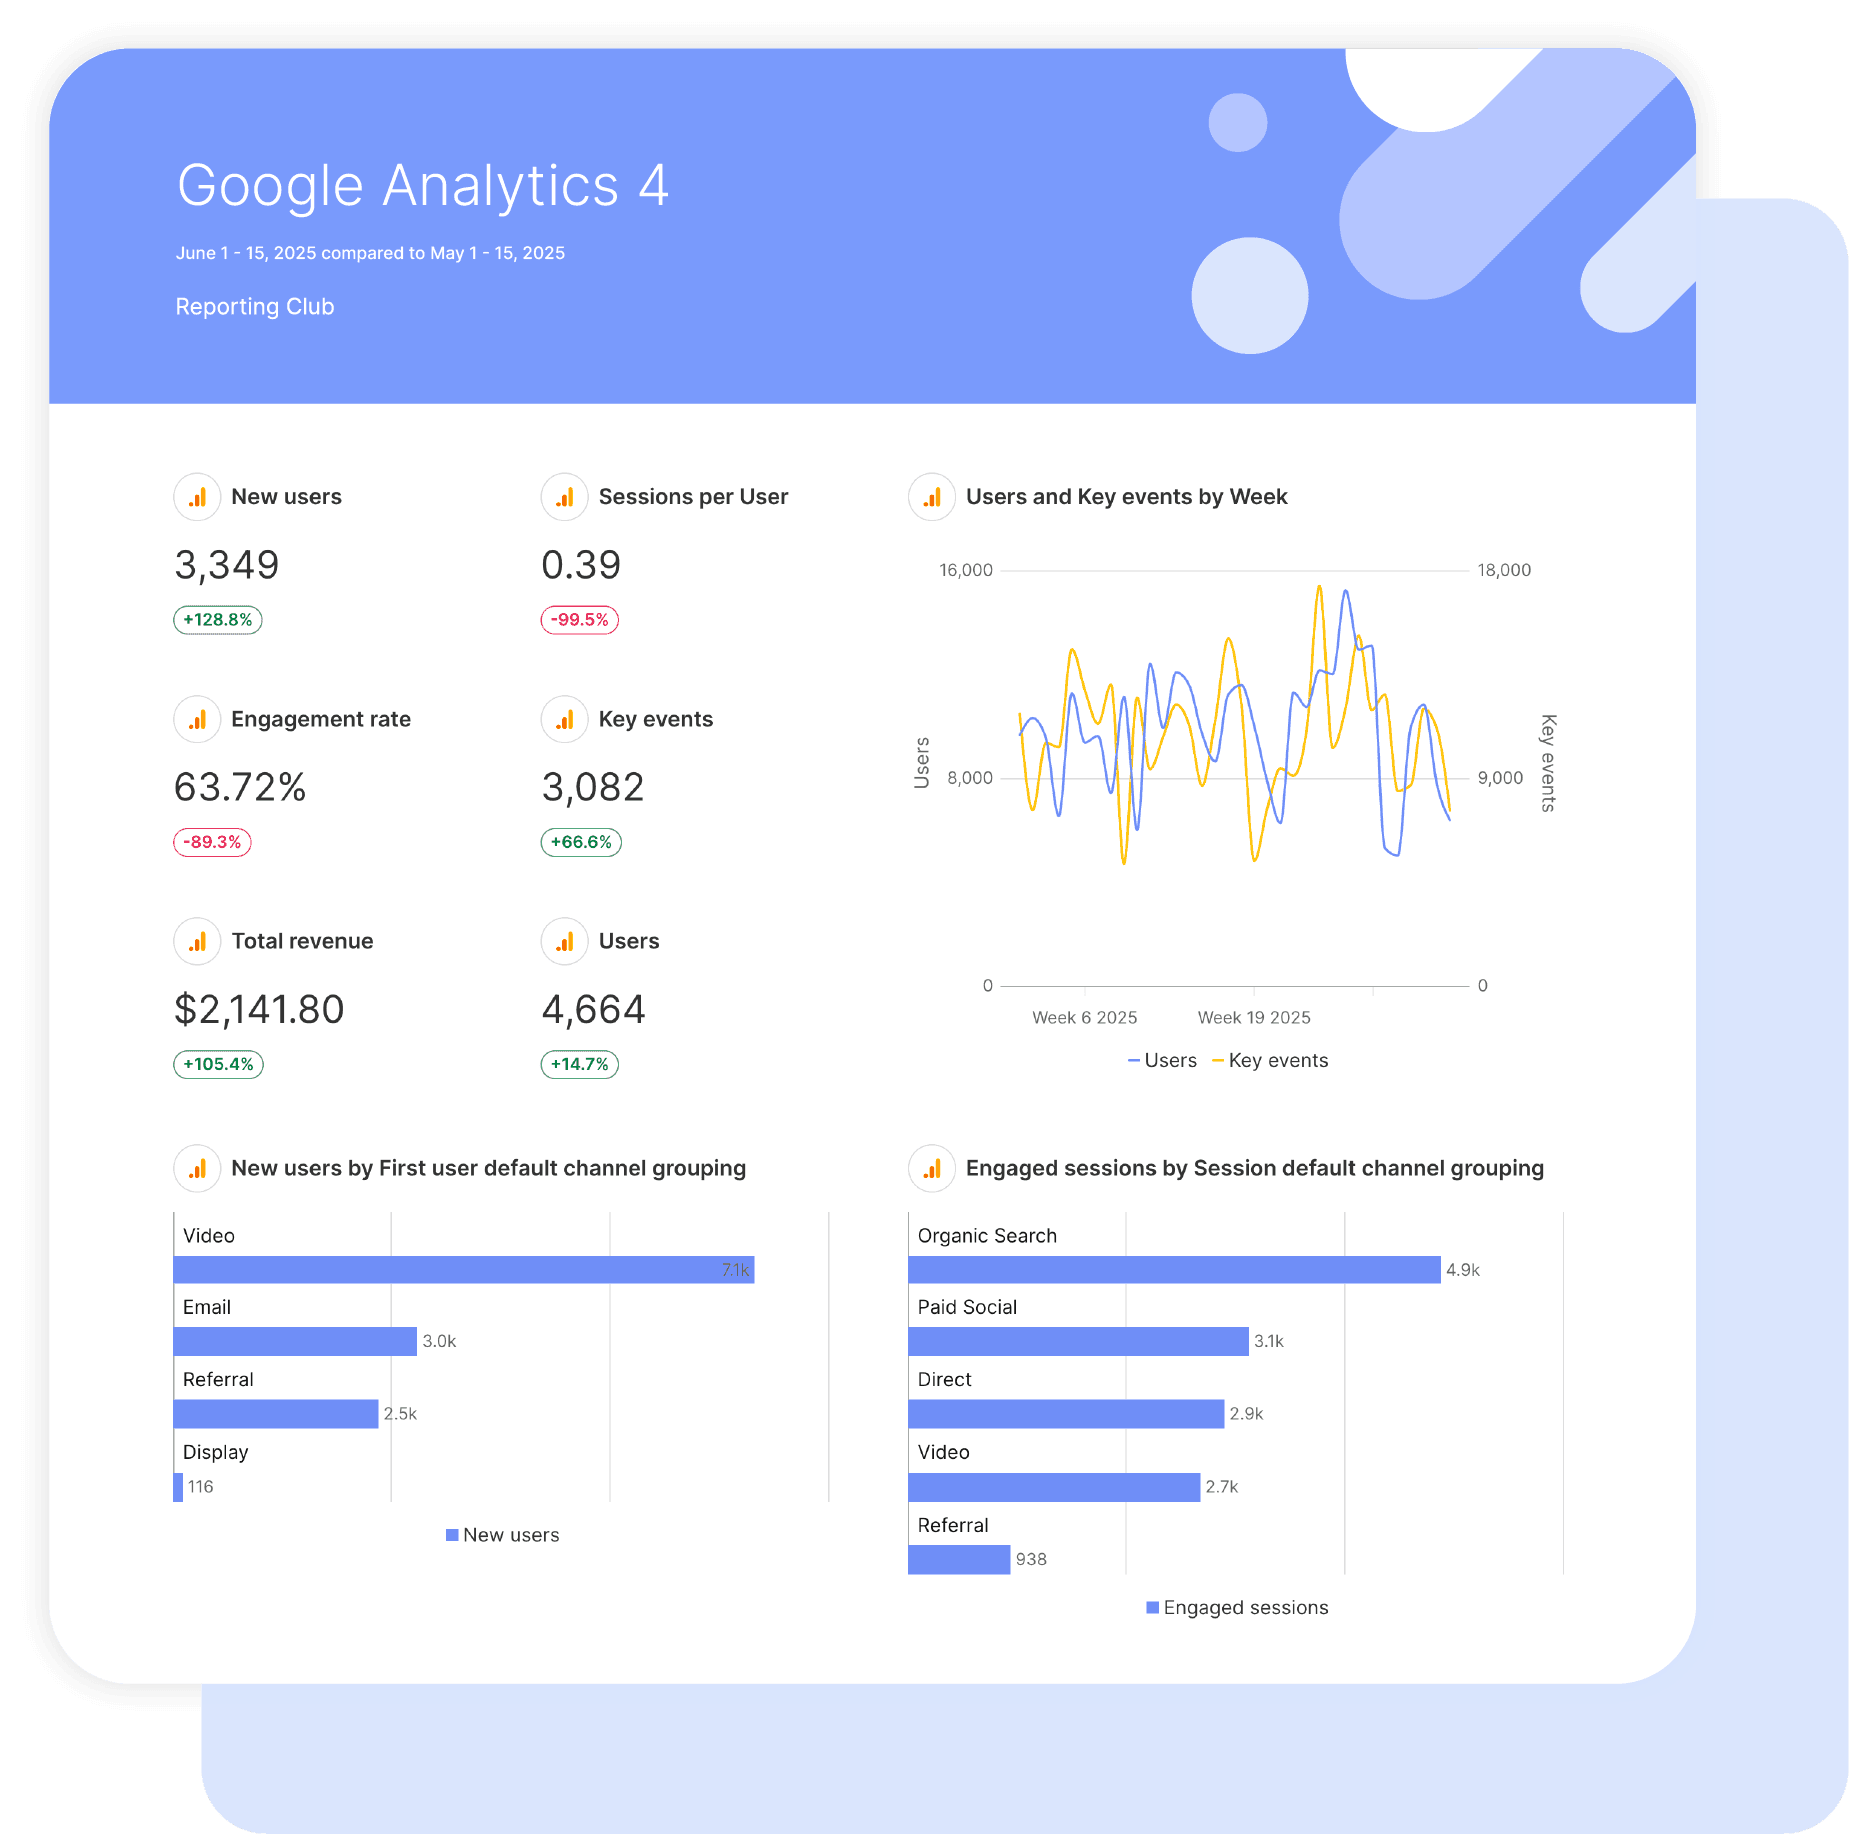
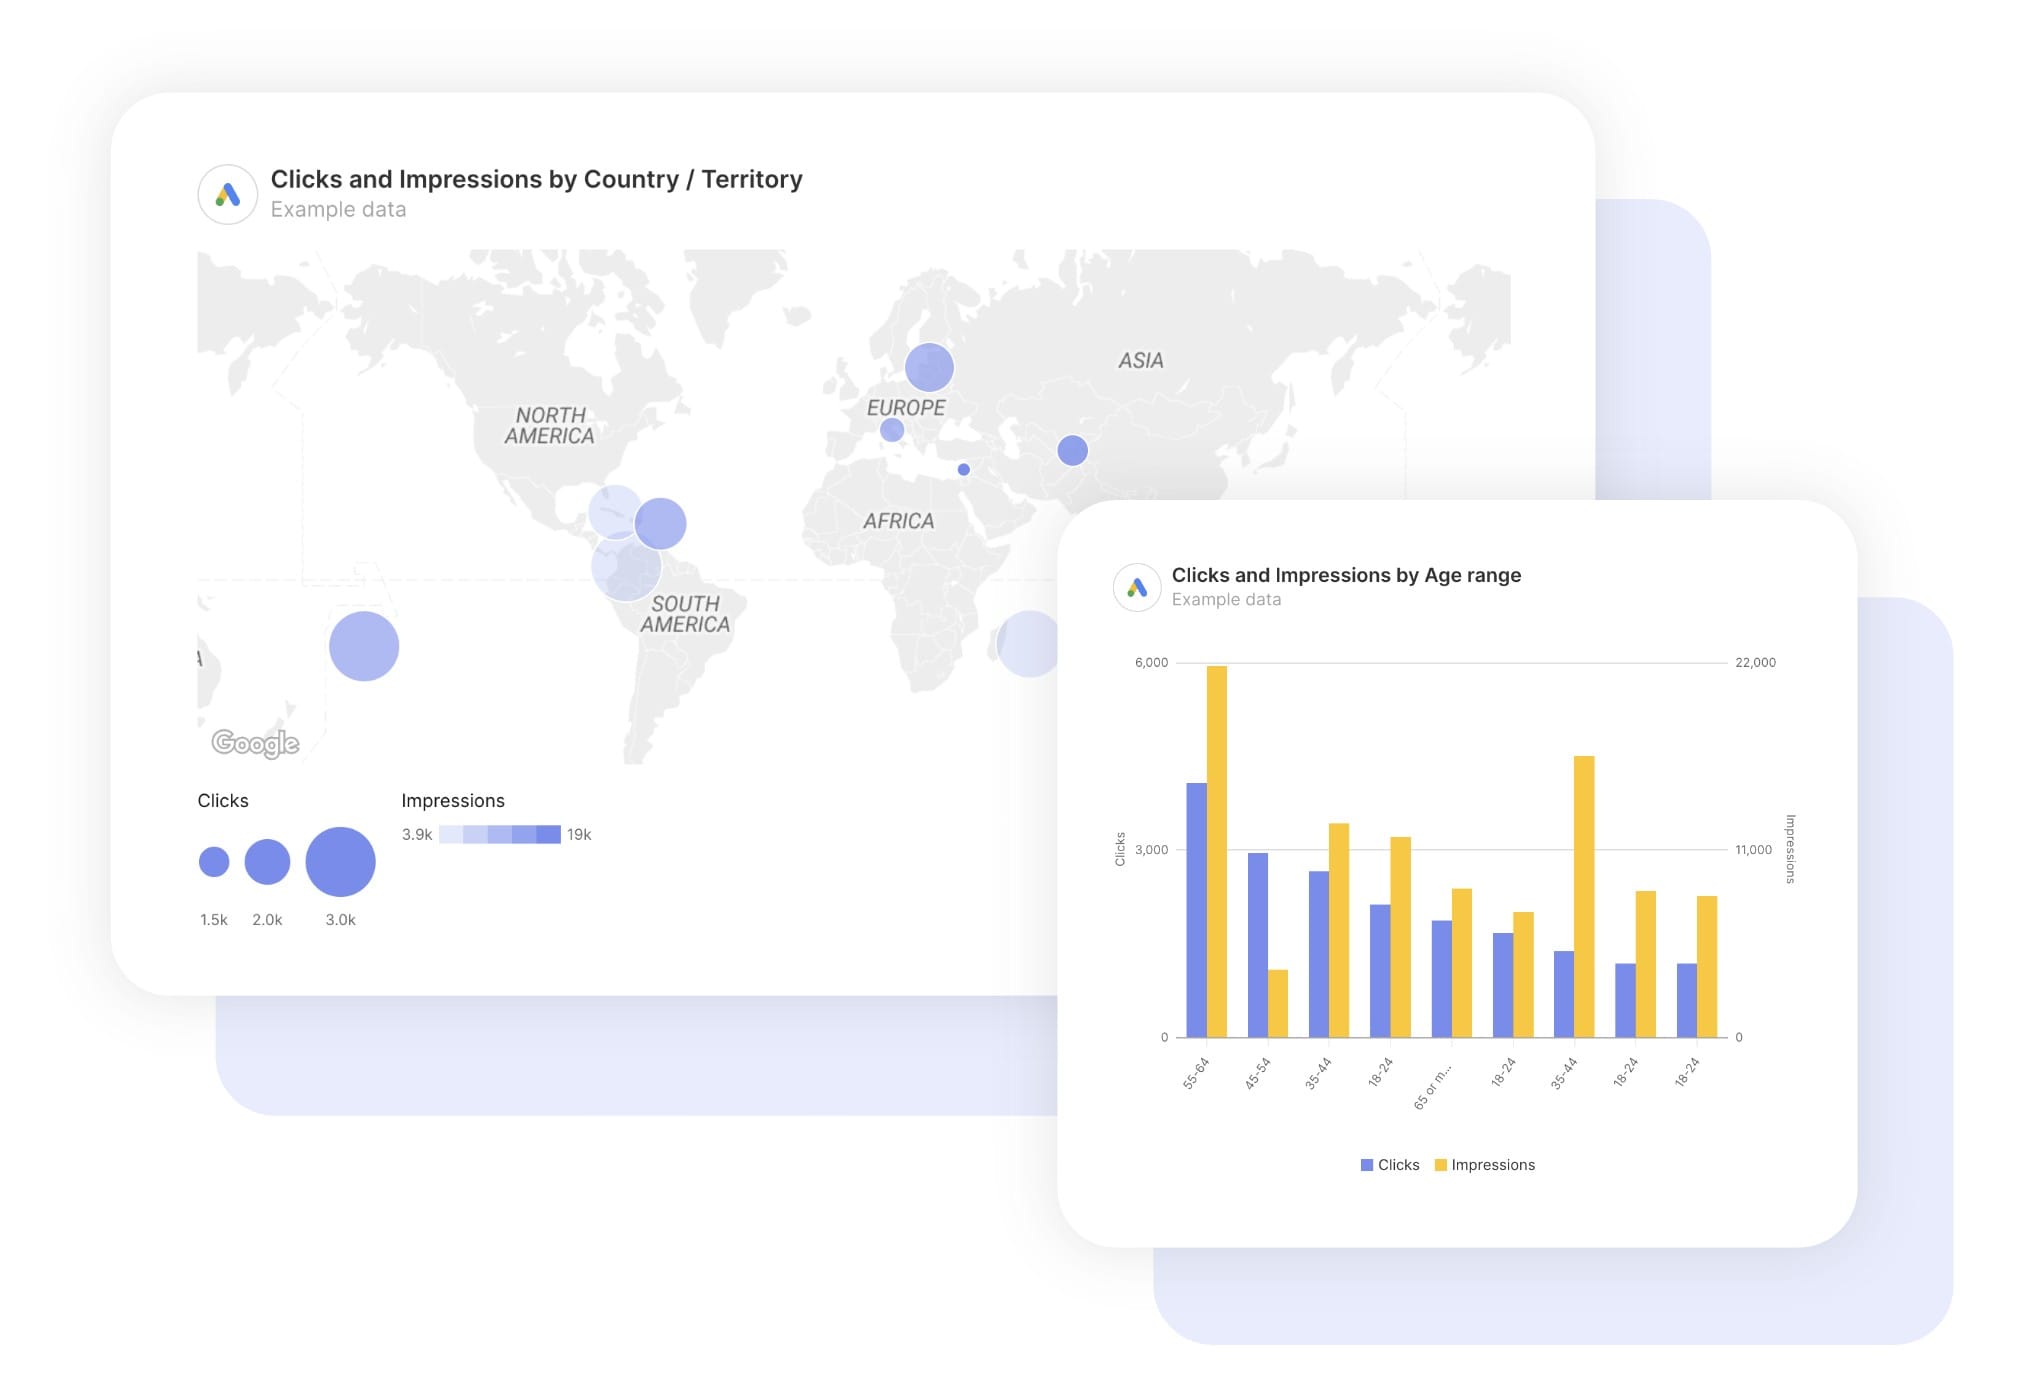
Lead volume is table stakes in 2026. This template tracks what happens after the lead form fires: which leads became MQLs, which MQLs became SQLs, and which SQLs became revenue. The conversation shifts from “here’s what we did” to “here’s what it was worth.”

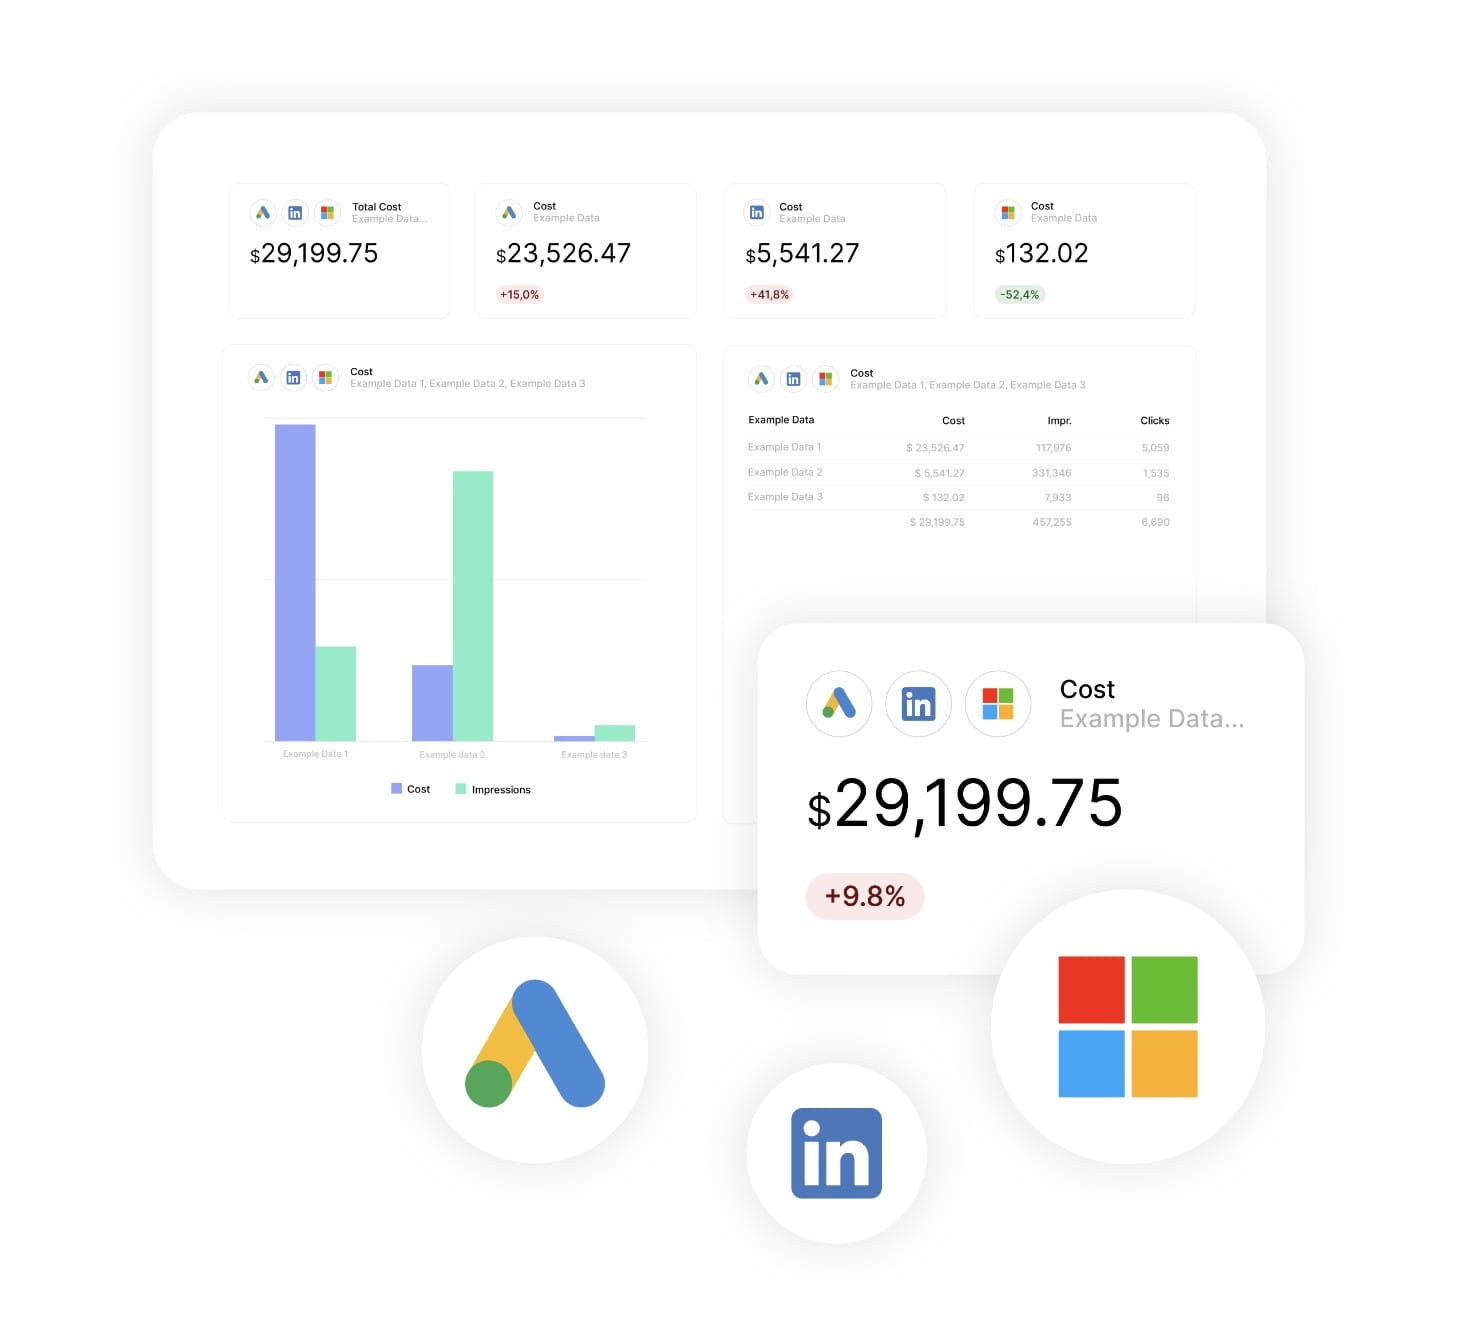
One Number For Cross-Channel CPL
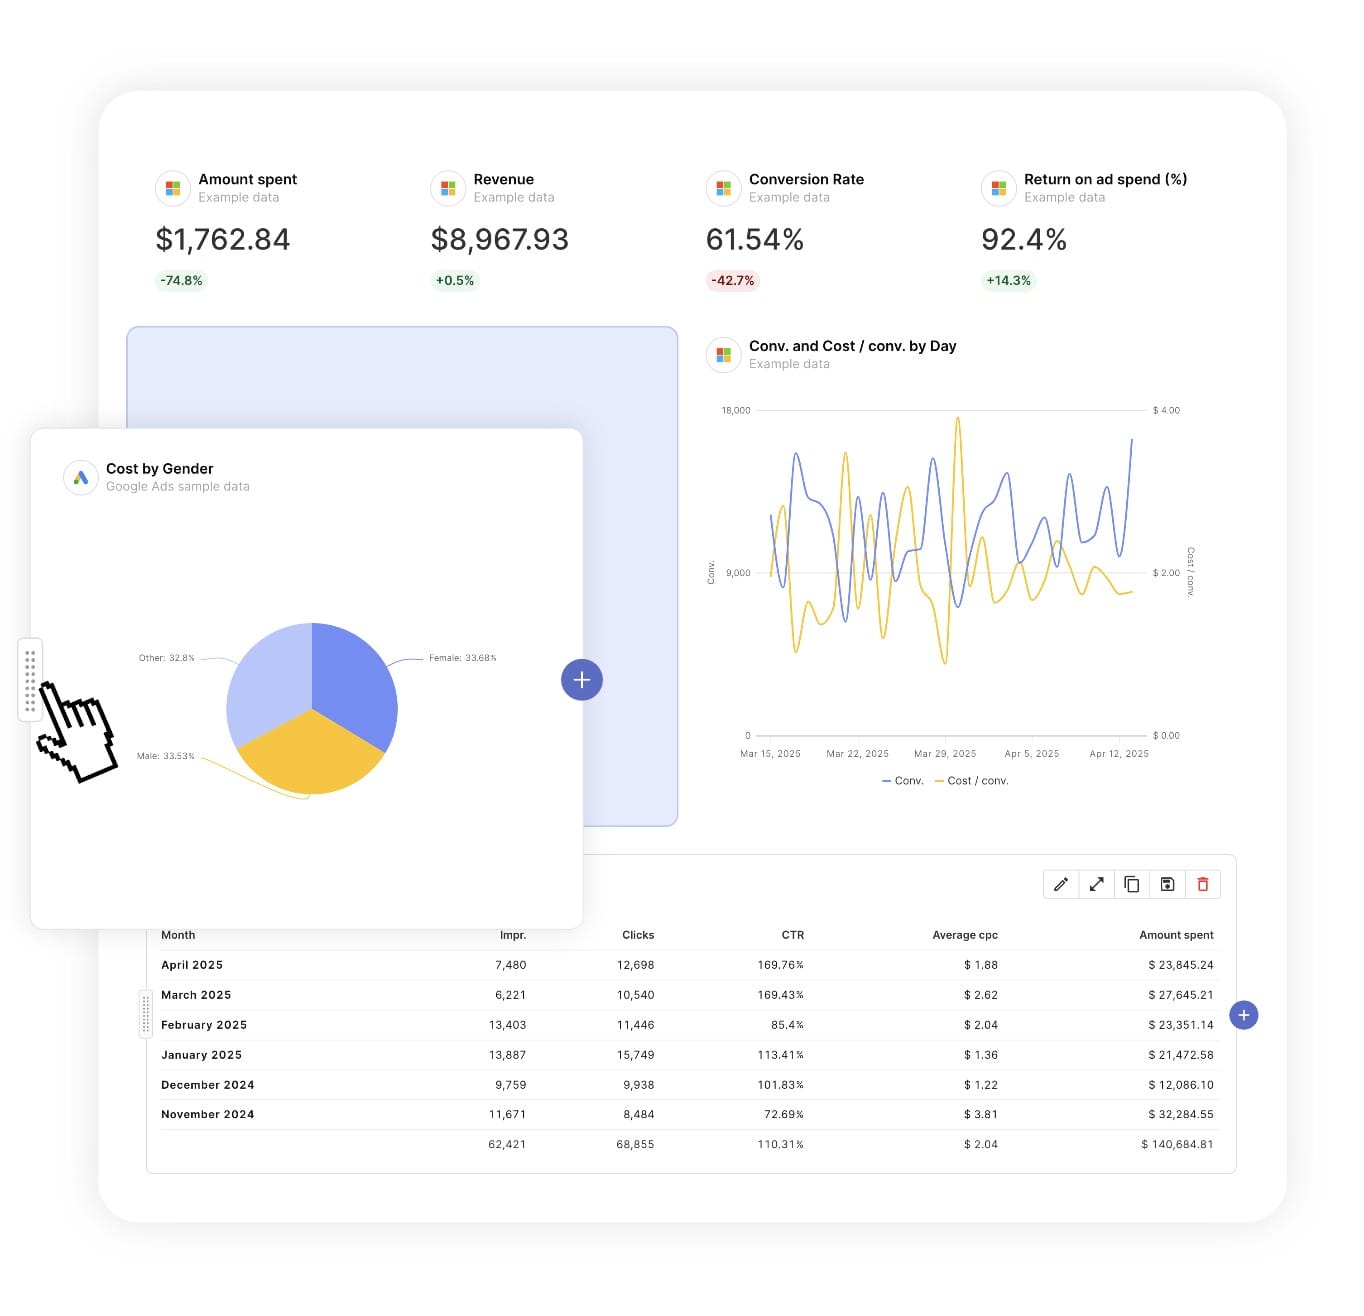
Lead generation never lives in one ad platform. With Swydo’s Combined Data Sources, you blend spend and conversions from Google Ads, Meta, LinkedIn, Microsoft, and TikTok into a single widget, so when your client asks what a lead really costs, you have one honest answer instead of five separate ones.

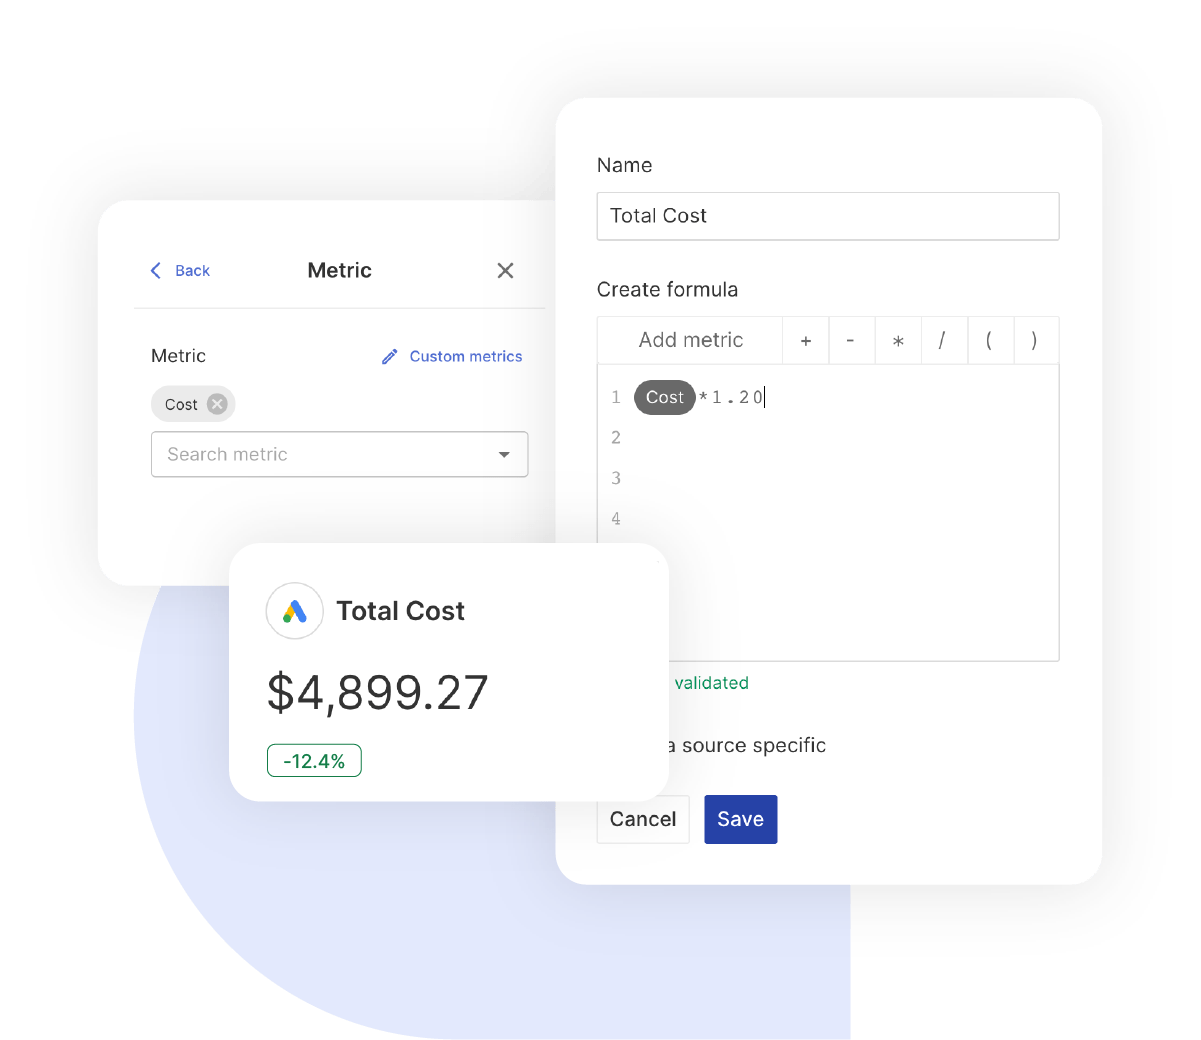
Custom Metrics That Match How Your Clients Think
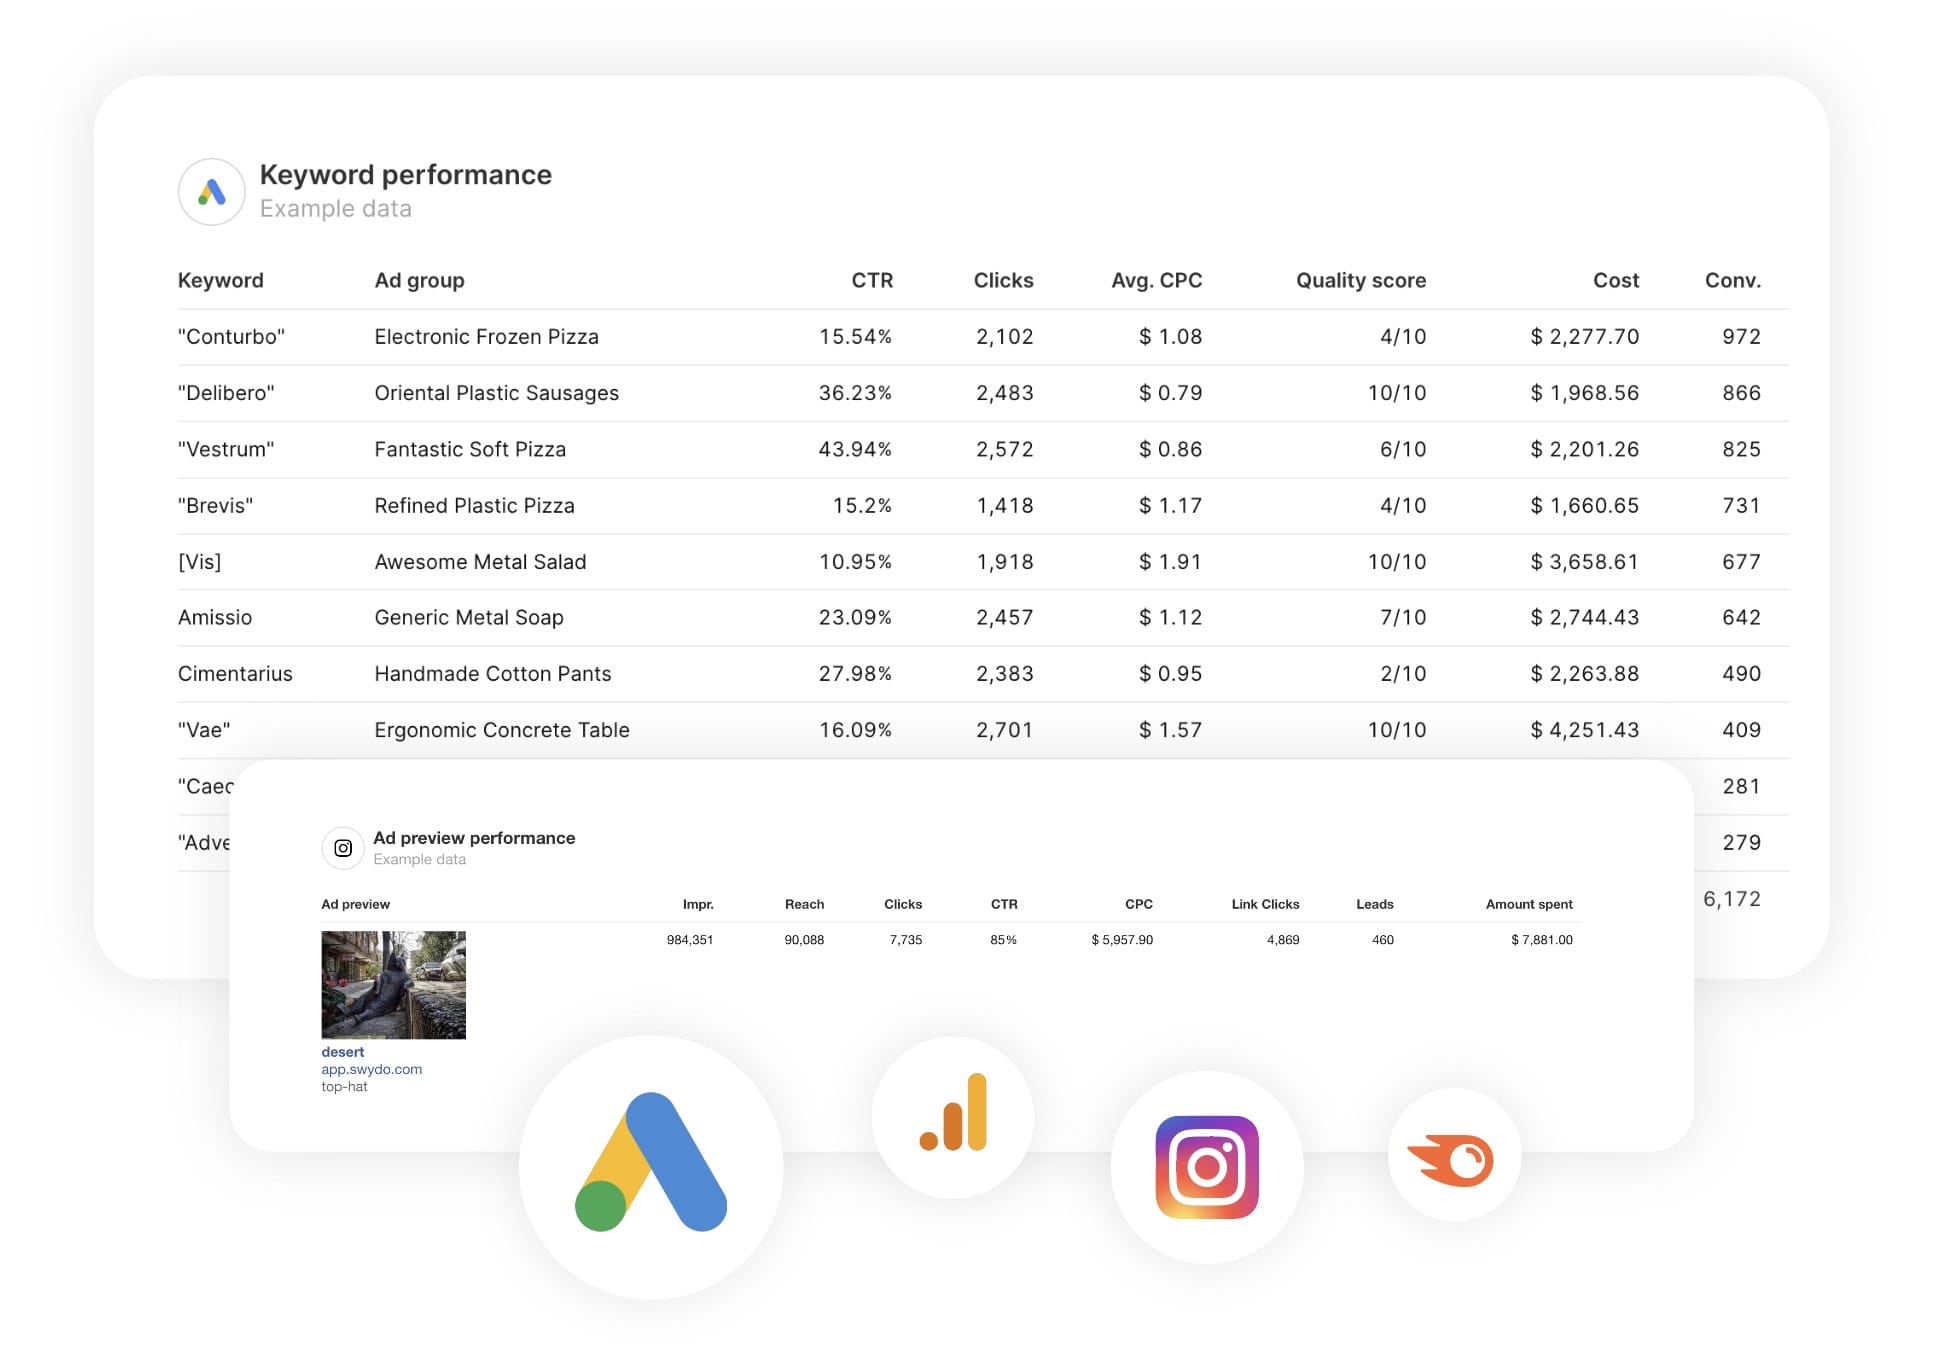
Every client measures success a little differently. Build the calculations that fit each account: cost per SQL, lead-to-customer rate, quality-adjusted CPL, pipeline velocity. Use any field from any connected source. The template adapts to the client, not the other way around.


What To Include In A Lead Generation Report

A great lead generation report tells your client three things: where the leads came from, what they were worth, and what you’re doing next month. Here’s how to structure each section so the answer to all three is obvious.

Executive Summary Your Client Reads First

What to include at the top of the report:

  • Total Leads & Blended Cost Per Lead: The headline numbers, with month-over-month and year-over-year comparisons built in.
  • MQLs & SQLs Generated: The leads sales actually accepted, not just the leads delivered.
  • Marketing-Sourced Revenue & Pipeline: Revenue already closed and pipeline value still progressing through the funnel.
  • Lead-to-Customer Rate: End-to-end funnel health summarised in a single percentage.

This is the page your client’s CEO will read. Make it the page that gets you renewed.

Core Lead Generation Performance

Foundation metrics every lead generation report should track:

  • Lead Volume By Month: Trend lines that show whether the programme is growing, flat, or heading in the wrong direction.
  • Cost Per Lead: Blended across channels using Combined Data Sources for a true cross-channel figure.
  • Visitor-to-Lead Conversion Rate: Measures whether the website and landing pages are turning traffic into leads efficiently.
  • Lead Source Attribution: Identifies which channels, campaigns, and keywords are generating results.

These metrics prove the programme is healthy before you dig into the details.

Channel Breakdown & Cross-Channel Performance

What to include for channel-level optimisation:

  • Channel-by-Channel Comparison: Lead volume, cost per lead, and conversion rate for every active platform.
  • Top Performing Campaigns: The five campaigns generating the highest volume of qualified leads, ranked by performance.
  • Underperforming Spend: Highlights campaigns or platforms that consume budget without delivering sufficient results.
  • Where to Move The Money Next Month: A clear recommendation on budget shifts, not just another chart.

Show your client exactly which channels deserve more budget and which ones should be scaled back or switched off.

Lead Quality & The MQL-to-SQL Handoff

Lead quality metrics that matter to clients with sales teams:

  • MQL & SQL Volume: Pulled directly from HubSpot, or from Salesforce and Pipedrive through Google Sheets integrations.
  • MQL-to-SQL Conversion Rate: The clearest measure of whether marketing is sending sales the right prospects.
  • Lead Quality By Source: Shows which channels deliver leads that sales accepts and which channels consistently underperform.
  • Time-to-Qualification: Tracks how quickly leads move from form submission to sales-ready status.

Replace the awkward “we delivered the leads, sales didn’t close them” conversation with a report that shows exactly where the funnel is leaking.

Calls & Phone Lead Performance

Call tracking metrics that complete the picture:

  • Total & Unique Inbound Calls: From CallRail or CallTrackingMetrics, attributed to the campaign that generated the call.
  • Call Source Attribution: Identifies which keyword, ad, or campaign earned the phone ring.
  • Qualified Call Rate: Shows how many calls turned into genuine sales opportunities.
  • Cost Per Qualified Call: Custom metric blending advertising spend with call outcomes.

Most service-business clients still close deals on the phone. Reports that ignore call data leave half the wins invisible.

Pipeline & Revenue Attribution

The bottom-of-funnel metrics that earn the next 12-month contract:

  • Marketing-Sourced Revenue: Closed-won deals where your marketing efforts were the first touchpoint.
  • Marketing-Influenced Revenue: Closed-won deals that your campaigns helped move forward through the sales process.
  • Pipeline Velocity: Measures how quickly opportunities progress from open to closed-won.
  • Return on Ad Spend: Revenue divided by spend, blended across every active marketing channel.

This is the section that turns a marketing report into a business report.

Custom Lead Generation Metrics & Calculations

Calculations you can build inside the template:

  • Cost Per SQL: Marketing Spend ÷ SQLs, the metric sales leaders care about most.
  • Lead-to-Customer Rate: (New Customers ÷ Total Leads) × 100 to measure full-funnel efficiency.
  • Quality-Adjusted CPL: Cost per lead weighted by how often each channel produces accepted leads.
  • Blended ROAS: Revenue ÷ Spend across every channel in a single metric.

Combine any metric from any connected source. Build the calculations each client cares about, then build them once.

Recommendations & What’s Next

The section every report needs and most reports skip:

  • Where Budget Is Moving Next Month: Specific budget reallocation decisions based on the performance data above.
  • Funnel Stage You’re Fixing: Identifies whether the primary bottleneck sits in the visitor-to-lead, MQL-to-SQL, or SQL-to-customer stage.
  • Targeting & Creative Tests You’re Running: Explains what is being tested and what the team expects to learn, in plain language.
  • What Your Client Needs To Decide: A short list of actions, approvals, or decisions needed to keep momentum moving forward.

Most agencies lose accounts because clients cannot see what they are paying for. A report that ends with a clear point of view is the one that gets read, forwarded, and renewed.

CUSTOMIZATION

Customize Your Lead Generation Report

FiltersLeverage a variety of filters to show more specific data points to quickly identify issues and take swift action.

SchedulingAutomate and share your dashboards and reports on a schedule that best meets your needs.

White labelReflect your brand by incorporating your logo and brand colors into your reports. You can also use your domain to share and send your reports.

GoalsSet and track goals to gain insight into performance, trends and progress toward your goals.

Custom MetricCombine two metrics from the same data source to calculate an entirely new custom metric.

Multi-language reportsCreate reports for your clients in 14 available languages through our automatic and editable translation feature.

Report DesignResizable widgets allow you to adjust the presentation of KPIs, charts, tables, text, and images to focus clients on key data and insights.

Text and ImagesProvide context to clients or stakeholders through descriptive text widgets. Incorporate images, such as ad assets, to improve client communication and understanding.

Flexible Date RangesEasily compare data across different time periods. Fully control the date range of your overall reports or specific KPIs, charts, and tables to highlight trends.

See all features
Lead Generation Report Templates

Choose a template, connect your ad accounts, and deliver professional marketing reports in minutes.

Connect With Your Favorite Data Sources

Easily Connect & Integrate Data in a Single Report

FAQ

Frequently Asked Questions

  • What is a Lead Generation report template?

    A Lead Generation report template is a pre-built report that automatically pulls lead, pipeline, and revenue data from your marketing and CRM platforms. It showcases key metrics such as total leads, cost per lead, MQLs, SQLs, pipeline value, and lead-to-customer performance… presented in a clear, professional layout suited for executive reviews and client retention meetings.

  • How long does it take to set up a Lead Generation report?

    Setup takes 10 minutes: choose a template, connect ad accounts, and customize with your branding for a professional report.

  • Can I white-label Lead Generation reports with my agency's branding?

    Yes, add your logo, colors, and host reports on your domain (e.g., reports.youragency.com) for a seamless, professional client experience.

  • Which marketing platforms and channels are supported?

    Swydo integrates with 35+ platforms, including LinkedIn Ads, Facebook Ads, and Google Ads allowing you to build consistent, multi-platform reports with real-time performance insights.

  • What's the cost after the free trial?

    Plans start at $69/month for 10 data sources, with no per-client fees. Additional sources cost $2–$4.50 each. Learn more.

Client testimonials

Discover Why Over 2,500 Agencies Trust Swydo


View all customer stories

Create Your Free Lead Generation Report in Minutes

Free for 14 days, no credit card required, cancel at any time

Request a demo ▶ Get started