Why Your Agency Needs A LinkedIn Ads Report Template
As a marketer, you want to drive results, not format spreadsheets. Save hours tracking LinkedIn campaign performance with automated, branded reports that showcase professional platform expertise.
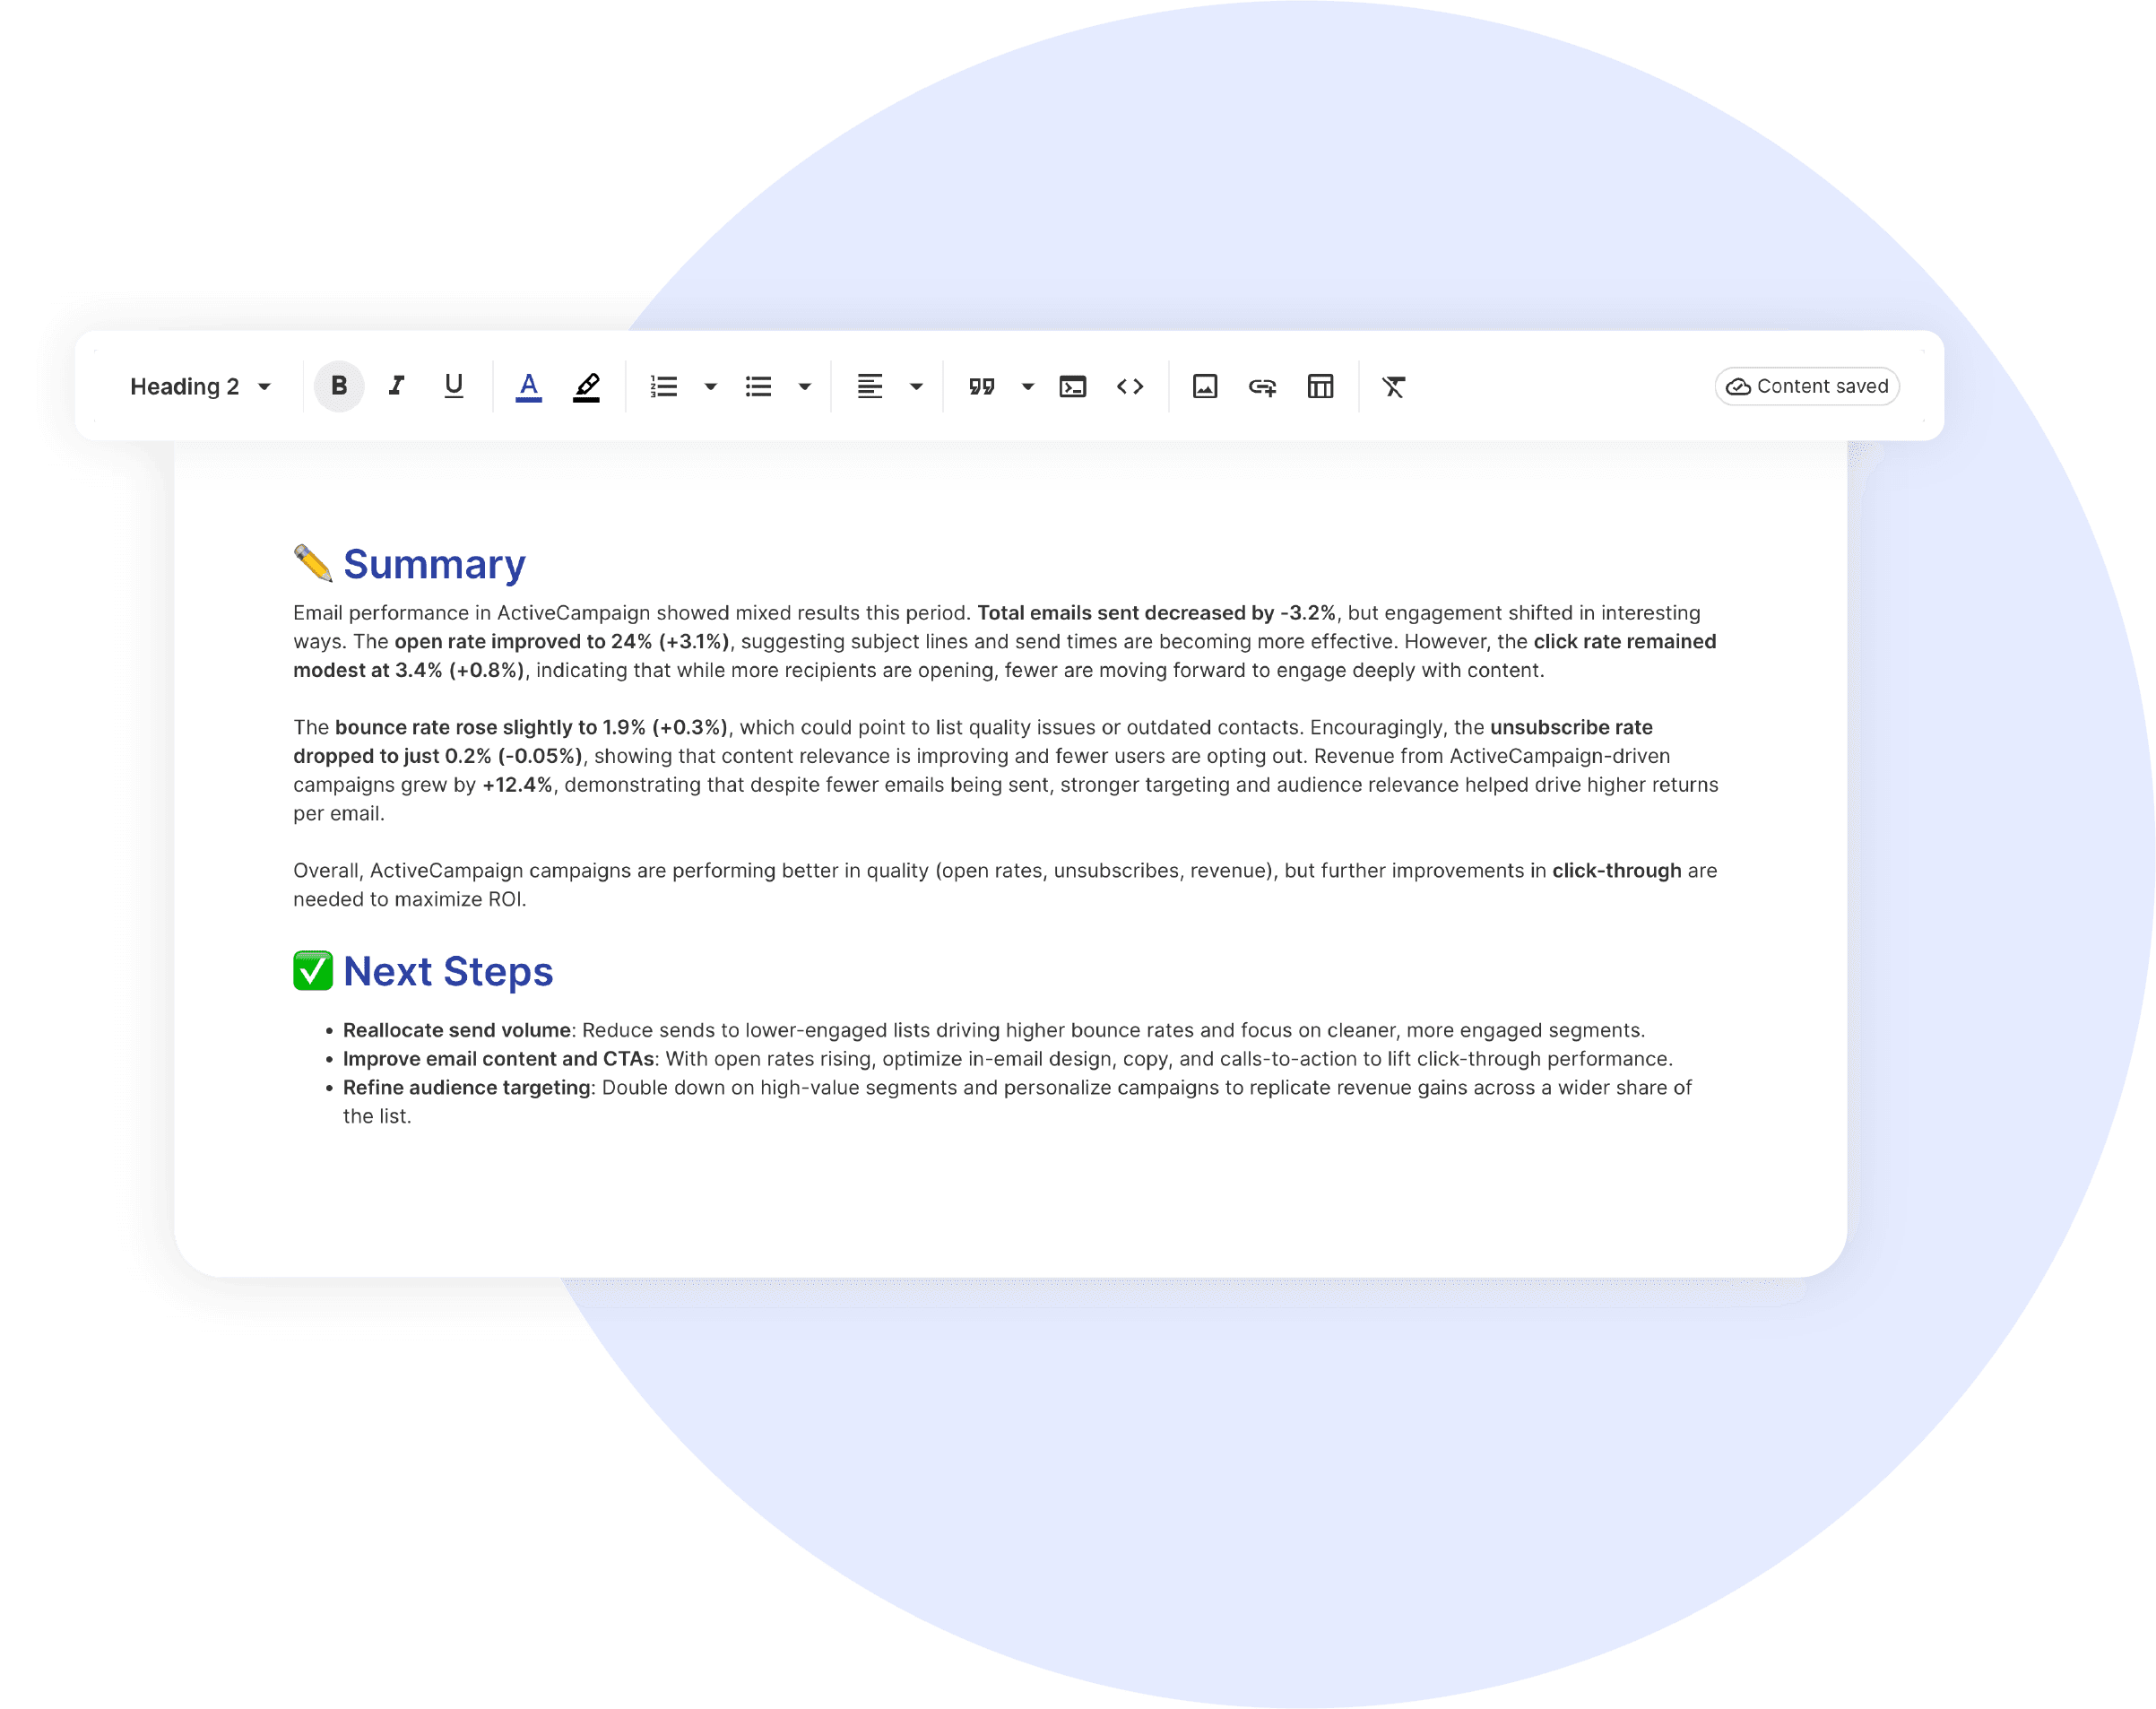
Every minute spent wrestling with LinkedIn data is a minute stolen from strategy. A good LinkedIn template transforms scattered professional metrics into stories clients actually understand.
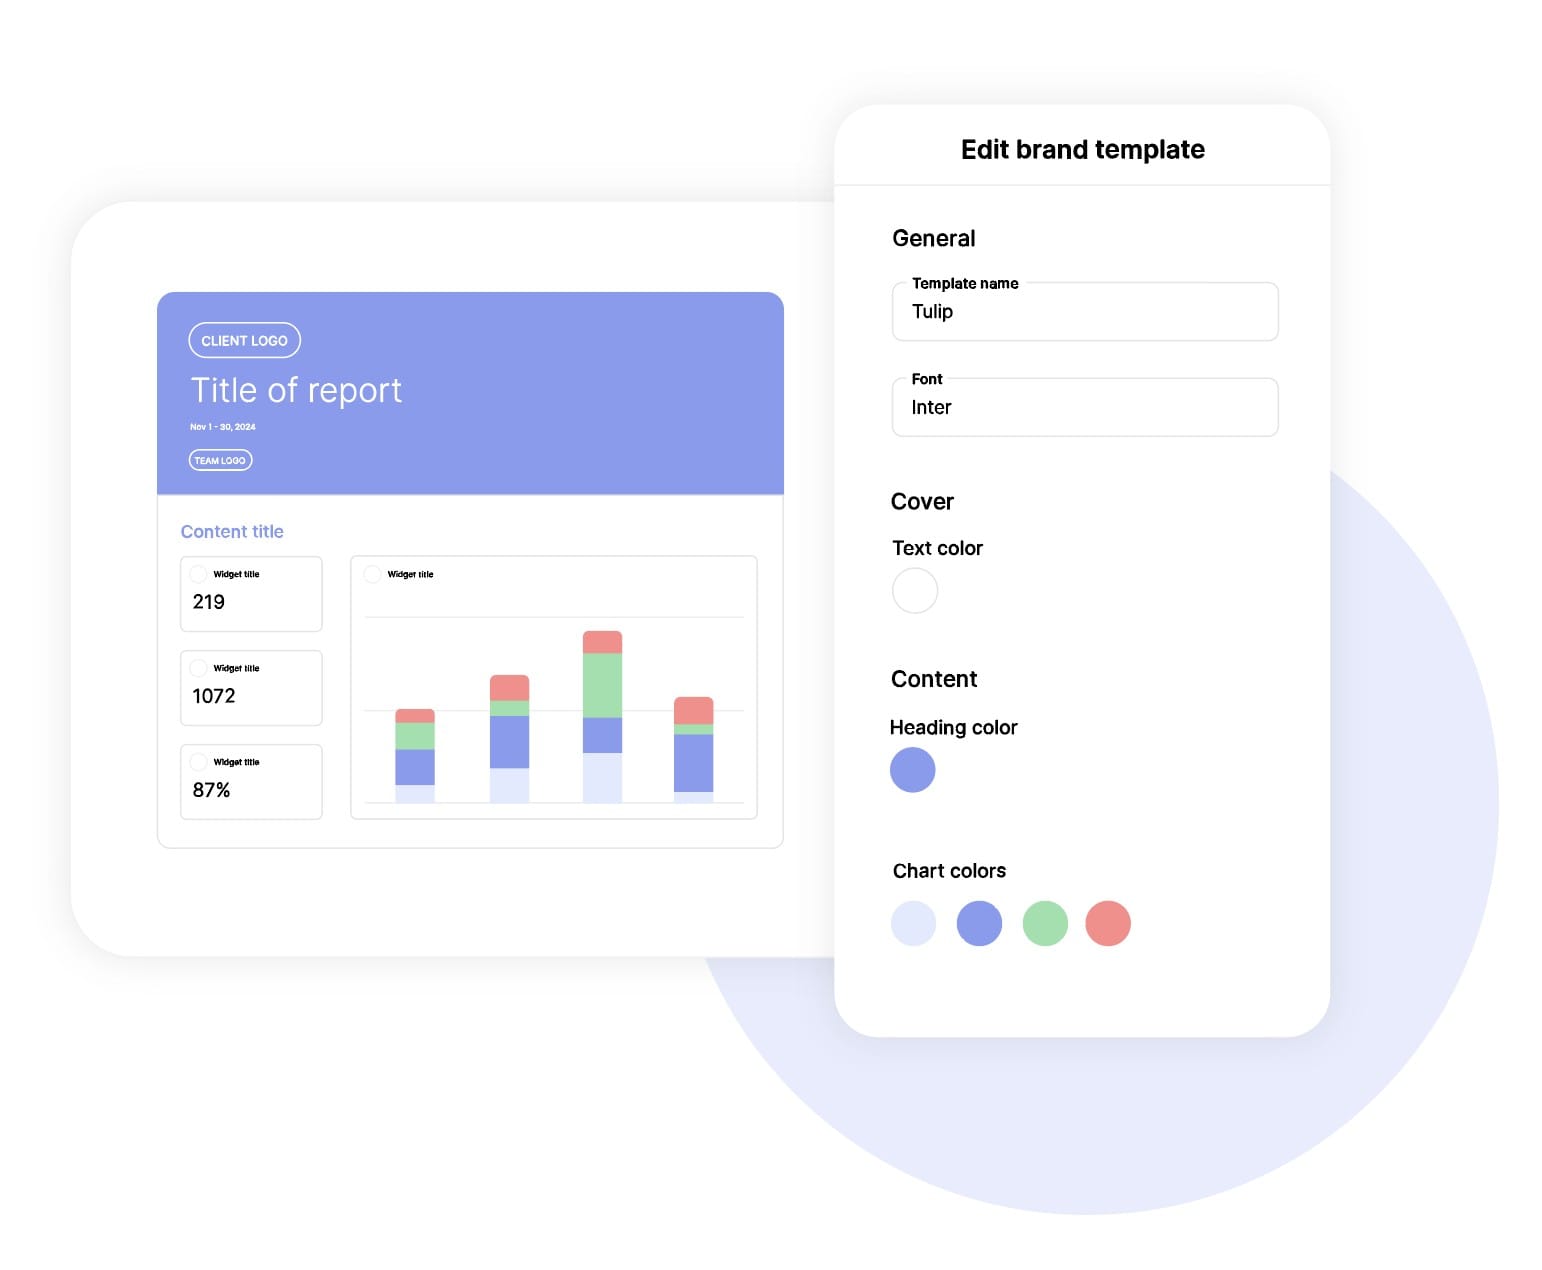
No more late nights before presentations, no more explaining complex targeting from scratch, just clear insights that showcase your LinkedIn expertise and justify your premium fees. This white-label LinkedIn Ads report template transforms chaotic campaign data into clear, compelling client presentations in minutes, not hours.
What Makes Swydo’s LinkedIn Ads Report Template Different?
LinkedIn-Native Intelligence
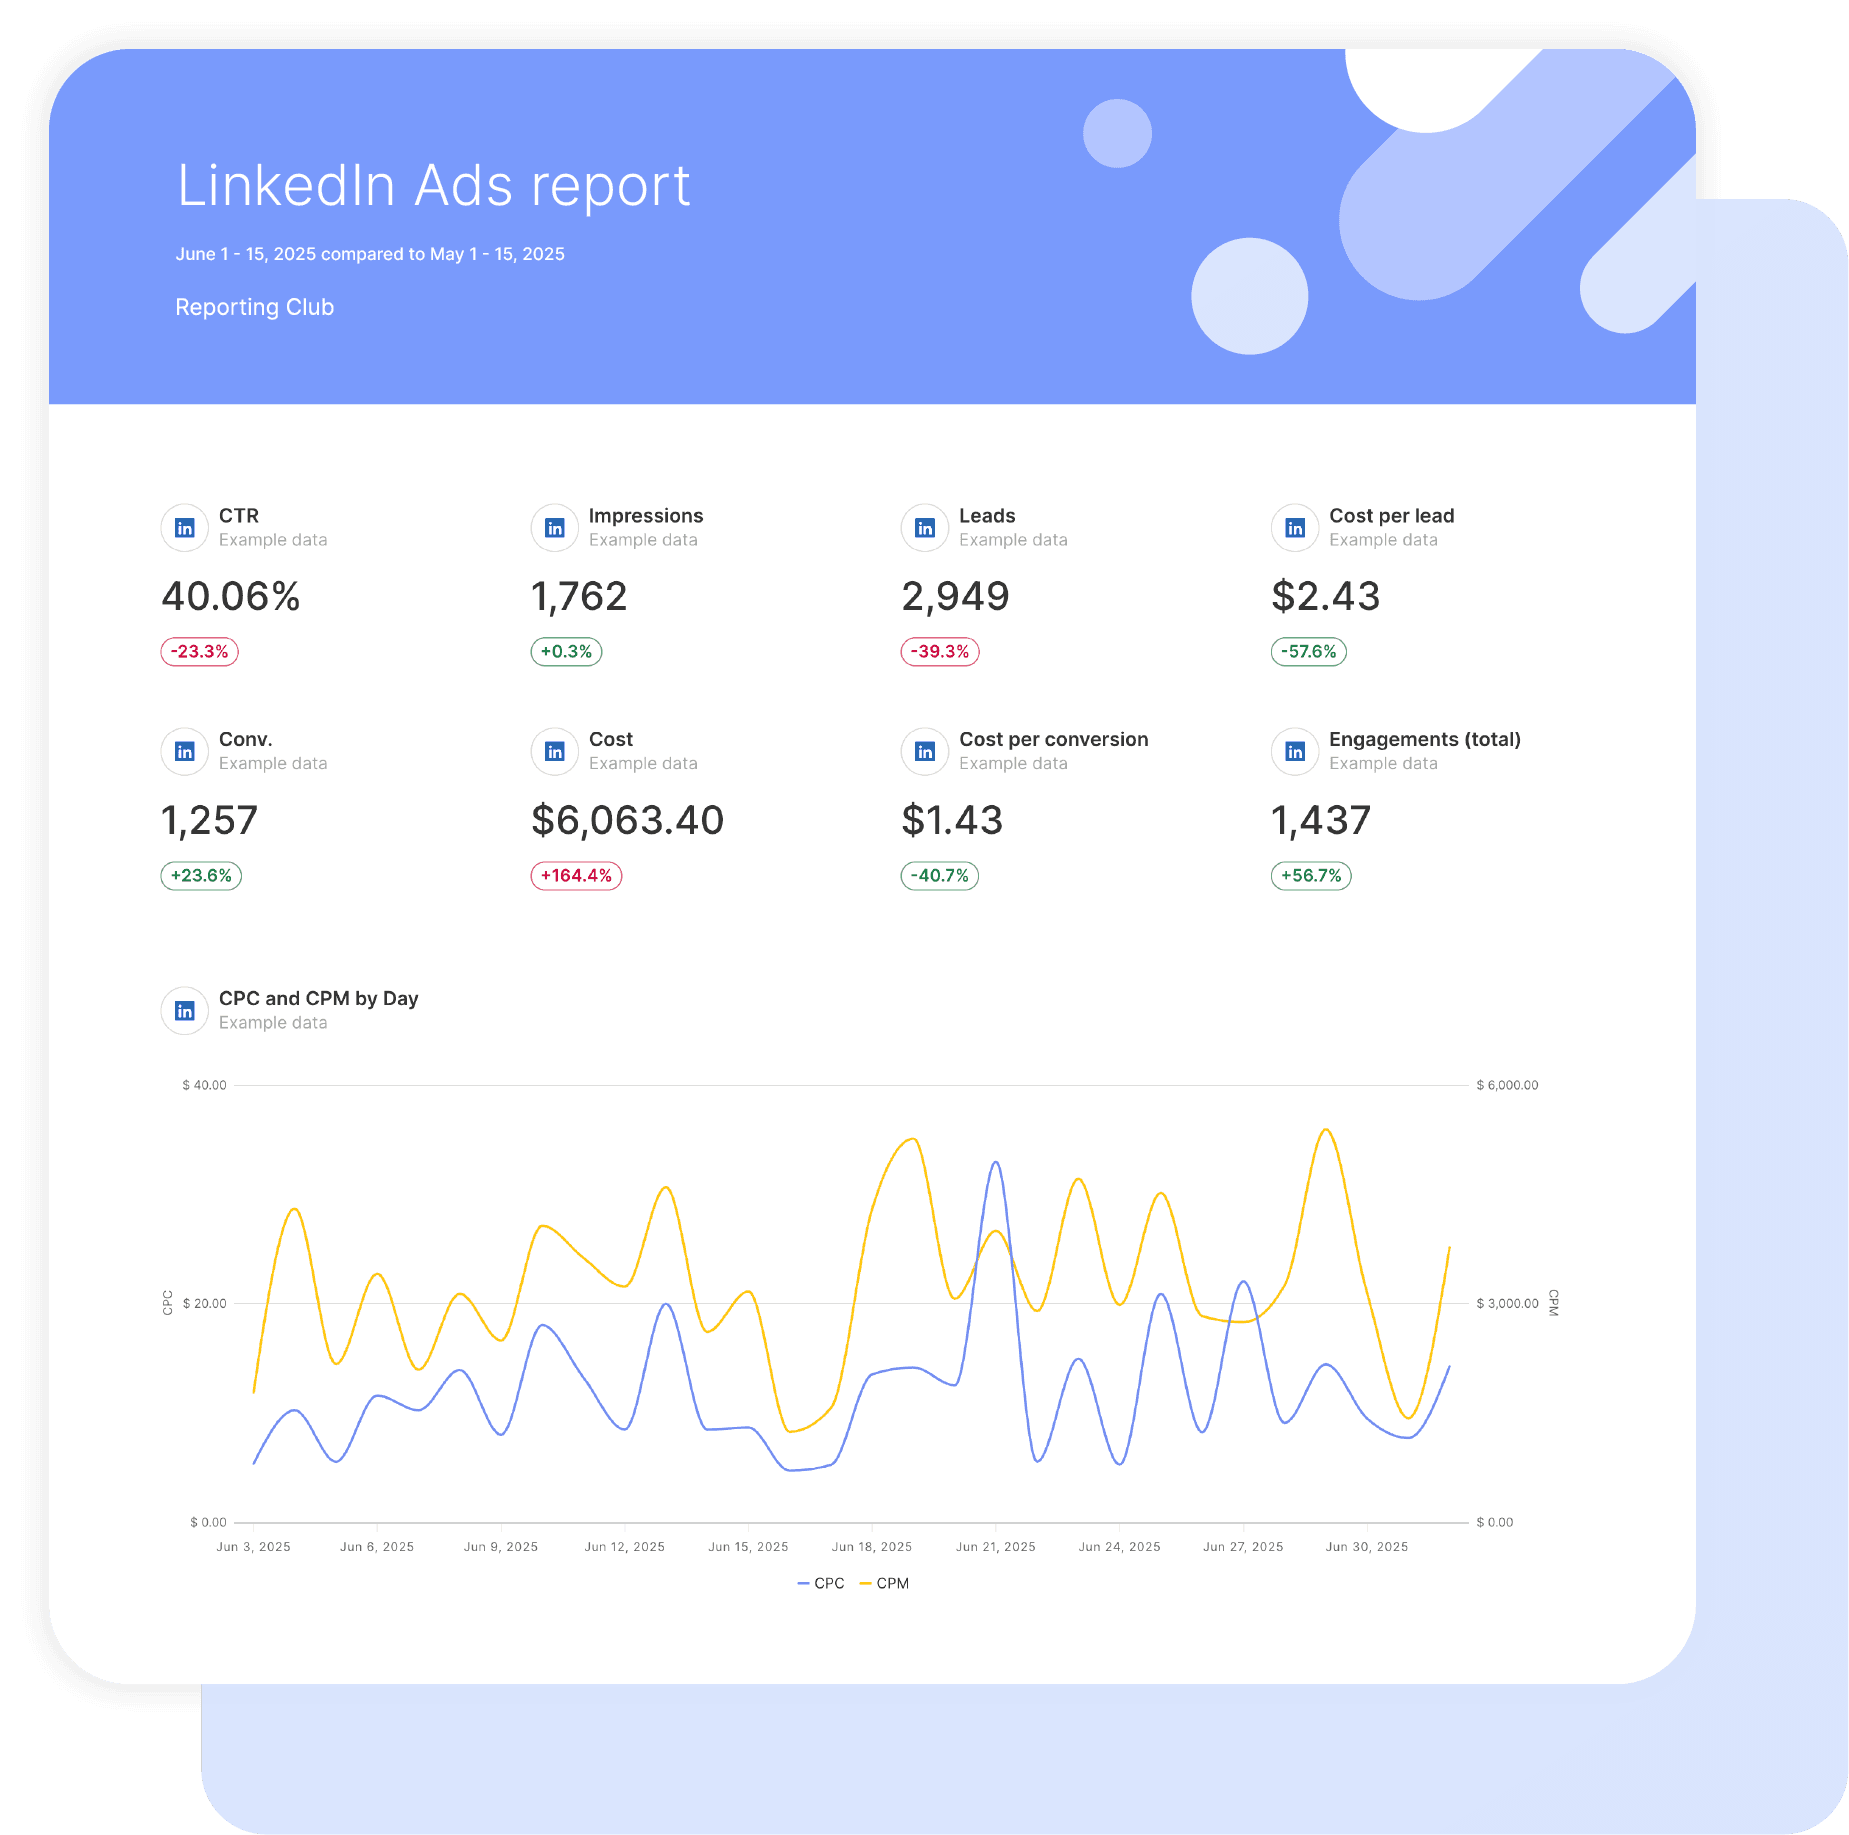
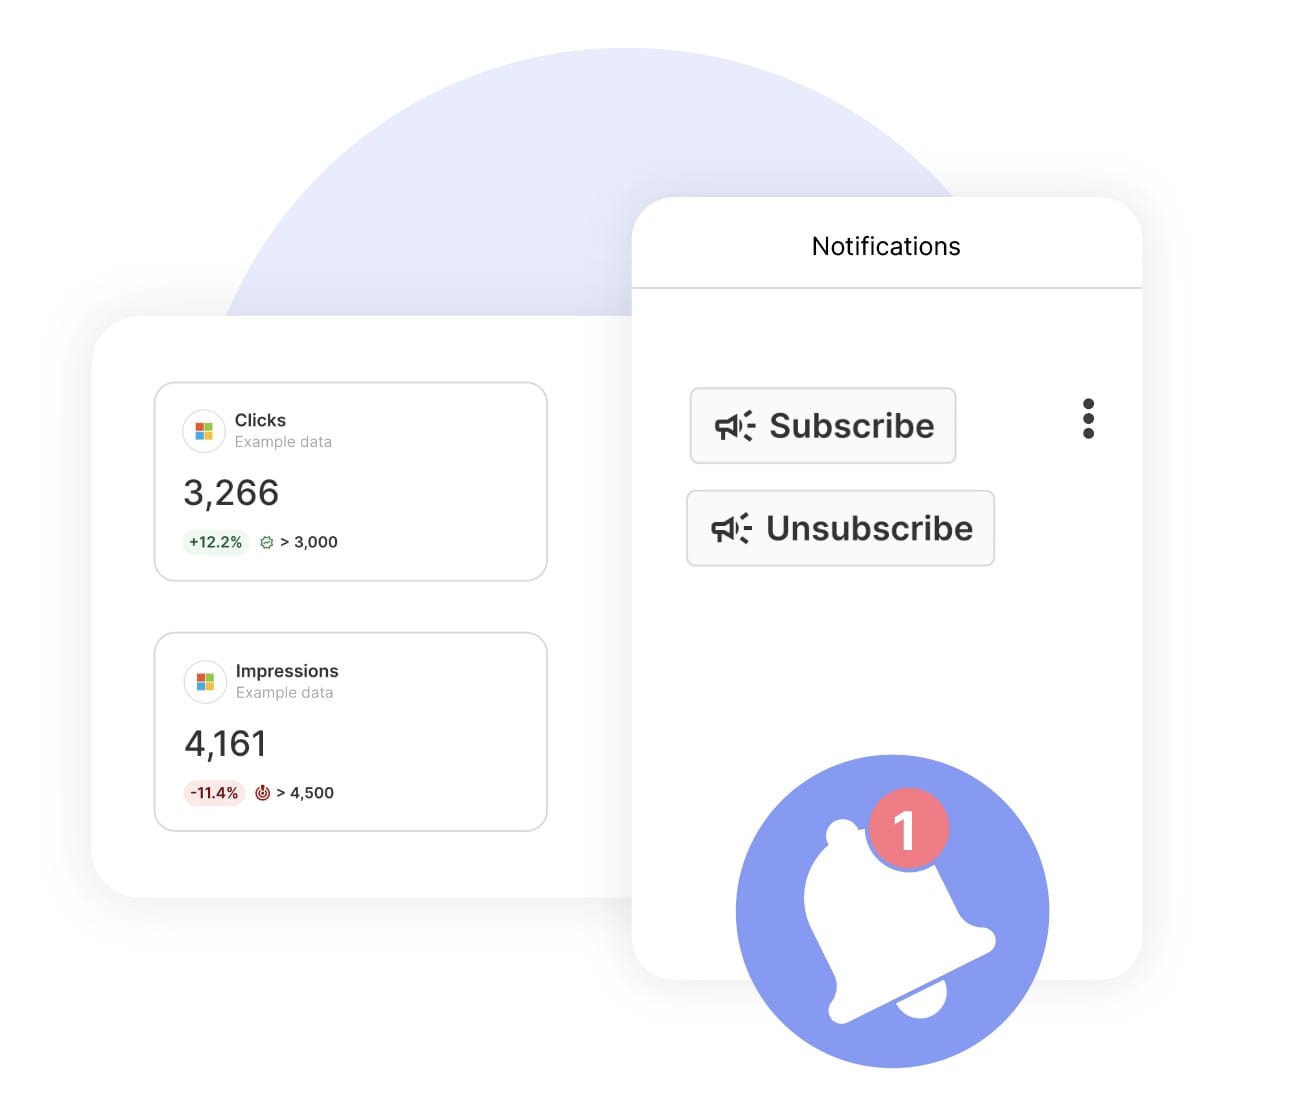
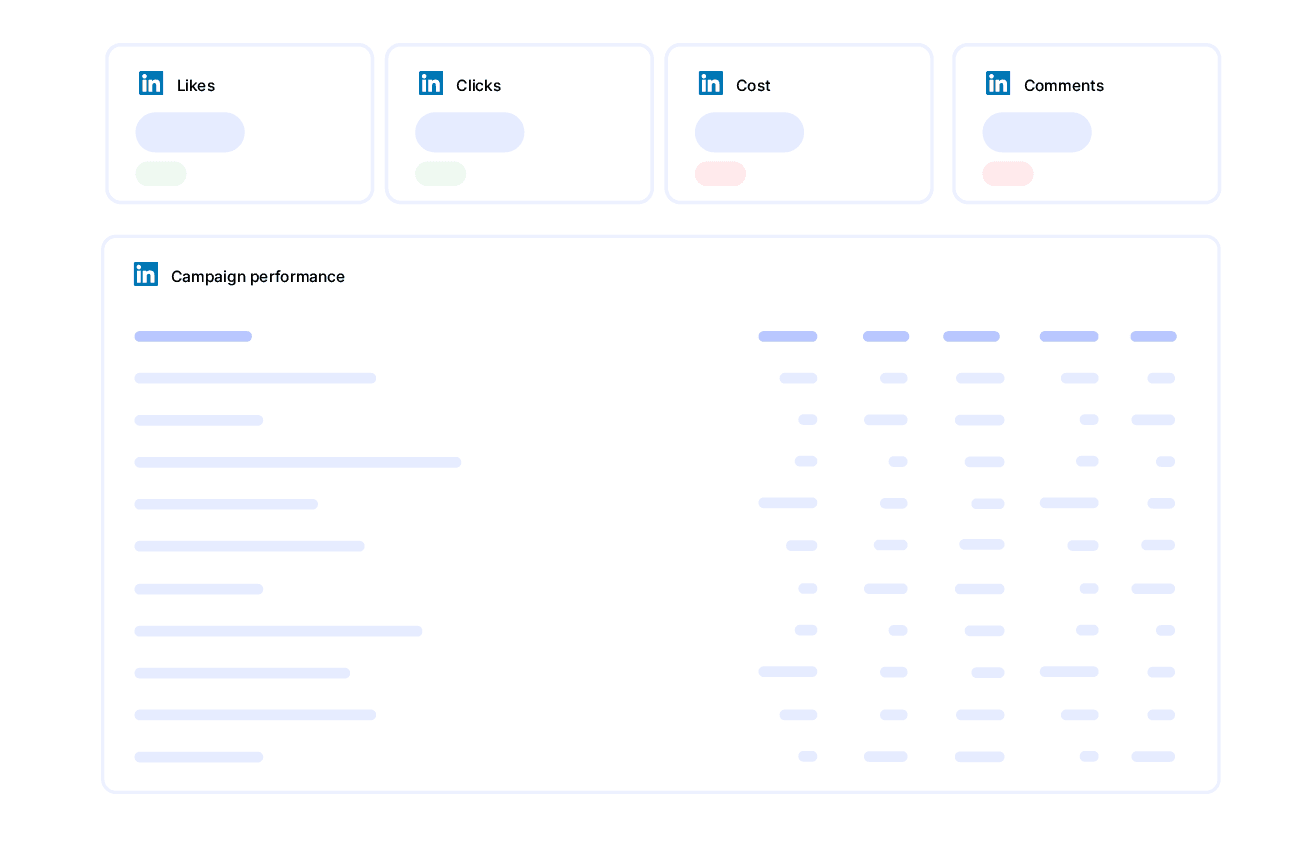
Track metrics that matter on LinkedIn: lead form completion rates, valid work email leads, professional engagement, and company page performance. No generic social media metrics—just LinkedIn expertise.
Professional Platform Focus
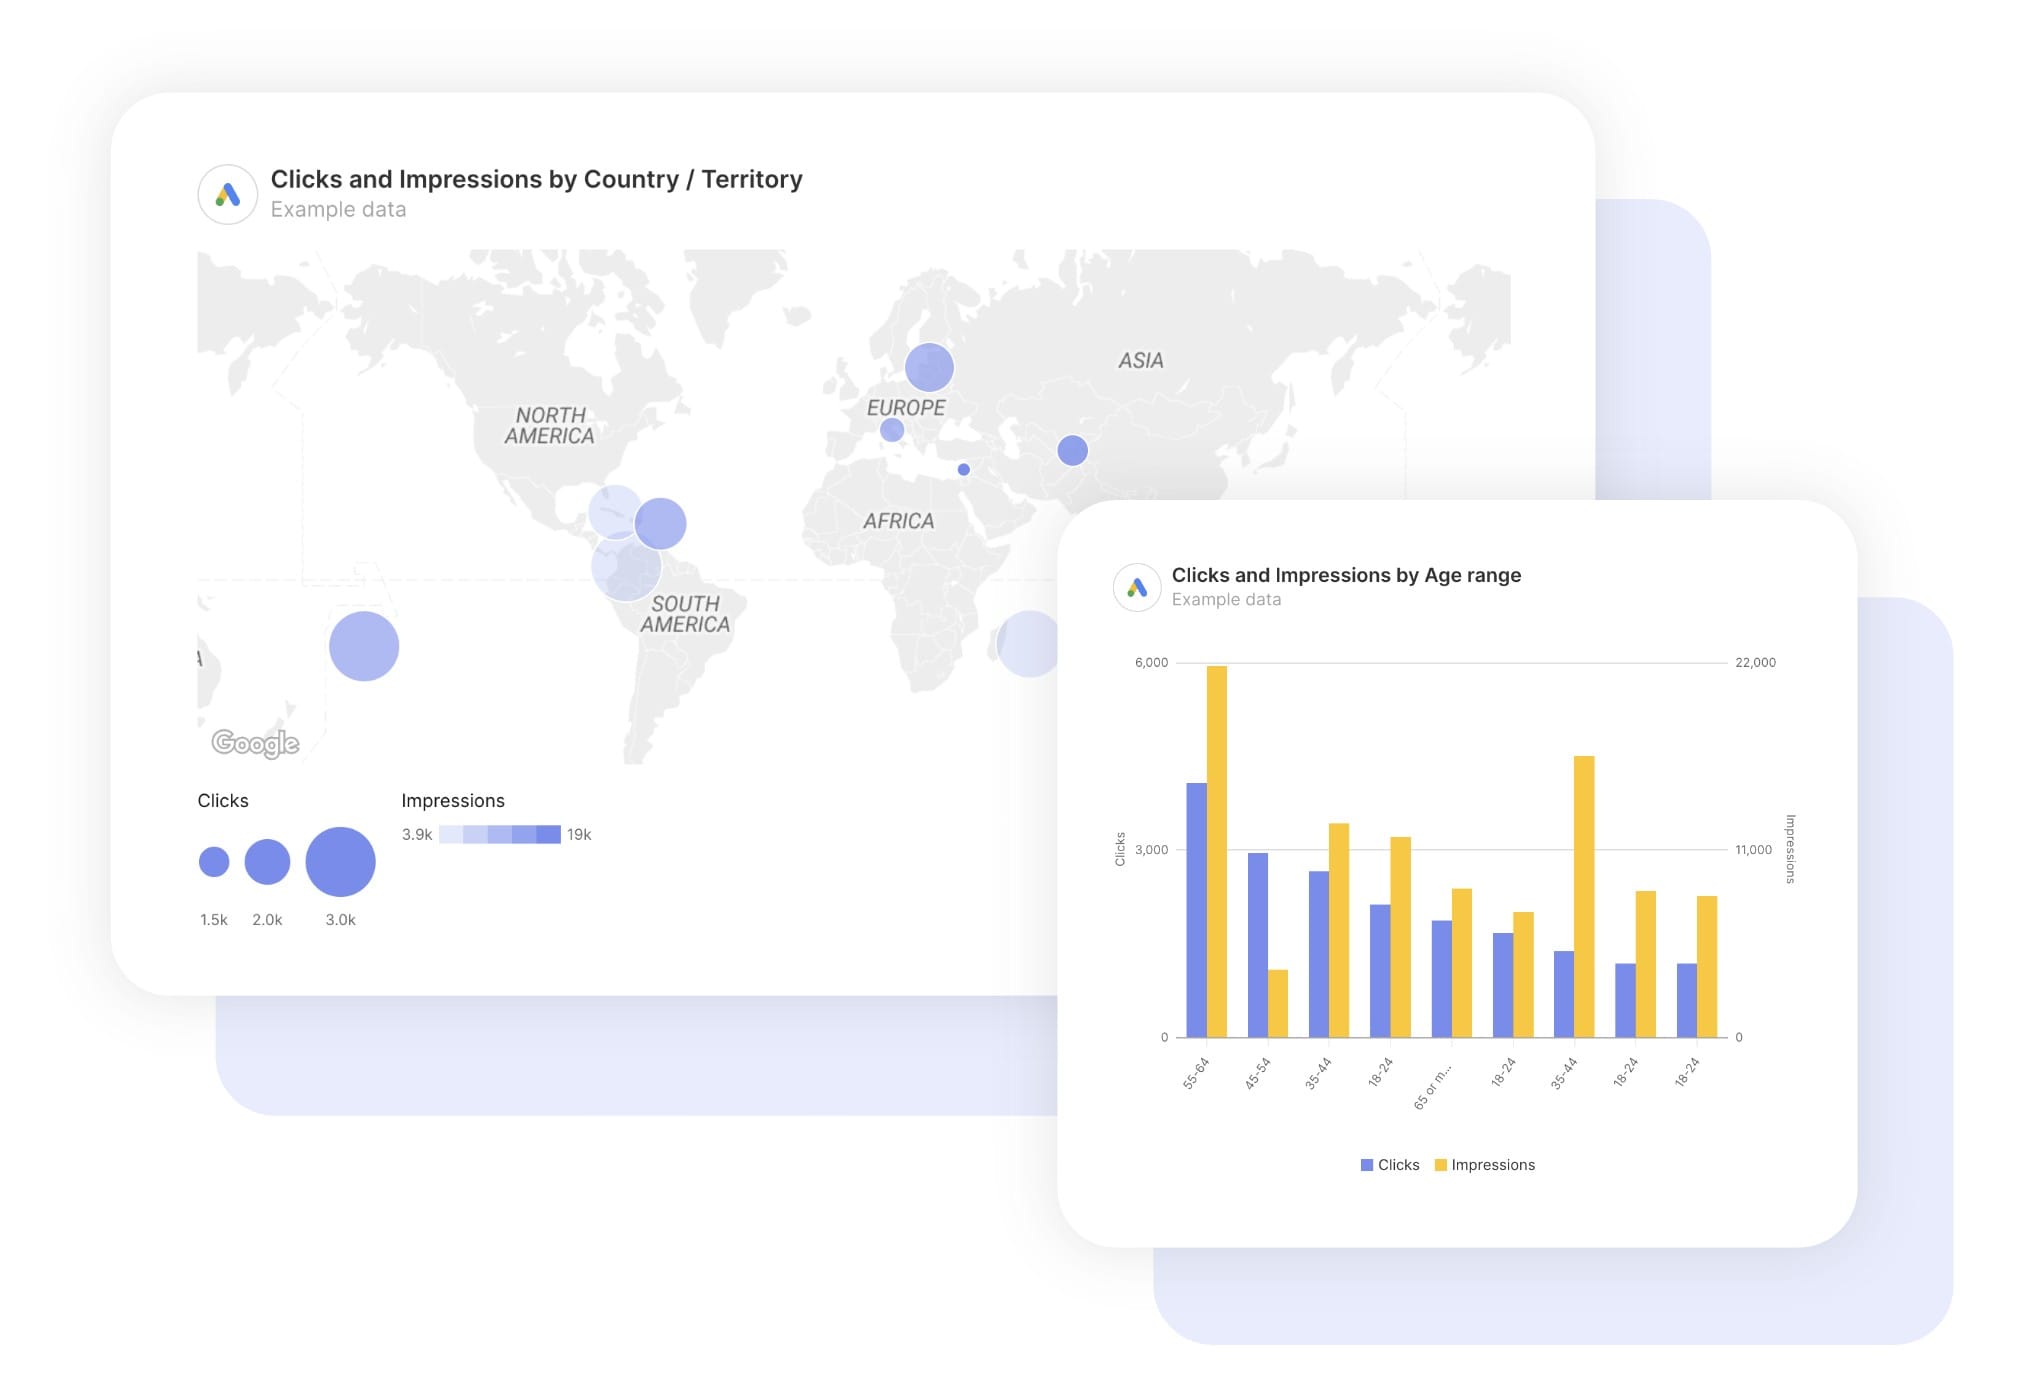
LinkedIn isn’t Facebook. Our template highlights professional targeting success, B2B engagement patterns, and business-focused conversion tracking that justifies LinkedIn’s premium pricing.
Custom Metric Intelligence
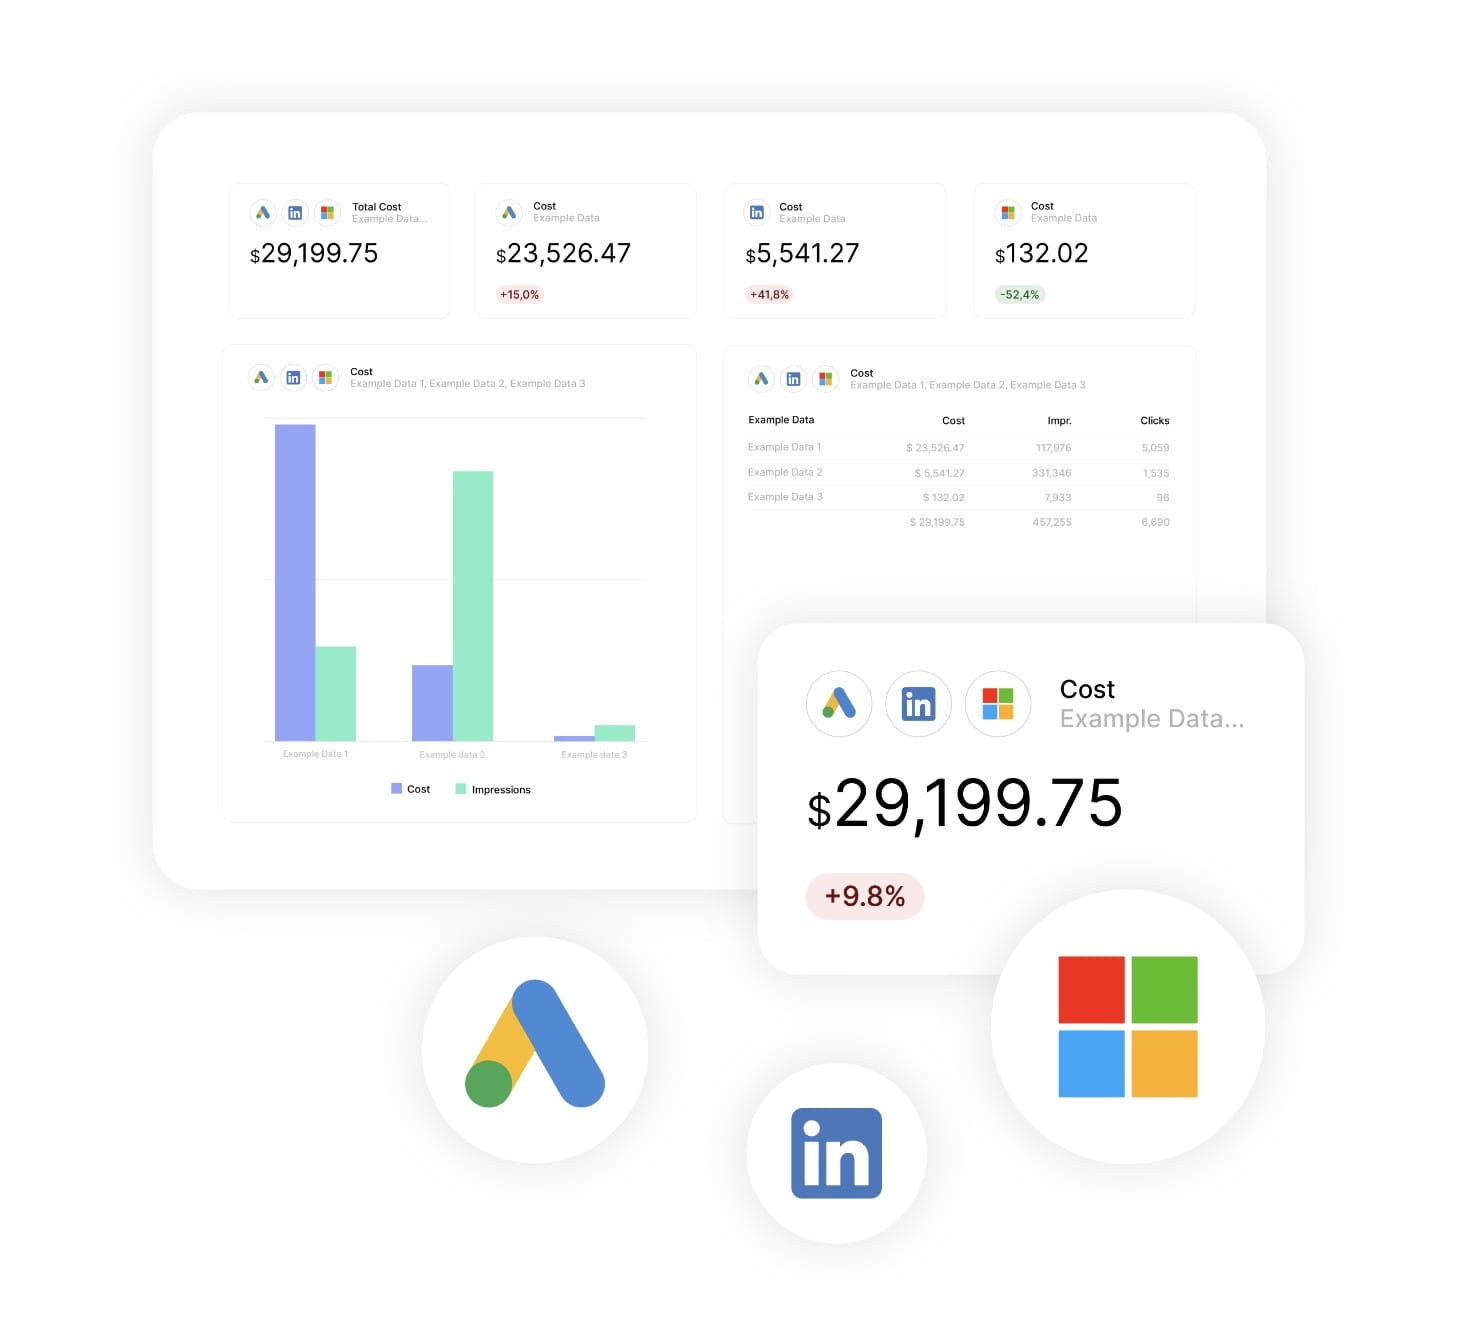
Create powerful custom calculations like cost per valid lead, professional engagement rates, and video completion efficiency. Combine any LinkedIn metrics to tell your unique success story.